
We took a look at the Premium Update from this time last year and we saw that the more things change the more they remain the same. It’s like the folk tale recounted by Martin Wolf in this week‘s Financial Times about a man sentenced to death by the king. The King tells him that he can get the sentence revoked if he can teach the monarch’s horse to talk within a year. The condemned man happily takes the deal. Asked why, he answers that anything might happen; the king might die; he might die; or the horse might learn to talk.
This time last year we wrote about the Greek crises and it seems that the European Union’s strategy of playing for time and hoping that Mr. Ed will learn to speak Greek has not helped the situation much.
It was just a year ago that Europe bailed out Greece. A year later Germany is looking good with growth accelerating and unemployment lower than at any time since German unification. The European Central Bank is even raising interest rates to curb inflation. Things are more or less level in France and Italy, each of which recorded G.D.P. growth of 1.5 percent in 2010, well below Germany’s 4.0 percent. But Greece is still a mess with an economy that shrank 6.6 percent, far more than the 1.9 percent decline in 2009. Greece has not managed to restore its creditworthiness and Greeks have not embraced the idea that they need to grit their collective teeth and suffer the austerity cuts for a better future. The cost of borrowing has risen and Greece’s chances of renewed access to private lending on terms that the country can afford are not promising.
This week’s anti-austerity strike in Greece and Standard & Poor's new warning about Portuguese banks exacerbated the euro-zone sovereign debt worries, sending the euro below $1.43 against the dollar and down more than 1% against sterling. Thousands Greek protesters took to the streets of Athens to demonstrate against the government's austerity measures, which were mandated by the European Union/International Monetary Fund bailout of Greek sovereign debt.
Like we said… things haven’t changed much. Last year at this time we wrote: The Greeks themselves are not exactly embracing the bailout, as evident by Greek demonstrations which turned deadly this week when three people were killed after protesters set fire to a bank in central Athens. It’s hard to rescue a country that doesn’t seem to want to be rescued.
This year’s May turmoil comes as fears grow that Greece could default on its debt next year without more help. The euro's drop, just a week after it hit a 17-month high versus the dollar above $1.49, accelerated after steep losses in stocks and commodities led to a stampede for the safe-haven dollar. (We can never truly understand investors who think that the dollar is a better safe haven than gold.) Speculation over whether Greece will receive more bailout funding kept risk appetite volatile with investors pricing in the possibility that the Hellenic Republic will eventually need to restructure its debt.
We believe that postponing the inevitable will not help the Greeks, but only make the debt restructuring hurt more when it finally does come. Greek debt is expected to exceed 160 per cent of gross domestic product and could easily go higher. As of now, markets are refusing to touch Greek debt – the latest indication is the recent S&P downgrade.
As Martin Wolf put it in his essay in the Financial Times: The alternative is a pre-emptive restructuring of the debt, perhaps next year. Since market prices tell us that this is what investors expect, it should not come as a shock to them. A restructuring ought to raise the country’s creditworthiness and increase the incentives to sustain a programme of stabilisation and reform. Moreover, with a planned, pre-emptive restructuring the authorities could also prepare the needed support for banks, both inside Greece and outside it.
Needless to say, this would still be a big mess. Moreover, there is no certainty that a restructuring would return Greece to growth, since the country also suffers from a lack of competitiveness. Inside the eurozone, no simple way of resolving the latter weakness exists. The country may be doomed to prolonged deflation. However unpopular restructuring might be, the alternative would be worse. The debt would then need to be financed indefinitely.
A Two Alert Week
We sent out a message Wednesday saying that even though precious metals decline the reason for not selling right now is the situation in the USD and Euro Indices. It appears to have great influence on the precious metals market at the moment and both indices are currently right at their respective resistance/support levels. This situation is particularly visible in euro which is right at the early November 2010 high and at the same time it’s at the declining support line (as featured in the latest Premium Update).
Since the above-mentioned resistance/support levels have not been broken, the trends remain down for USD and up for euro. If we get a bounce from these levels and currencies move along with their trends, then precious metals are likely to rally again. On the other hand, if USD rallies significantly from here and euro declines, then metals would likely decline as well. However, since the trend in the former did not change, a rally in the metals is still more likely than not.
With metals declining again yesterday and with both of our Extreme Indicators flashing a signal based on Wednesday’s closing prices, we sent out second message Thursday.
(This) suggests that another rebound is likely. If it wasn't for these indicators we would have suggested closing the speculative long positions, as the risk/reward ratio would not be favorable. Still, since these indicators have in fact flashed a signal, it seems that we're close to the second bottom of a double bottom pattern.
Meanwhile, the USD and Euro Indices that we wrote about yesterday have moved through their resistance/support levels but this move has not been confirmed.
With so much happening in the markets let’s turn to the technical part with analysis of the Euro Index. We will start with the long-term chart (charts courtesy by http://stockcharts.com.)
Euro - USD Indices
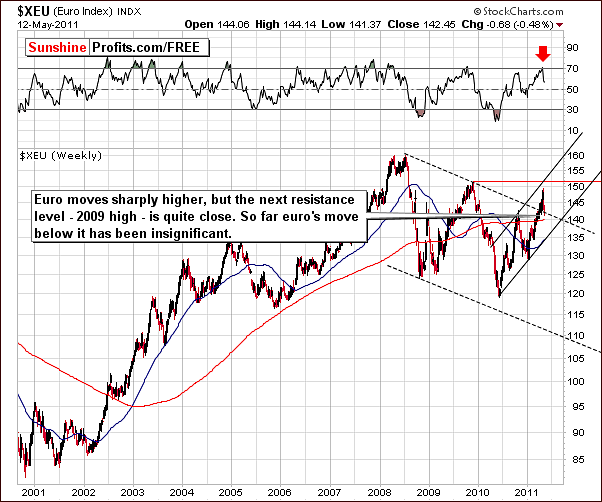
In the long-term Euro Index chart this week, we have seen some declines. Although it could be argued that the euro has moved below the declining support line, this is truly quite insignificant and barely visible in the chart. We view this as a correction within the rally and not as a decline – at least not yet. There does not appear to have been any real change in the trend - only a temporary contra-trend move.
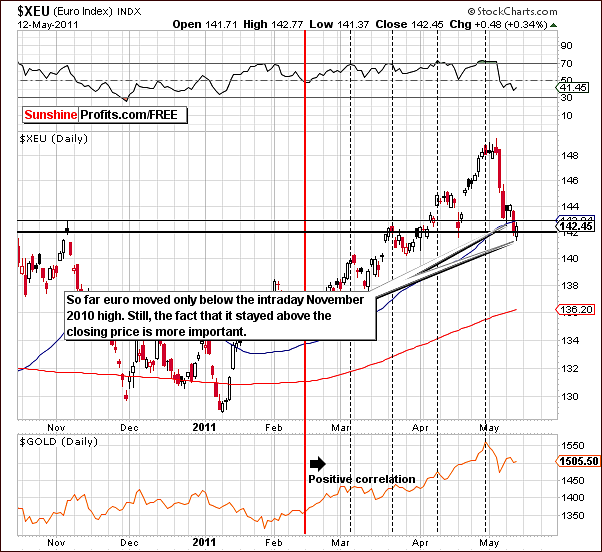
In the short-term Euro Index chart, as we mentioned last week, we see a support line based on the November 2010 highs. In fact, this level has been broken on an intra-day basis when the price of the euro moved below it. Based on closing prices on the November high, however, no breakdown has been seen.
This level is more important than intra-day highs and has more profound implications. Wednesday’s move to this level was reversed on Thursday and the index level is now above this support line. The trend therefore remains up.
Although the short-term chart alone may first appear to contradict a continuation of the rally, taking the long-term chart into account shows that the breakout has not yet been invalidated.
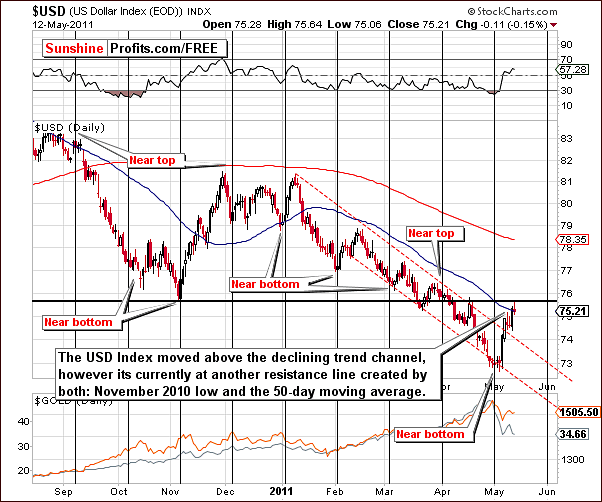
In this week’s short-term USD Index chart, we see the usual reflection of what has happened in the Euro Index. The highs of November 2010 seen in the Euro Index correspond to lows here in the USD Index.
The 50-day moving average is also in play here - we can see that it has provided support and resistance for the USD Index level on several occasions in the past and may very well do so again.
Before summarizing, let’s take a look at the general seasonal tendencies in the USD Index.
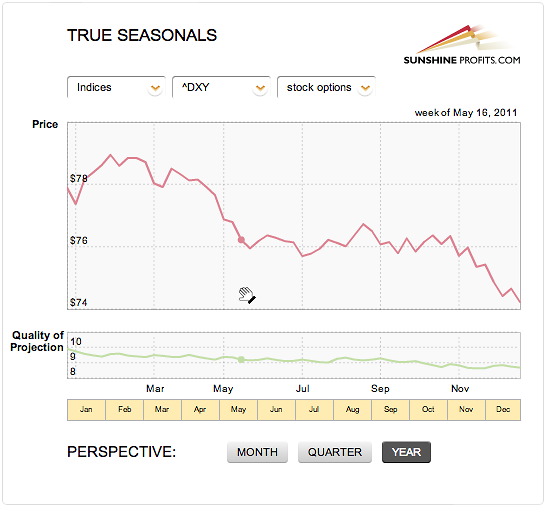
Please note that the end of May on average marks the end of the decline – we are close to this point, but not yet at it, so further declines or a re-test of the previous bottom is quite likely. We will comment on the implications in the following part of the update.
In case you’ve been wondering, yes, the chart below is actually a screenshot taken from our new soon-to-be-released version of the website. If you have subscribed recently, we encourage you to go through the February 18th Premium Update in which we featured the True Seasonals phenomenon. In short – this is not an ordinary seasonal chart that you might have seen on the Internet. It’s much more in-depth as it takes into account derivatives’ expirations’ influence on the prices of a given asset - and actually our website is the only place that provides these charts.
Summing up, even though it may appear that support and resistance lines have been broken this week in the currency markets, such is not the case. The USD Index did rally slightly but is tied to the Euro Index which has definitely not invalidated its previous breakout.
The key factor here is that the very long-term Euro Index chart is still bullish and it follows that the sentiment for the USD Index is therefore bearish. Declines are much more likely in the short-term for the dollar than a continuation of the small rally seen this week. Furthermore, with gold being positively correlated with the euro, a short-term rally for the precious metals sector is quite possible as well. This would be very much in tune with the seasonal tendencies present on the dollar market.
General Stock Market
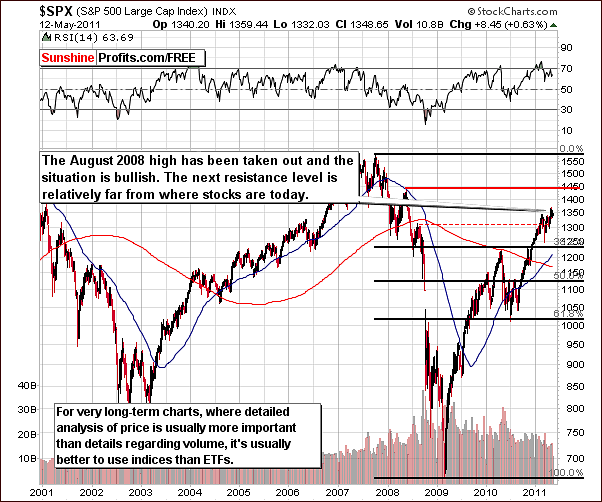
In the very long-term general stock market chart this week, there is no significant change and the situation remains positive. Stocks took out the 2008 highs, consolidated, and are now ready to move higher. The next resistance level is far above where we find stock prices today and the medium-term outlook is bullish.
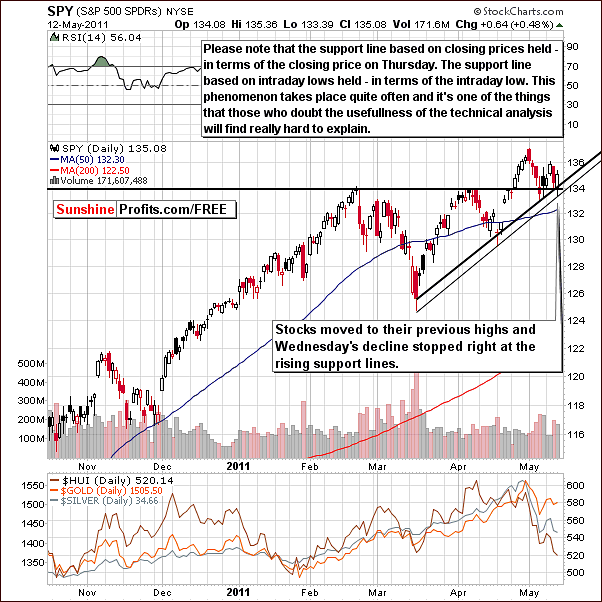
In this week’s short-term SPY ETF chart (proxy for the S&P 500 Index that allows us to analyze volume), we see that an attempt to move below the level of the February highs has failed. Stocks have temporarily moved below the support line created by the February high and the March and April closing prices. This move was seen on an intra-day basis, another support line was touched and then the trend reversed with vengeance. Closing back above all these support lines is an obvious reversal and a truly bullish phenomenon. Volume levels on Thursday were also significant though slightly less than those seen on Wednesday.
Summing up, the situation looks bullish for stocks in many ways and this will have rather positive implication upon the precious metal sector as will be discussed in the following section of this update.
Correlation Matrix
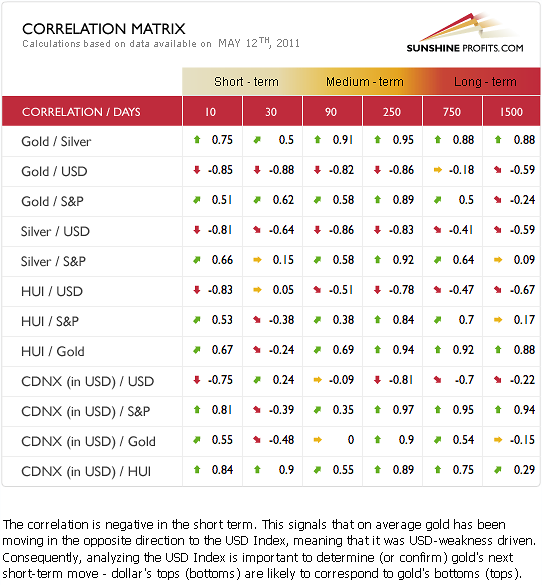
In this week’s Correlation Matrix, we see that gold is negatively correlated with the USD Index. This is also generally true for the rest of the precious metal sector. In the short term (30-day column), the coefficients are positive for gold and the general stock market though mixed with respect to silver. The mining stocks are slightly negatively correlated with the general stock market and appear to have stopped responding to the influence of stocks.
There is a negative correlation between the dollar and the precious metal sector, so the suggestion that recent currency market trends have not been broken makes the short-term rallies in the precious metals sector likely.
The short-term column readings suggest strength for the general stock market and this will most likely have a positive impact on gold. The situation is not as clear for silver and mining stocks as in these cases the correlation with stocks is weaker. Gold has performed strongly this week compared to silver and gold and silver mining stocks. Please note that we have been favoring gold over silver and mining stocks for a few weeks.
Gold
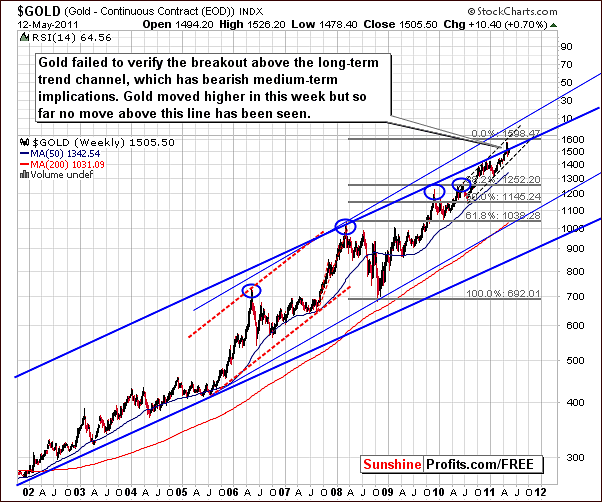
This week’s very long-term chart for gold continues to gives us some indications that the medium-term trend now appears to be down. The yellow metal did not move above the rising trend channel this week. No breakout was seen in this week’s small rally. Although gold will have what appear to be a final chance to break out in the coming weeks, this does not appear very likely.
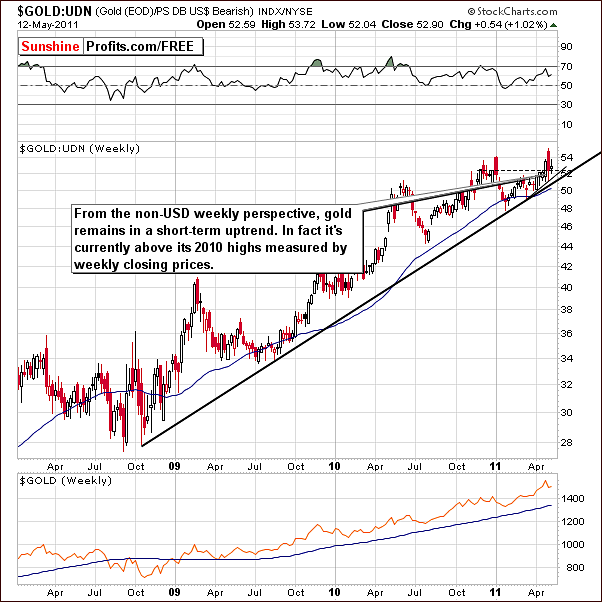
From a non-USD perspective, we see a much different picture and this is a good example of why we look at multiple charts every week in an effort to best interpret what has happened and what is likely to happen in the days and weeks ahead.
This week gold remained in an uptrend from a non-USD perspective and did not move below the levels of highs seen in 2010 (based on weekly closing prices). This is a bullish signal and another positive sign is that the very short-term support line was also upheld even though gold declined significantly last week.
Consequently, this week’s developments, in terms of currencies other than the dollar does give us bullish signs for both the short term and medium term.
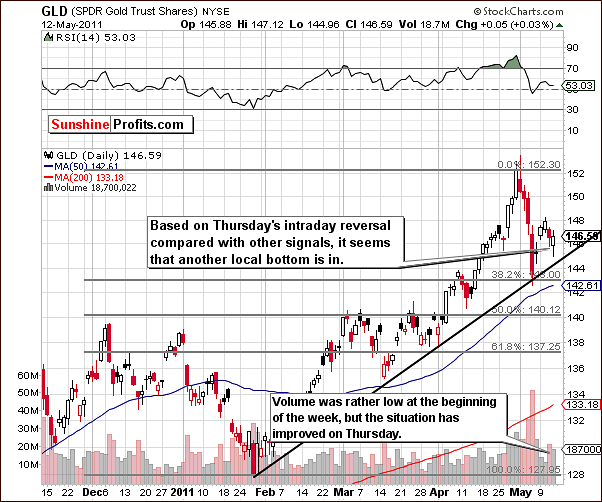
In this week’s short term GLD ETF chart, we see a situation that is somewhat mixed if we look solely at this particular chart. The week began on a rather unfavorable note with weak volume levels but did turn around nicely on Thursday with significant volume.
The final outcome here based on what we’ve seen in the past couple of days is bullish. The short-term trend appears to remain upwards but whether or not it will move above the long-term resistance line (visible on the very-long-term gold chart provided earlier in this section) is still questionable. The most likely scenario here is that we have seen a correction within a bigger decline and this correction does not yet appear to be over.
Let’s see how the above analysis fits into the current seasonal trends.
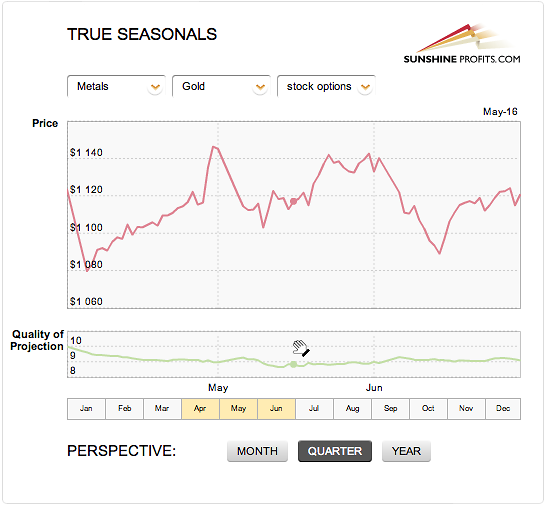
What we see above is definitely bullish in the short term. Please ignore the legend on the left side of the chart and focus on the red line on the chart representing the price of gold. Averaging gold’s performance in previous Mays and taking into account the derivatives whose expiry date is closest to where we are today (stock options in this case) allows us to see that we are most likely in the corrective stage of the decline. This is precisely what the previous analysis suggests, so the odds of it being correct are quite high.
Summing up, the medium term does indeed look bearish for the yellow metal but there appears to be a bit of life left in the slight correction (rally) within this downtrend. From a non-USD perspective, things look much better, but overall the mixed situation pretty much makes the outlook medium-term bearish overall. Long-term investments should continue to be held for now, and the current bet on the short-term rally in gold appears justified from the risk/reward perspective.
Silver
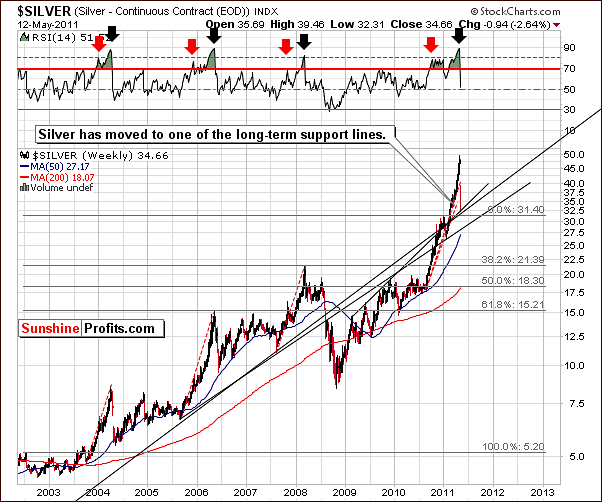
This week we will include two very long-term charts to show several important developments. In our first chart, we can see that silver has moved to one of the long-term support lines. Although silver’s price did move up and down erratically this week, a corrective rally seems to be quite likely from here.
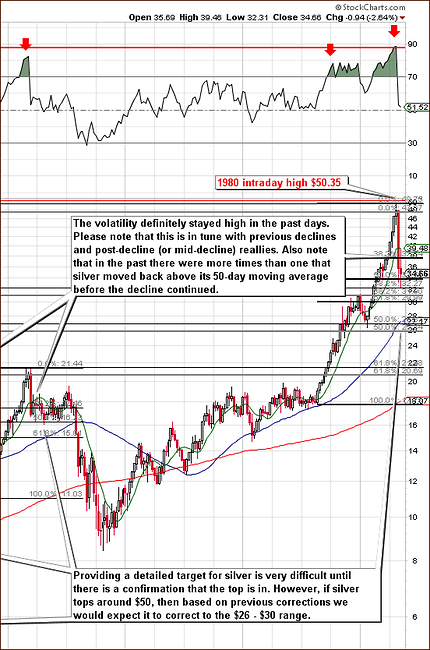
Zooming in (click on the above chart to enlarge it) for a closer look at silver’s very long-term trends, we can see that when silver corrected its decline, it did so above the 50-day moving average (green line on the chart). This level was touched only briefly but silver didn’t move above it. Still that’s not the most important thing that we see on this chart.
The more important thing is the time. Please note that in the past silver’s price has moved above the 50-day moving average more than once after the first part of the decline. This trend was seen in 2006 and 2008 and in both years, a bigger move to the upside was seen in the weeks following the decline. The implications here are that silver is still likely to move higher in the short term before the decline continues.
Based on silver the recent performance of the white metal, we have slightly adjusted our targets for this decline. It now appears that the medium-term target for silver’s decline will be in the range of $26 to $30. Obviously, this indicates that more declines are coming in the price of the white metal in the medium-term, even though the short-term situation appears bullish.
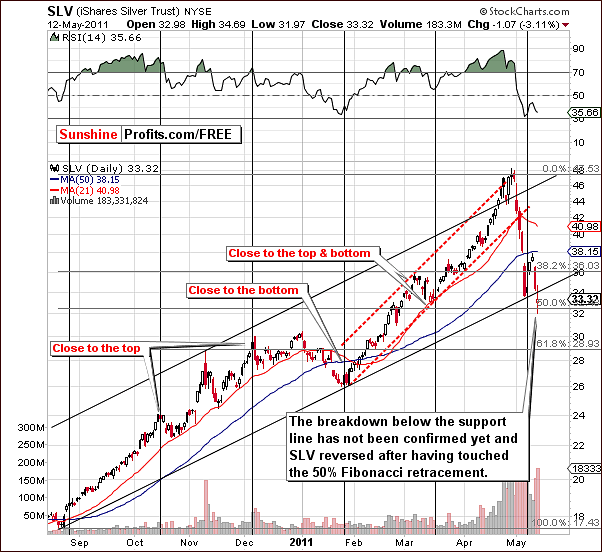
In the short-term chart this week, we see that silver has moved below the very short-term support line, although this move has not been confirmed. The decline has stopped at the 50% Fibonacci retracement level of the previous big rally.
At this point, the situation is not as bearish as it may first appear even though silver has moved below the rising trend channel. Remember that long-term charts carry much more weight than the short-term ones and are generally considered more important when the two are in conflict.
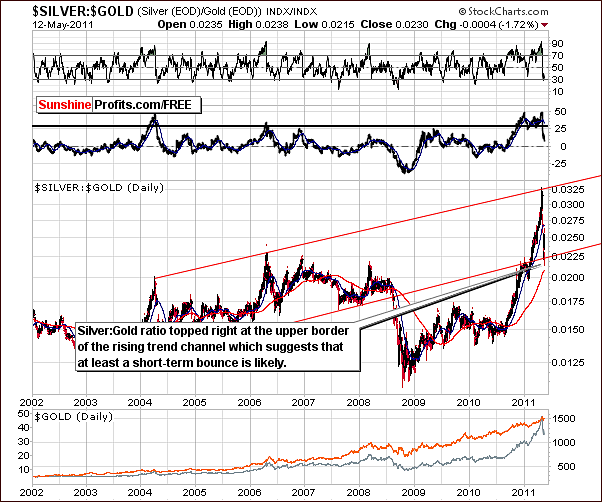
In the Silver:Gold Ratio chart this week, we see that the ratio is right at the lower border of the rising trend channel. Although the decline from the top of the channel to the bottom was sharp and rapid, it stopped at the support line, which leads us to believe that a short-term rally (a bounce) from here is quite likely.
Summing up, the situation for silver looks somewhat less bullish than what was seen for gold. Still, analysis of the long-term chart suggests that a turnaround is clearly possible and the silver:gold ratio also suggests that this is quite likely. At the time of writing these words it seems that silver investors are not getting overly paraskevidekatriaphobic and have already started to bet on higher prices – silver moved about $1 higher so far today.
Gold and Silver Mining Stocks
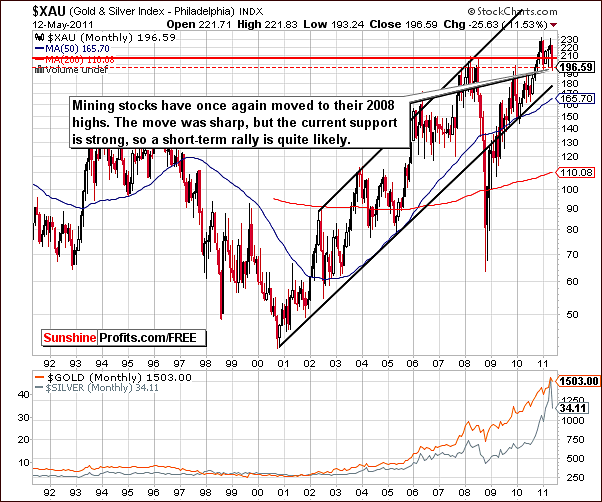
We turn now to the gold and silver mining stocks where this week we saw additional weakness throughout this part of the precious metals sector. In the XAU Index chart this week, we see that the gold and silver mining stocks did not move below the important levels of the 2008 highs based on monthly closing prices. It is important that this support level was not broken at this market juncture; this leads us to conclude that the situation is at least somewhat positive in the short-term.
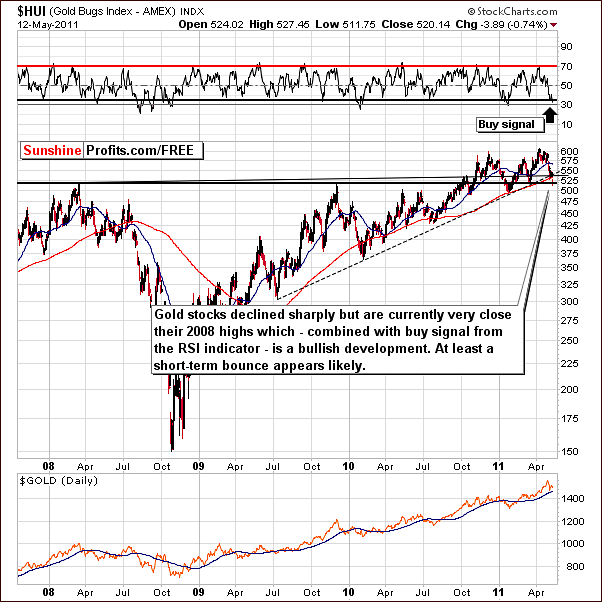
In the HUI Index chart this week, we see a move below the rising support line, but the support level of the 2008 and 2009 highs have held this decline in check. This point along with the buy signal generated by an RSI level close to 30 makes a turnaround appear to be close. Perhaps this will be seen in the days ahead.
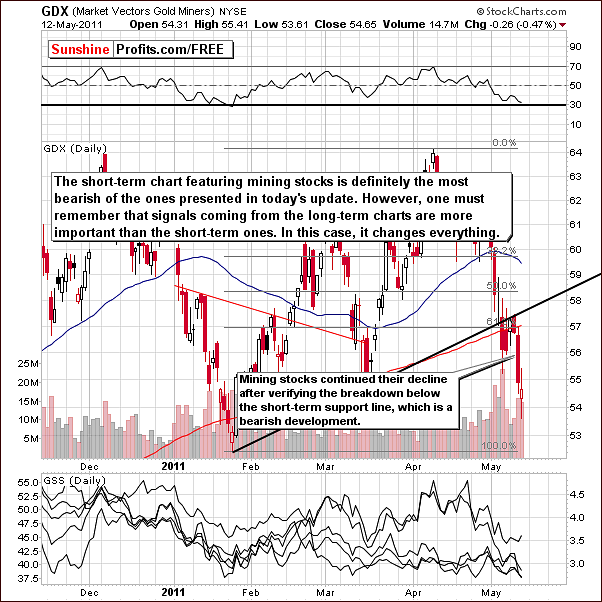
In this week’s GDX ETF chart, we also see an RSI level close to 30. However, there are bearish signs here in terms of this week’s price action. The decline moved below the short-term support line and continued downward.
Once again, we must yield to the signals of the long-term chart as opposed to the short-term bearish signs here. We have simply seen a less important short-term support level broken. The long-term support line held, and coupled with a turnaround based on the RSI indicator and the situation described in other charts in this update, leads us to believe that a short-term rally from here is quite probable.
This week we have included a chart which has not been part of our weekly publication since our Premium Update January 28th 2011.
Here’s a quick reminder:
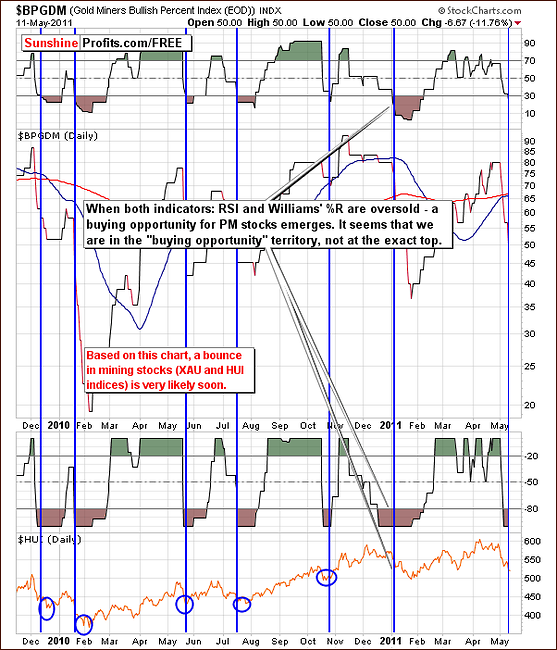
The Gold Miners Bullish Percent Index is a market breadth/momentum indicator and is calculated by dividing two numbers: the amount of gold stocks on the buy signal (according to the point and figure chart, which emphasizes strong moves while ignoring small ones) and the amount of all gold stocks in the sector. If every gold stock is rising, then the value of the index will be at 100%, which raises a red flag as everyone interested in the market is already in, and the top will soon emerge.
If you look closely you will notice two additional tools in the above chart. The RSI (Relative Strength Index) is a technical momentum indicator that compares the magnitude of recent gains to recent losses in an attempt to determine overbought and oversold conditions.
The RSI also ranges from 0 to 100 with an asset deemed to be overbought once the RSI approaches the 70 level, meaning that it may be getting overvalued and is a good candidate for a pullback. Likewise, if the RSI approaches 30, it is an indication that the asset may be getting oversold and likely to become undervalued. If you look at the RSI indicator in the above chart, you can clearly see that it in fact just moved below the 30 mark.
Another indicator on this chart is the Williams %R, also a momentum indicator that is especially popular for measuring overbought and oversold levels during horizontal trends. Bullish percent indexes take values from 0% to 100% and obviously cannot rise above that level, so it can be viewed as a horizontal trend. Named for its developer, Larry Williams, the scale ranges from 0 to -100 with readings from 0 to -20 considered overbought, and readings from -80 to -100 considered oversold. This overbought signal has appeared in the recent days, which suggests that we will see PMs higher in the not too distant future.
Currently both: RSI and William's %R indicators suggest that a local bottom is in or very close and we believe that the combination of these two indicators here provides the best signals.
Summing up, although at first glance the situation for gold and silver mining stocks appears to be bearish, the sharp and rapid decline appears to have led to an oversold situation and reaching of a strong support level. Therefore a corrective upswing seems due and is expected sooner rather than later.
Sunshine Profits Indicators
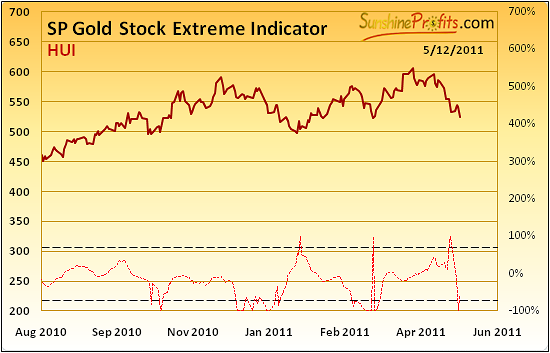
Our first of two Sunshine Profits Indicators that we would like to feature this week is the Gold Stock Extreme Indicator. This tool has correctly indicated local bottoms virtually in all cases since 2008 (although short-lived in case of silver, the recent rally was also preceded by this signal). There is currently an extreme reading seen, as was the case in March at a time which corresponded to a previous low. At this point, the likelihood of the bottom being in for the whole precious metals sector or close-at-hand has increased dramatically.
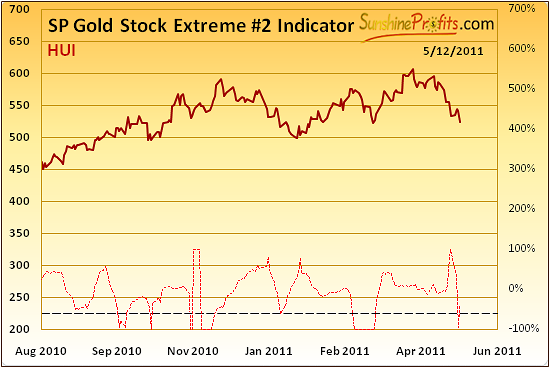
Our second indicator chart presents the Gold Stock Extreme #2 Indicator. This chart has provided more signals in the past but is somewhat less precise. Upon close examination, however, it appears to be a valuable addition to most of the other analysis on this issue. This time it serves as an indication that we are in a similar situation to the one in mid-March and also when other bottoms were formed. So, we have two confirmations by two Sunshine Profits Indicators pointing to a local bottom being formed.
Letters from Subscribers
This week we witnessed increased volatility in silver market and it no wonder that we have received many questions about silver fundamentals and the COMEX margin requirement hike. For those of you who are concerned with the possible deterioration in silver's fundamentals (and long-term targets), here's a quote of someone in the business.
Panic is what I see in the people wanting to buy silver. Gold buyers are few in number with silver being the main play. Some people wanting to buy silver coin instead of one ounce rounds and 10 ounce bars. There is a keen sense of despair that the dollar will collapse among silver buyers. Diamonds are not in demand as they were in 1979-80. Rare coins were also high on the list of peddlers taking advantage of people who knew nothing about coin investments. A lot of people during the Carter administration took advantage of the high interest rates the banks were offering. Interest rates as high as 17%. We were deluged with people selling sterling silver flat ware and hollow ware causing a back up in the smelting process. This drop in the silver price will probably be good for silver because it will give the silver stream a chance to clear up.
(…) I feel confident the price of silver will recover. After all, nothing has changed.
The margin increase will also have a negative impact on silver.
Please note that we’ve put a part of the quote in bold. The reason is that this is a confirmation of what we’ve described in the Correlations this week – silver is moving against the USD Index, which – taking into account the situation in the USD Index, suggests that a short-term rally in silver and the rest of the precious metals sector may very well be seen soon.
Summing up, we agree that the long-term situation is still favorable and that silver is very likely to move above $50 - however not necessarily right away.
An additional point about margin requirements - rising margin requirements are natural when prices are rising and are needed for the margin to stay in the same range percentage-wise (about 6% - 8% for silver). Yes, an increase in the margin is something bearish for the short-term (and, as we've seen, can be the spark that ignites a decline), but unless the margin really increases percentage-wise (!) it doesn't change anything from the long-term perspective - we are still long-term bullish on the precious metals sector and think silver will trade much above $50 in the following years.
Summary
The currency markets this week at first glance appear to have changed their trends, but a closer look indicates that this is not the case. The trend remains up for the Euro Index and down for the USD Index and the impact will likely be positive of the precious metal sector in the days and weeks ahead. It appears that nothing more than contra-trend moves were seen this week.
The general stock market is poised for another rally and this will likely lead to a rally for gold. The impact for silver and gold and silver mining stocks is somewhat less precise but is still likely positive moving forward for the short term.
Precious metals sector declined in mid-week but gold held for the most part even showing some slightly upward movement on Thursday. It still appears that we are in the early stages of a corrective phase in the precious metals markets. This corrective rally within the decline is something that one could bet on. In this case the risk/reward ratio appears most favorable for gold. In other words, our current bet on higher gold prices in the short term appears justified.
We will continue to keep you updated as soon as further details become available – just like it was the case this week. It seems that you might want to check your e-mail inbox more frequently than usually as the volatility on the market is truly extraordinary.
Our next Premium Update is scheduled for Friday, May 20, 2011.
This completes this week's Premium Update.
Thank you for using the Premium Service. Have a great weekend and profitable week!
Sincerely,
Przemyslaw Radomski

