
No, we’re not going to talk about Osama Bin Laden’s capture and how it relates to gold. It doesn’t. Instead, we’ll turn our attention to silver. Two weeks of gains for silver were erased in only 11 minutes this Monday as markets opened for electronic trading in Asia with prices falling as much as 12 per cent in the session. Spot gold fell 2.2% in 40 minutes. On Wednesday prices took another hit on a newspaper report that high-profile investors, including George Soros’ hedge fund, have sold precious metals. Silver for July delivery closed lower by 7.5%, at $39.39 an ounce on the Comex division of the New York
None of this caught our readers by surprise.
We warned on Friday that silver was vulnerable for a washout on the downside. We wrote: the situation in silver is extremely tense at this time. It seems that we are near an important top, although we may see higher prices for the next several days/weeks before it is reached. Most Traders should not attempt to take advantage of this rally, for it could be difficult to exit quickly if the situation becomes very volatile. Such will be the case if a multi-dollar decline is seen in silver’s price right after the top is formed. Betting on higher silver prices should only capture the interest of the most risk tolerant of Speculators.
Much of the sell-off in silver was attributed to tougher margin requirements for speculative traders. The Comex had raised trading margins on silver contracts for the third time in two weeks. (CME Group Ltd., Comex's owner, said this week that the minimum amount of cash that must be deposited when borrowing from brokers to trade silver futures will rise to $16,200 per contract at the close of business yesterday, from $14,513. A year ago, the margin was $4,250.) There was also news that one of the biggest silver bulls in the world, Eric Sprott of Sprott Asset Management, had started selling 35 million shares of PSLV, a Sprott-owned silver ETF, but he later said that money raised from the sale will be reinvested into either silver or silver equities.
Traders were also spooked by a Wall Street Journal report that George Soros’s hedge fund and some other investors have sold much of their gold and silver because there’s less chance of deflation. It would not surprise us if Soros were to take his profits and build positions back up relatively soon at the right entry point. Remember that it was Soros who was quotes saying that gold was the “ultimate bubble,” even as his hedge-fund firm was building big positions in the precious metal.
John Paulson, another heavy-weight hedge-fund manager, said on Tuesday that gold could climb as high as $4,000 an ounce over the next three to five years. Paulson said he still has most of his personal wealth in gold-denominated funds run by Paulson & Co., his hedge fund.
In any case, silver is well known for its volatility was overdue for some profit taking. Last week we wrote about the Hunt brothers of Texas who tried to corner the market in silver in the 1970s. Back then, after futures rallied to a record $50.35 an ounce in January 1980, prices dropped 78 percent in four months. In the spring of 2006, silver took a parabolic run to hit the price of $15 in May. Six weeks later the price had fallen by more than 35%, to trade around $9.50. In March 2008, silver made it almost to $22. Eight months later it was below $9.
Overall, silver has gained more than 145 per cent in the past year, and 19 per cent in April alone. Unlike gold, which is bought and held by large investors, funds and central banks, silver is dominated by individual investors who can better afford to invest in it.
The gold/silver ratio has clearly departed from its historical average. Even at its current, post-slip 40 times, it is a long way from the average of 62 over the decade ending in 2010. Silver's rally also started after the rally in gold, suggesting that investors locked in prior gold gains and then pushed into silver's smaller market.
If there is anybody happy in the world about the declines in precious metals it must be Warren Buffett who keeps on buffeting gold at every opportunity. Here is what he said at the recent Berkshire Hathaway’ annual general meeting. You can fondle it, you can polish it, you can stare at it. But it isn’t going to do anything. Gold really doesn’t have utility. I’d bet on a good producing business to outperform something that doesn’t do anything.
A very well-known phrase of Buffet’s about gold which we have quoted previously, is that gold gets dug out of the ground, then we melt it down, dig another hole, bury it again and pay people to stand around guarding it. It has no utility. Anyone watching from Mars would be scratching their head.
Of course Buffet said this when gold was trading for a fraction of its current cost. He must be scratching his head and asking himself why he didn’t buy it when it was less than $300. We guess that we will start worrying the day Buffet says he’s buying gold. That could be the ultimate signal that it’s time to sell as it seems that absolutely everyone is already in the market if even the most die-hard gold bears are buying.
We said we wouldn’t say anything about Osama Bin Laden, but there is one thing we did want to mention. According to the final report of the 9/11 commission Al-Quaida pulled off their reprehensible September 11 attacks for about $500,000. It is sad to realize that by the end of fiscal 2011, the US government will have spent $1.26 trillion fighting the wars in Afghanistan and Iraq, according to the Center for Defense Information. It was Al-Qaida’s mission to weaken the U.S. Don’t even try to figure out Al-Qaida’s horrific “return on investment.” It will make you sick. (2,514,000:1 return.)
With all the turbulence in precious metals this week, and as we slowly enter the summer which is considered a seasonally weak time for precious metals, let’s turn to the technical portion with analysis of the USD Index. We will start with the long-term chart (charts courtesy by http://stockcharts.com.)
Euro - USD Indices
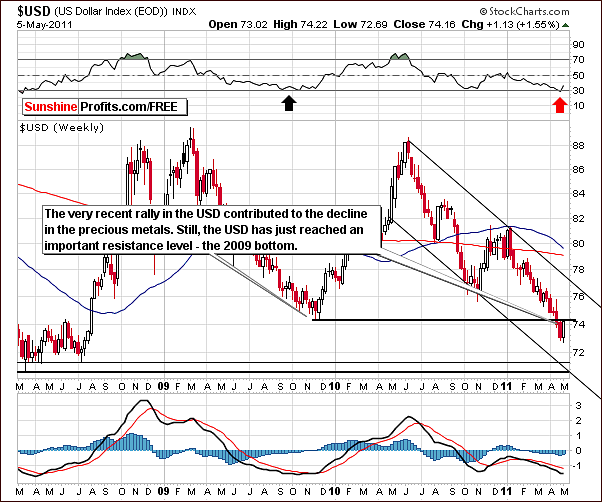
In the long-term USD Index chart, we have seen a small rally this week which in fact contributed to the decline in gold and the other precious metals. At this time however, it appears that this rally could be over, though this is somewhat speculative.
So far it appears to have been just a post-breakdown correction. There simply is no proof of it being more than a verification of the recent breakdown and should not be viewed as a bullish phenomenon – at least not yet.
The decline brought the index below the level of the 2009 lows and this is where the subsequent rally stopped as well. The current RSI level is similar to what was seen in mid-2009 at the time of a local bottom. Back then however, further declines continued after a short bounce and the true bottom was not seen until months later. So far, this year’s recent trends appear to be quite similar to what was seen in mid-2009, and this should be kept in mind as we try to determine what is likely to happen next.
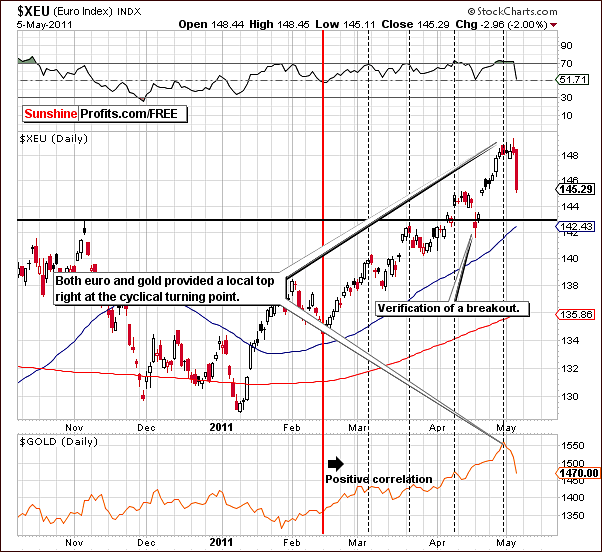
In the short-term Euro Index chart this week, we see trends quite the opposite of the USD Index as is usually the case. Local tops have recently been seen here as well as for gold. The Euro Index topped precisely at its cyclical turning point.
In a situation similar (though opposite) of what we saw for the dollar, no breakdown has been seen here in the Euro Index and we are still well within the rising uptrend. The RSI level is close to where it was at the time of the local bottom which was seen in mid-February and mid-April. Please note that this is area where it meant local bottoms since euro and gold became positively correlated.
Summing up, based on the currency markets’ recent trends, it appears that a short-term bounce is likely to be seen in the Euro Index as well as for gold. At the same time the USD Index is still likely to continue its decline. This will likely have an overall positive short-term impact throughout the precious metal sector. The situation may change if dollar breaks decisively above the 2009 low, but that is not the case right now.
General Stock Market
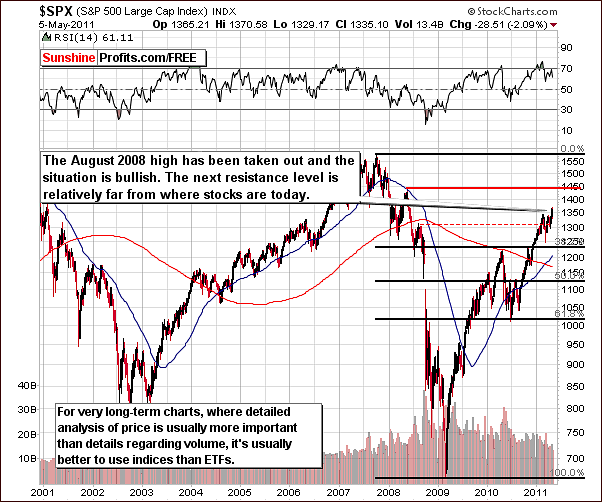
In the very long-term general stock market chart, the outlook is quite similar to what was seen last week. The trend remains bullish as the August 2008 highs have been taken out. Stocks appear to be moving higher and towards much stronger resistance levels as well.
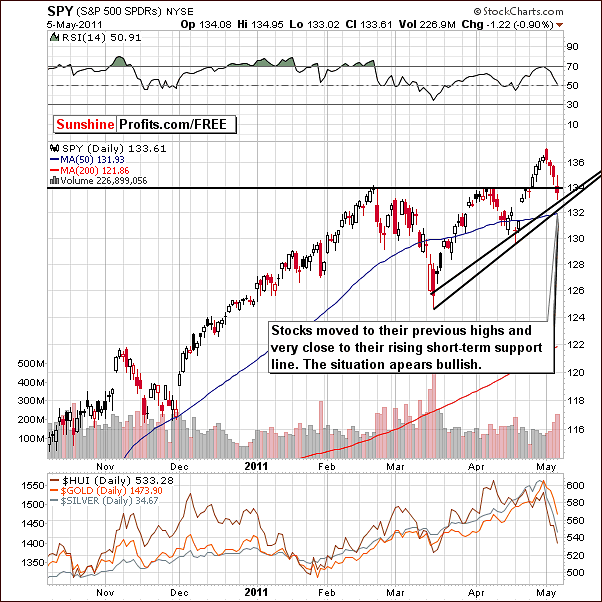
In this week’s short-term chart for the general stock market, we see that stocks have corrected recently. This coincided with the precious metals sector moving lower as well. The S&P 500 are currently at a support level formed by the previous highs of 2011 and they are also close to the short-term rising support line. The trend clearly appears to be up and continuation of a rally from here is likely. This should have a positive impact on gold, silver and gold and silver mining stocks at least in the short-term.
Correlation Matrix
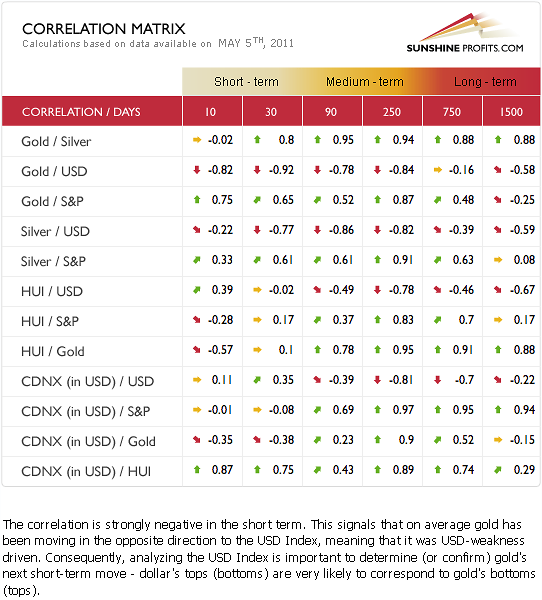
In this week’s Correlation Matrix, we see a numerical confirmation of points made above. Gold and silver have been moving in the opposite direction of the USD Index. The bearish outlook for the dollar (the positive move being nothing more than a verification of a breakdown so far), therefore, has positive implications for these two precious metals. Significant and positive readings in the short-term (30 trading days) column for metals and stocks confirm that a rally in stocks is likely to be a positive factor for gold and silver.
Please keep in mind that the Correlation Matrix is being updated for you on a daily basis, so you can check the values of the coefficients along with our interpretations whenever you want to.
Gold
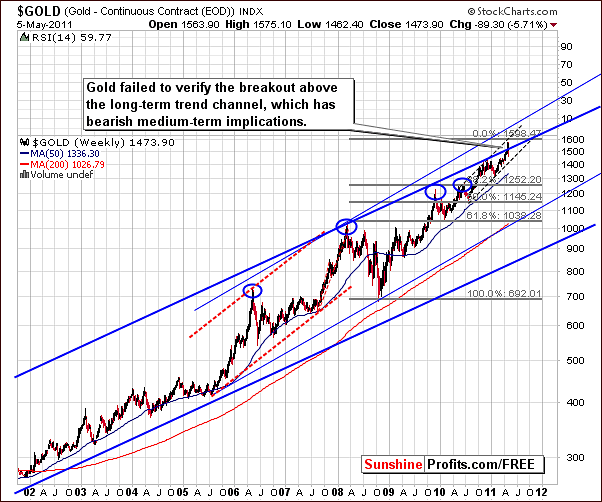
We begin our gold section this week with a look at the very long-term chart. We see that this week gold failed to verify its breakout above the long-term, rising trend channel. The $1,600 level was never reached and if the recent breakdown holds, this could be quite bearish for the medium term.
It is important to note that much uncertainty is present right now as to what will happen next. The possibilities are limited but very different in nature. We could be seeing the beginning of a serious decline or simply a sharp correction within the current uptrend. Let’s turn to some other charts to further examine the signals which are present this week.
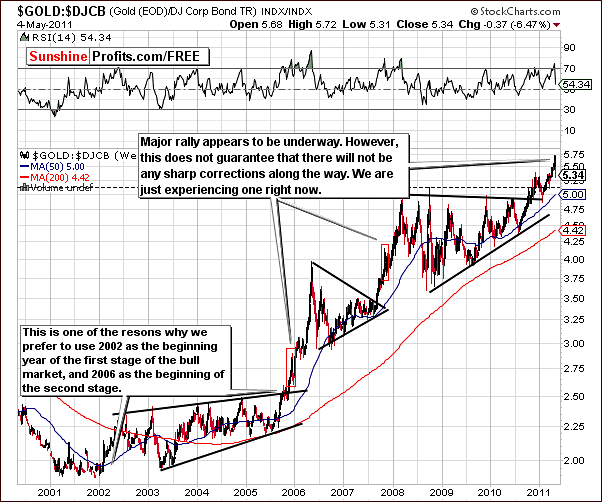
The gold:bonds ratio is another of our often used very long-term charts. In last week’s Premium Update April 29th 2011, we wrote “Keep in mind, however, that even though this rally may continue, a sharp correction is possible along the way.” This week we have certainly seen one of those sharp corrections.
We have been in a bull market for some time now and the recent declines could simply be viewed as minor corrections. On the other hand, they could be the beginning of a bigger decline. This uncertain situation could become much clearer when certain events within one or more markets provide valuable signals. We are always watching for such developments and we’ll let you know accordingly.
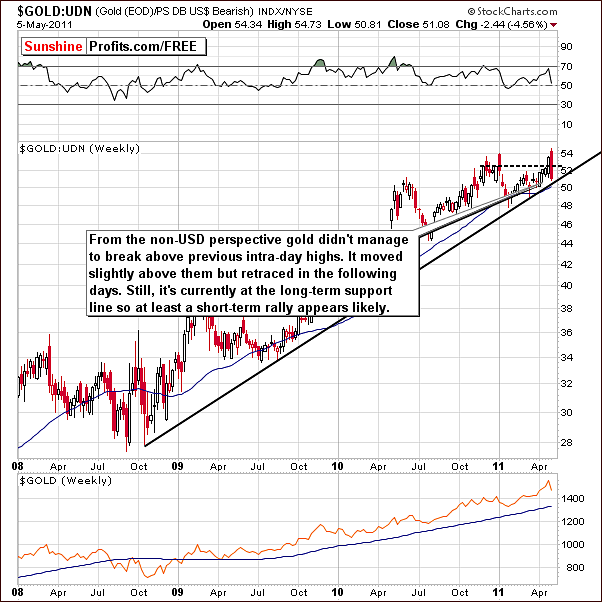
From a non-USD perspective, we can see that gold attempted to move above its previous highs, failed, and then declined. It is now close to a strong support level based upon the bottoms of previous years. This makes a short-term rally from here a pretty good possibility.
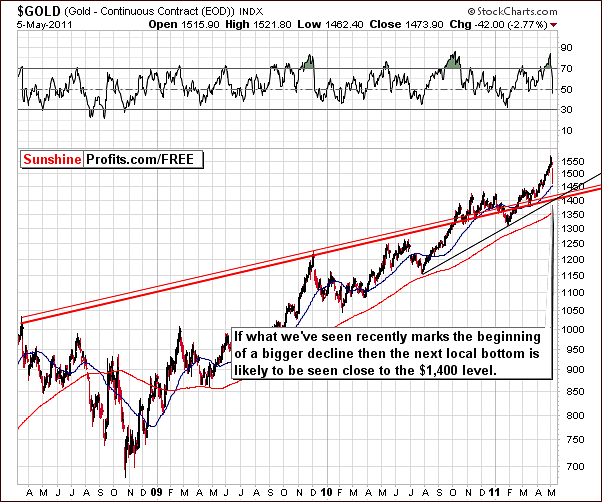
In the long-term chart we can see that gold is now close to its 50-day moving average and this has served as support in the past. Note that in November 2010 gold declined to the 50-day moving average, bounced and then moved slight above the previous high. At this point we should not rule out such a possibility going forward.
Once again we must realize that this week we could have seen the beginning of a very large decline in gold’s price. If that is the case, then we are likely to get a bounce and then another decline. The next support level is close to $1,400 and this could in fact become gold’s next bottom if this decline does indeed continue. The “jury is still out” at this time however.
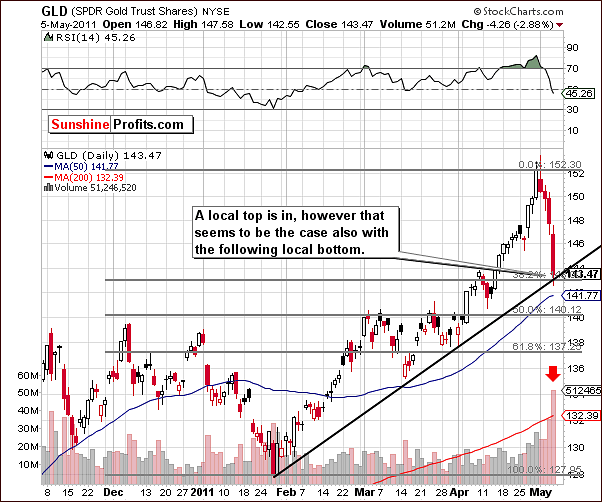
In the short-term GLD ETF chart this week, we see that the rising support line and the Fibonacci retracement level have both been reached. Gold actually moved slightly below these levels but on Thursday closed above the short-term support line and the 38.2% Fibonacci retracement level. This is an indication that a short-term bottom is in.
After a very sharp decline which was accompanied by significant volume. A possible explanation for this is that those who wished to sell have sold and once again the buyers could soon outnumber the sellers. This of course, would cause gold’s price to rise.
Summing up, while it is true that the timing of our previous go long gold was not really in tune with the profitability of the previous calls (still, holding gold was indeed a better choice than holding silver or mining stocks), it now appears that another opportunity to enter profitable transaction has come along. Those inclined to speculate may wish to take advantage of this by going long gold now as we discussed in our Market Alert, May 5, 2011.
Silver
This week’s extraordinary declines in the price of silver are clearly visible even in the very long-term chart (please click on this chart for more details). Being long silver was quite painful this week and certainly was worse than what was felt by those holding gold. Silver does appear at this time to be close to a local bottom though not necessarily its final bottom.
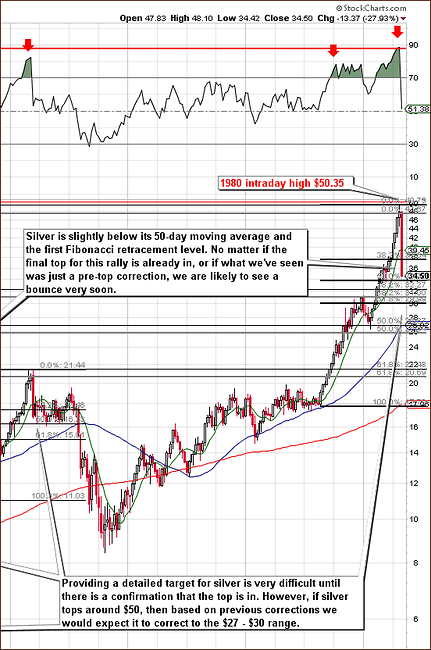
Let’s compare this week’s correction to the once seen in 2006. At that time, silver declined to its first Fibonacci retracement level and below its 50-day moving average. Generally speaking, silver is below the 38.2% retracement level however it might be the case that given the previous volatility to the upside, the move to the downside will be more volatile as well.
Perhaps those who purchased silver at the top in 1980 have recently finally exited the market and contributed to the rapidness of the recent price decline. RSI levels indicate the possibility that we may be at the beginning of a major correction. Once again however, we note the volatility of the white metal and we venture to say that it seems there’s a 40 to 45 percent chance that this rally will actually continue and silver will see new highs.
One final bit of information should be noted from this week’s long-term chart. The 38.2% Fibonacci retracement level previously stopped declines in 2006 and 2008. This at least leaves open the possibility that a short-term bounce from here may be likely. If this is seen, a likely target level would be around $40. Silver’s behavior during such a bounce could provide additional details as to what will likely follow. This short-term bounce is likely to begin soon regardless of whether we are currently seeing a small correction or the beginning of a bigger one.
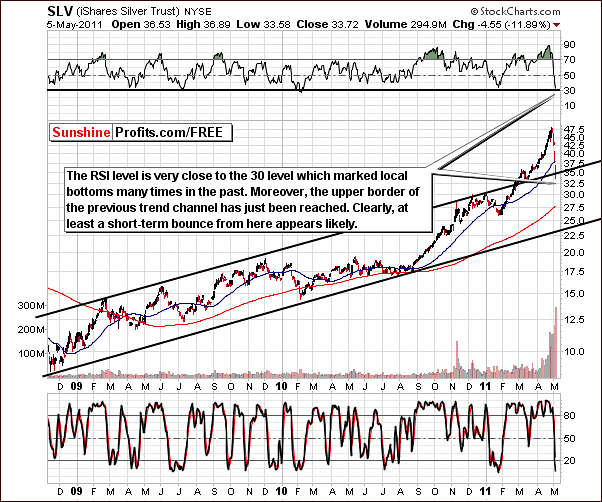
Zooming in for a closer look at silver’s long-term trends, we see a move below an important support line created by the local tops of previous years. The RSI level is equal to that seen in prior local bottoms and it’s likely that a local bottom is very close at hand.
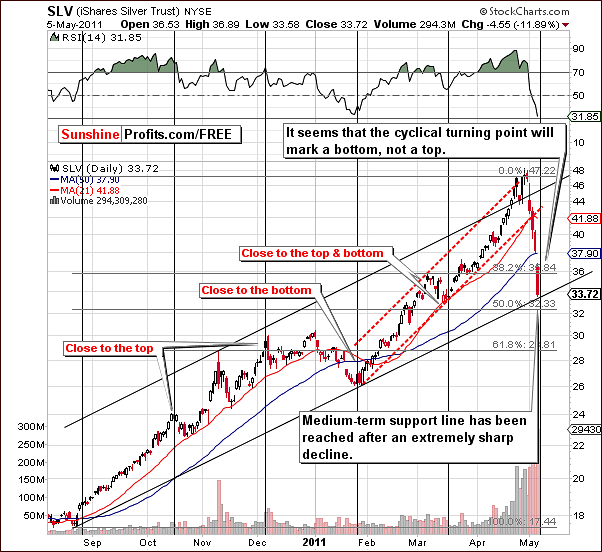
The short-term picture provides additional details. With silver’s price very close to its short-term support line, a short-term bounce is very likely at this time. Furthermore, the white metal is currently right at a cyclical turning point which at the current market juncture appears to be a local bottom.
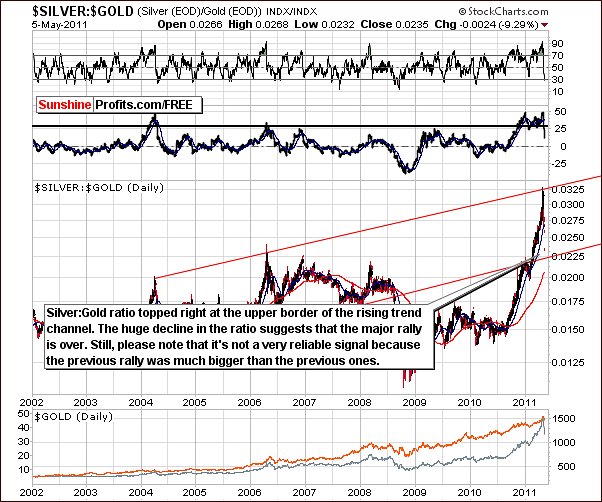
On the above chart this week, we see that the silver:gold ratio has topped out at the upper border of the rising trend channel. The decline and its size suggest that we have just seen a major top. The size of silver’s recent rally however has been unprecedented and therefore comparing this to previous rallies is not all that meaningful. The final top may not yet be in and with a bounce likely, the question remains whether the major top has truly been seen. Still, this particular chart confirms this theory.
Summing up, what we have seen recently was probably (slightly more probable than not) a major top for the previous rally. However, regardless of this being true or not, a short-term rally from here appears likely with the target at $40. Naturally, if the final top is not yet in, then the rally will take silver much higher.
Gold and Silver Mining Stocks
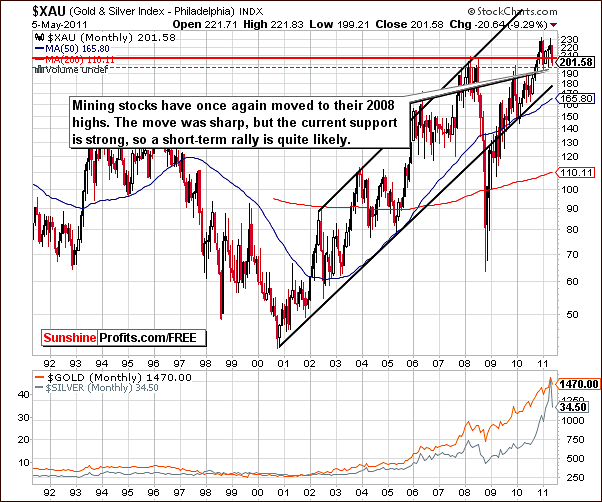
In the XAU Index chart this week, we see that gold and silver mining stocks have once again moved to their 2008 highs. This factor alone should be you consider betting on higher mining stock prices in the short-term. More details are visible on the HUI Index chart.
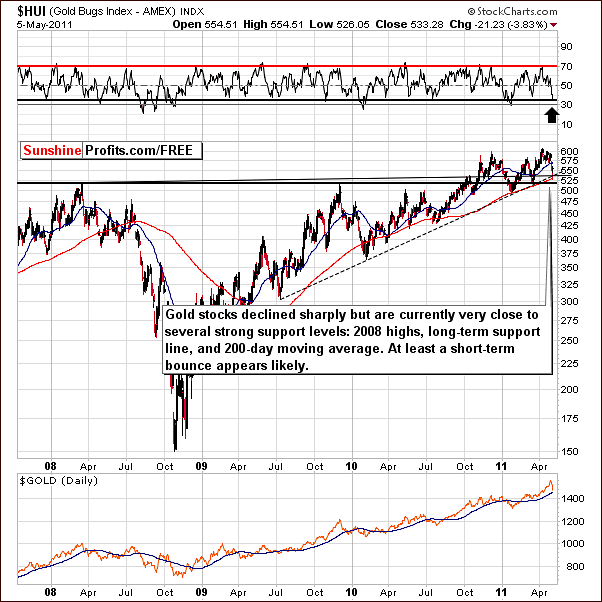
On the above chart we see additional important buy signals than the fact that 2008 highs have been touched. The index has moved to the long-term rising support line (marked dashed line) and the RSI indicator (at the top of the chart) has declined to a point which has marked previous local bottoms. Consequently, an upturn from here appears quite probable.
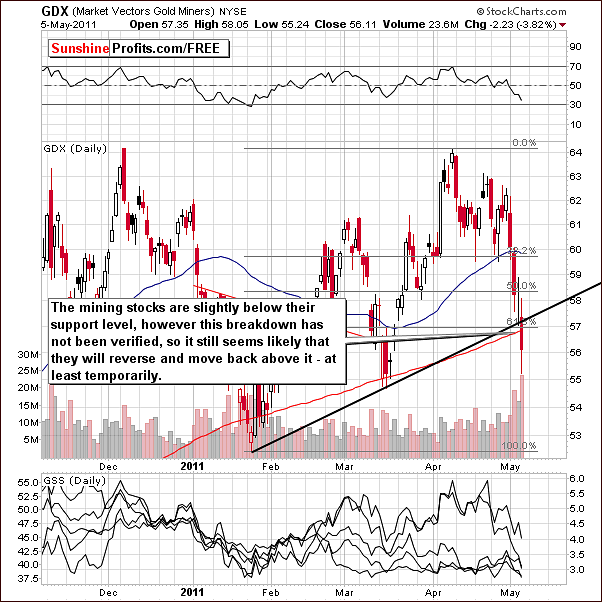
In this week’s GDX ETF chart, we see that gold mining stocks have moved slightly below their short-term support levels but the price closed there for only one day. The breakdown therefore has not been verified. Taking into account the rapidness of the decline and the support level, it appears that a short-term bounce is quite likely here as well. Therefore, we expect the breakdown to be invalidated.
Summing up, the gold and silver mining stocks’ charts suggest a short-term bounce from here similar to what is likely for gold and silver. The way this bounce plays out could provide many of the missing details which might impact the precious metal sector on the whole and determine if we are still in the final part of the rally or has a major decline already begun.
Sunshine Profits Indicators
Two of our indicators have just flashed a signal. Please take a look below for more details.
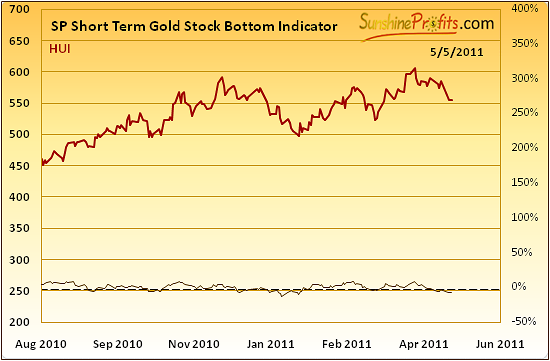
The first indicator is the Short Term Gold Stock Bottom Indicator. Because it is a short-term indicator, it is less important and has a lower reliability than the one which follows. Still, we include it because it does suggest that a short-term rally is likely for the mining stocks and thus for gold and silver as well.
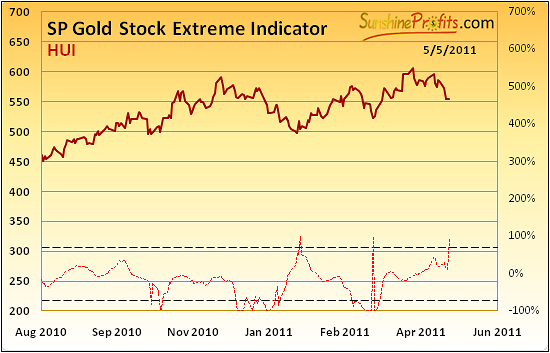
The second indicator provides extreme readings, however recently it has been providing accurate buy signals. We described its performance in the March 18th 2011 Premium Update (just after it flashed the previous buy signal)
In the Gold Stock Extreme Indicator, we see a quick move above the dotted line. This has coincided with local bottoms for gold stocks every time this line was crossed since 2008. As we can see, not each and every bottom was indicated, but when we have actually seen SP Gold Stock Extreme Indicator flashing a buy signal, each time a short-term rally followed. This happened on most occasions prior to 2008 but every time since. 100% accuracy simply cannot be ignored.
This signal greatly increases the odds that the local bottom is in and that a short-term rally is likely.
Juniors
In general terms, the situation in the juniors sector didn’t change from last month, so we will quote our previous comments and make adjustments when necessary.
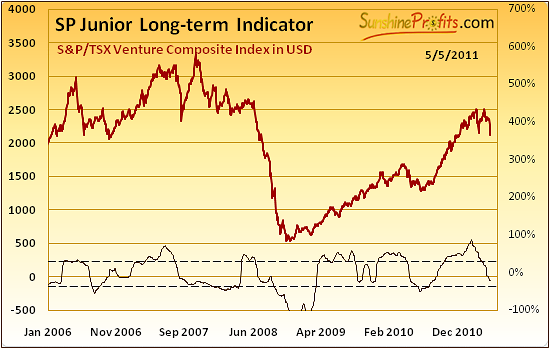
Value of our junior indicator has been moving below the upper horizontal line. The SP Junior Long-term Indicator has been favoring keeping one’s capital in big senior stocks instead of juniors since a few months.
As a reminder the buy signal for juniors is given, when indicator is below lower dashed line and starts to rise (the indicator has been falling for 3 consecutive days and rises on the following day) and the sell signal for juniors (meaning switching to senior mining stocks) is given, when indicator is above higher dashed line and starts to fall (the indicator has been rising for 3 consecutive days and falls on the following day).
We wrote the following in the March 15th, 2011 Market Alert:
In short, we believe that this is a good moment to switch from junior mining stocks to bigger, senior mining companies. Aggressive Traders/Investors may want to cash out of juniors, but this is not what we suggest at this point, as we believe that long-term (!) capital should remain invested in the precious metals market.
What changed? The situation on the general stock market is much more bearish than just a few days ago. Stocks had been overbought for a long time and the correction had to take place sooner or later. Still, the buying power had been strong until recently, when financial stocks started their own decline. The situation has become much worse - technically - and the recent tragedy in Japan served as a catalyst for decline's acceleration.
As we have mentioned many times in the past, the general stock market is more correlated with the junior sector than it is with big senior gold and silver producers. This is why the proper response to the current situation on the general stock market is moving at least a part of your capital that is currently invested in juniors, to seniors. This way, the current decline in stocks will likely affect your portfolio in a less meaningful way.
Naturally, you may verify the above yourself by going to the Tools section on our website, selecting Correlation Matrix, and putting your mouse cursor over the CDNX / S&P (stocks and juniors) and HUI / S&P (stocks and seniors) rows.
Let’s take a look how juniors performed relative to seniors.
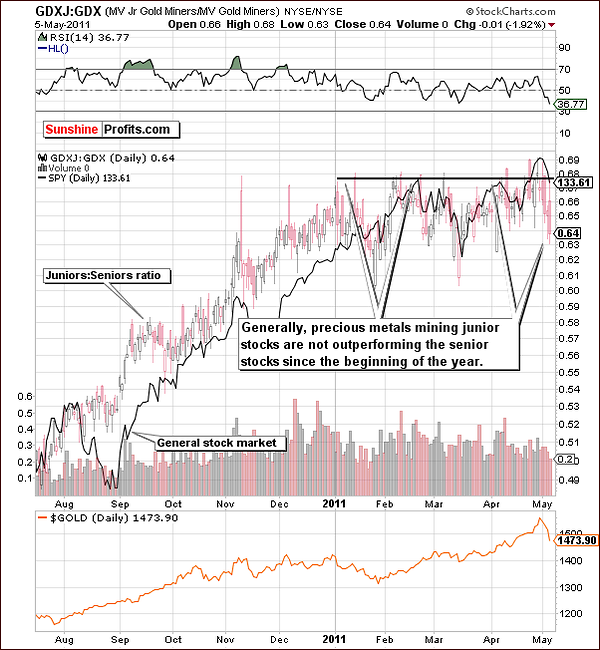
Actually, they did not do much since we’ve seen the signal from our indicator, so it seems that moving from juniors to seniors was not a bad idea, as the risk associated with juniors is much bigger.
Once we get a green light from the stock market (the latter rallies) and we see a breakout in the junior:senior ratio (which was not the case so far), then it might be a good idea to get back into the junior sector with most of one’s long-term capital. For now, the senior stocks are still preferred.
Nonetheless, let's take a look at this month's junior lists.
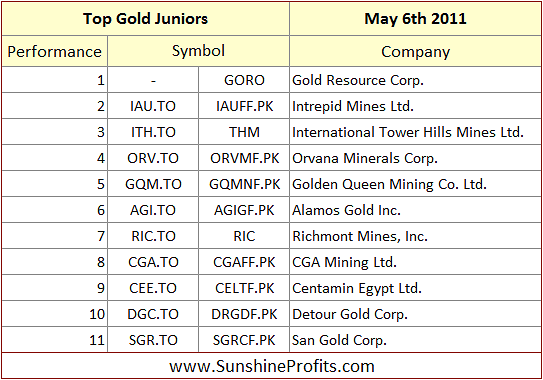
CGC.TO has been acquired by Gammon Gold, which marks the end of this particular company. We originally suggested including it in your portfolio in the December 10th, 2010 Premium Update, when it was trading at 4.99, and the final price quoted for CGC.TO was 6.27. There are also two new companies in our gold junior list: Detour Gold Corp. and San Gold Corp.. Still, at this point we prefer senior stocks, so in case of most portfolios there's no need to make adjustments now. It seems that you could rebalance your portfolio once investing in juniors becomes preferable.
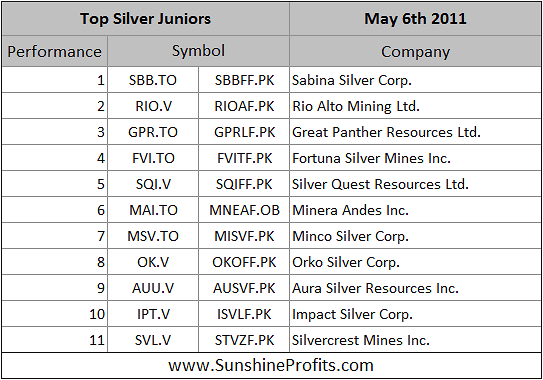
In case of silver stocks we simply decided to remove several stocks from our top list (BCM.V, ORM.V), as their performance was far from outstanding. Again, we prefer seniors stocks at this time to juniors.
Letters from Subscribers
It seems that the Sentiment Analysis from April 29th Premium Update was widely read and we have received some questions about it. Here’s a letter from one of our Subscribers:
I would again convey my appreciation for your careful and comprehensive analyses. Your inclusion of a sentiment index seems most timely. It does suggest several questions. One is simply whether, as it seemed on first reading, your sentiment indicator is a proprietary one, as opposed to, say, a daily put-call ratio. A second question is whether one might expect optimism to rise to a short-term top just before we make a significant top. Thirdly, taking into consideration the decline in the commercial short position in last week's commitment of traders report, would one expect the commercial short interest to peak at about the same time that gold peaks?
(On a separate note, I have noticed that many analysts seemed to have stressed the fact that the precious metals stocks have significantly lagged the metals, and they are calling for a top. Given the parabolic move in silver and the non-confirmation (to date) of most of the stocks, that would be good reason to expect an imminent top. But given that most of those analysts have poor track records, I wonder.
Yes, our sentiment indicator is a proprietary one - it's not a transformation of a put-call ratio, however we might add this ratio as a factor in the future. Consequently, we don't want to reveal how it's constructed since it will no longer work if many people become aware of the mechanism (and we definitely want it to work to the benefit of our Subscribers). As far as short-term optimism is concerned, right before the top - yes, it would increase right before the top, but our Sentiment indicator was not designed to detect such an immediate-term move. One of the future variations of this tool will most likely focus on this particular phenomenon. For now, it might be a good idea to watch laggards (lagging mining stocks) - if they suddenly outperform the benchmark, then perhaps the top is at hand, as purchases of these stocks were most likely not based on logic (if they were so good, why did they lag for most of the time?) but emotions.
As far as short positions are concerned, then yes, the short interest is likely to peak along with metals prices, however please note that the data for these calculations (CoT reports) is provided with a delay, so it's usefulness in executing short-term trades is limited. It was much more useful before 2006. Prior to this year, the bull market was visible mostly only from the USD perspective, so other (non-US) exchanges were not that relevant as far as precious metals’ trading was concerned. 2006 was the year when gold broke out in terms of euro and many other currencies. Moreover since 2006 we’ve seen acceleration in gold’s uptrend and thus we believe that 2006 could be referred to as the beginning year of the second stage of the current bull market in precious metals.
Now let's move to mining stocks. Here is an interesting the letter we received.
Like the silver miners before them, the gold miners are now moving inversely to the price of gold. The Hui is down today minus 10.60 at 581.90, the XAU is at 218.61, down -3.61 - so you are losing money if you are holding gold or silver stocks. Some of the important stocks, SLW for example, is DOWN 21% in the last 2 weeks - GPL DOWN 25%, AG DOWN 24%
The golds are trickier as there's a wider spectrum to choose from but only the odd one or two have avoided a hammering. But the junior golds are suffering losses not far removed from the silver stocks. This is reflected in the performance of the HUI down from 608 on April 8th to 582 this afternoon.
I think there is therefore a question mark over your remark "this level in gold will be accompanied by a double top in silver (most likely close to $50 level) and a false breakout (move above previous highs) in mining stocks.
Mining stocks are now deeply oversold from the short-term perspective and on they refused to move lower on Wednesday even though metals were declining. Based on that factor alone it seems that a short-term bottom is in.
The coming bounce may or may not take mining stocks to new highs. That appeared likely just a week ago, however right now miners are much below their previous highs and the probability of a bounce is lower. The point is that these are not normal times for the Precious Metals Investors. With this kind of volatility we could see just as a dramatic move to the upside as we've seen to the downside.
Once we get a bounce we will be able to examine it and most likely infer if it's likely to be just a counter-trend move and that the major decline is under way, or if the decline that we have seen so far is a pre-top correction.
We would like to close this section with a question related to last week’s Sentiment Analysis.
Can you recommend one or two books on Behavioral Finance and investors's sentiment? Since there are many such books, I may only have time to glance at one book, which book is the one book you would recommend?
If we have to choose one book it would be "An Introduction to Behavioral Economics" by Nick Wilkinson – a book that will give you all information you need from the very beginning to sophisticated methods. However, there are many titles worth mentioning including : "Behavioral Economics and Its Applications" by Peter Diamond and "Advances in Behavioral Economics" by Colin F. Camerer.
On a side note, this is one of the parts of finance that we personally find the most interesting – for example did you know that people are generally risk-averse about gains but risk-loving about losses? Would you rather enter a 50/50 bet for winning 0% (not winning anything) or 10% or would you accept 4.99% right away? Most people will accept 4.99% even though it is a little smaller than the average of the two gains. The second part is really interesting – would you rather enter a 50/50 bet for losing 10% or losing 0% (not losing anything) or would you accept a 4.99% loss? Most people will prefer the bet in this case. If you answered like most people, please take a few moments to examine why – after all, you theoretically “should” be either risk-averse or not, right? Why would that depend on the fact if you’re winning or losing?.., Understanding this mechanism could help you in all your trading activities. Please feel free to send us your comments – we’ll be happy to comment on that further in the coming update if you find that topic interesting.
Summary
The USD Index has rallied recently but it has not moved above the level of 2009 lows. The trend for the dollar, therefore, remains down. The opposite is true for the Euro Index. Recent declines need not be regarded as significant and the trend for the euro remains up. Together these two points are positive for the short term with regards to the precious metals sector.
The general stock market declined recently but only to the level of previous 2011 highs. It appears that this was simply part of the verification of the recent breakout above the August 2008 highs. The trend remains up for stocks.
Gold, silver and gold and silver mining stocks should be impacted in a positive manner by the above points and also from the support levels currently being reached. A short-term turnaround for the sector is likely. Additional factors which support this outlook are the cyclical turning point of silver and the buy signals given by the Sunshine Profits Indicators. The precision of the SP Gold Stock Extreme Indicator should not be ignored.
Consequently, our yesterday’s speculative buy signal for gold appears justified from the risk/reward perspective.
Our next Premium Update is scheduled for Friday, May 13, 2011.
This completes this week's Premium Update.
Thank you for using the Premium Service. Have a great weekend and profitable week!
Sincerely,
Przemyslaw Radomski

