
Markets are skittish and the pace and force of financial crises has taken a frightening turn for the worse. It seems like the fuse gets shorter between each crisis. We barely catch our breath from one when confronted with the next. Looking back three decades a crisis had taken place, on average, every three years. But now, a scant 18 months after the 2008 meltdown, Europe's Greek sovereign debt crisis hit with full, fulminating force. One crisis begets another and it seems like the world's economy is on a treacherous bumper-to- bumper course where any misstatement from politicians can cause a multiple car pile up. Still, the fact worth keeping in mind is that the main stock indices lead, not follow the main economic indicators, such as the GDP growth.
Therefore, when one reads something about the unemployment, GDP, import/export dynamics etc., in the vast majority of cases this information is something that is already factored into prices. Let's just say that the realistic assumption here is that the institutional investors / specialists have better access to information / research teams. At the same time they usually control large amounts of capital and their investment decisions can influence the value of the stock indices. So, if these investors' research suggests that the economic statistics are going to be grim in the future, they are likely to sell stocks right away, before everyone else gets the same information - without waiting for the official numbers to be released. Consequently, prices of stocks are to lead economic statistics.
Naturally, a move in either direction might accelerate after a particular piece of news is released, but the overall trend will most likely be in place much before that.
Moving back to gold - more and more often we hear talk of investors searching for "Safe Haven," as if it's a quest for a Holy Grail.
Take a look at these recent headlines:
· "Bullion Sales Hit Record in Stampede to Safety." (Financial Times)
· "Gold is Safe Haven for Looming Crash." (Seeking Alpha)
· "Gold Ticks Higher On Safe Haven Buying." (AP)
· "Gold Rush: This is a new round of safe haven buying." (Bloomberg)
Safe haven is defined as a currency, stock or commodity favored by investors in times of crisis because of its stability and/or easy liquidation. Gold is a universally recognized currency carrying no counterpart risk, easily portable and unlike fiat currencies, it is nobody else's liability. Early civilizations equated gold with gods and kings, and gold was sought in their name and dedicated to their glorification. Humans almost intuitively place a high value on gold, equating it with power, beauty, and the cultural elite. And since gold is widely distributed all over the globe, we find this same thinking about gold prevalent throughout ancient and modern civilizations.
Sometimes safe haven is mentioned in connection to gold, other times U.S. treasuries and the Japanese Yen. Last month when financial markets plunged in "flash crash" mode, there was talk of capital flight from countries like Germany and Britain to perceived safe havens like Switzerland. Across the globe, investors fled from risky currencies, bonds and stocks to gold, the dollar, the Japanese yen and U.S. bonds.
In mid-May with intense pressure on the euro, we witnessed panicking German dealers and banks desperate to get their hands on Krugerrands, the world's most popular gold coin. At the Rand refinery in South Africa, the phone did not stop ringing all that week and people were buying gold coins like crazy. The Austrian Mint, which produces the popular Philharmonic gold coin, sold more gold in the two weeks from April 26 than in the entire first quarter of the year because of soaring European demand.
However, during the third week in May, when the markets suffered a difficult week with the S&P 500 losing 4.2%, it was a different gold story. Negative sentiment grew after Germany enacted a short-selling ban on German financials, euro-zone bonds and certain credit-default swaps, and instead of gold going up on face of the bad news, the price of gold fell $51.70-- the worst weekly dollar drop since the week ending Feb. 27, 2009.
Gold has a solid reputation as a safe haven when markets are gripped by fear and as an inflation hedge. Is the reputation justified?
It is useful to look back several decades to see gold's performance during some of the major crises that gripped the world.
When the news of the Bear Stearns collapse became public in the last week of June 2008 there was a flight to quality as investors became more risk averse. When in July 24th news came out that the subprime fiasco had extended to Australia, there was mass flight into Treasuries and gold fell almost $30 under liquidation and technically induces sales. It was after the interest rate cut by the Federal Reserve that investors returned to gold and it emerged as the strongest asset class, other than oil, in all the major currencies. At the end of September the U.S. Mint was forced to suspend sales of the American Buffalo 24-carat gold coins because it had run out of inventory. Only a month earlier, the Mint had also temporarily suspended sales of the American Eagle one-ounce gold coins, and had later made them available again through an allocation program to specific dealers.
If we go further back to the 9/11 terrorist attack crisis, in the immediate aftermath gold prices fell under panic selling, dropping from $287 to $279. Then came the flight into safety and gold shot up from $279 on September 12, to $293 on September 17th, a five percent increase.
The Dot.Com bubble burst on March 10th, 2000. The NASDAQ dropped 34 per cent from that date until April 14th. The S&P and gold fell 3 percent during this time. The biggest beneficiary of a flight to safety was the bond market, mostly due to a strong dollar. Another reason for gold's feeble performance was the British gold sales during this period initiated by Gordon ("Golden") Brown, who sold on the open market 60 per cent of Britain's gold reserves.
Gold's performance was relatively bullish during the Russian ruble crises of 1998 and the collapse of hedge fund LTCM, although gold did not do as well as the bond market.
Gold found itself under pressure during the Asian currency crisis of 1997-98. However, if we need proof of gold's safe haven status, there is the fact that the South Korean government bought gold from its population, sold it on the international market and raised hard cash to pay its debt service obligations.
In the short term, gold can move any way, because the enormous amount of speculative capital out there (that's one of the reasons we pay a great deal of attention to the charts.) It is not at all uncommon for gold prices to have a delayed reaction to a crisis. For instance - in the 2008 credit meltdown, gold at first plunged along with main stock indices as hedge funds were forced to liquidate their gold positions to offset losses in other markets. The most extreme example was the fall in gold prices following the Asian currency crisis, but also evident to a lesser extend during the credit and 9/11 crises. Going back further, the same phenomenon took place in the 1987 stock market crash.
There are two reasons why gold has retreated on each of these occasions. The first, gold, as a part of some commodity indices, is automatically subject to liquidation along with the others. The second, gold is sold in order to raise cash or meet margin calls from other sectors. Once nervous investors and distress sellers had been flushed out of the market, sentiment towards gold returned in most of the major crises as well as its status as a safe haven. Still, as mentioned in the previous Premium Update, this might not be the case in the near future, as investors would realize that any declines in gold caused by plunge on the general stock market is only temporary. So far gold's performance confirms this theory.
The bottom line is that gold has been valued throughout history and fiat currencies have always failed sooner or later. So, gold may not always move in the direction that one would expect it to move, but it is reasonable to expect gold to retain its purchasing power over the long run, while the fiat currencies do not.
Throughout history and in all civilizations gold has been valued and cherished. It has offered security in times of political or economic crisis. In extreme situations a few gold coins hidden in a coat lining could mean the difference between life and death. Gold is almost indestructible and does not corrode or rust. The amount available changes slowly and the quantity of newly-mined gold added each year is a small proportion of the existing inventory.
Gold has been a "reserve currency" and a safe haven for thousands of years, and those who understand history know that it will always remain one.
To see what history will say about the gold price this week let's begin this week's technical part with the analysis of the U.S. Dollar. Let's start with the long-term USD Index chart (charts courtesy by http://stockcharts.com.)
USD Index
Before we start on this week's update, I would like to quote several points made in our June 4th Market Alert, as they are important also today:
The USD Index was recently trading within a rising wedge pattern (trading sideways in a narrowing trading range, but moving up on average) and it took place on declining volume. In most cases these patterns are followed by a sharp downswing. However this was not the case today - it moved up. This breakout from the rising wedge pattern has not been confirmed yet, but it's still bullish because it has already broken above the rising resistance line (marked on the USD charts in the latest Premium Update.)
So, if USD is to rise, and gold has recently used to rise along with it, we might see gold higher in the next several days. During the previous part of the USD rally (beginning in mid-April) we've seen a sizable decline in the main stock indices. While the general stock market didn't break down today, there is a significant risk that this would take place again. It doesn't have to happen to the same extent, as we don't expect USD to rally by the same amount (in fact the next strong resistance is slightly below the 90 level), but it could negatively influence the prices of mining stocks and silver.
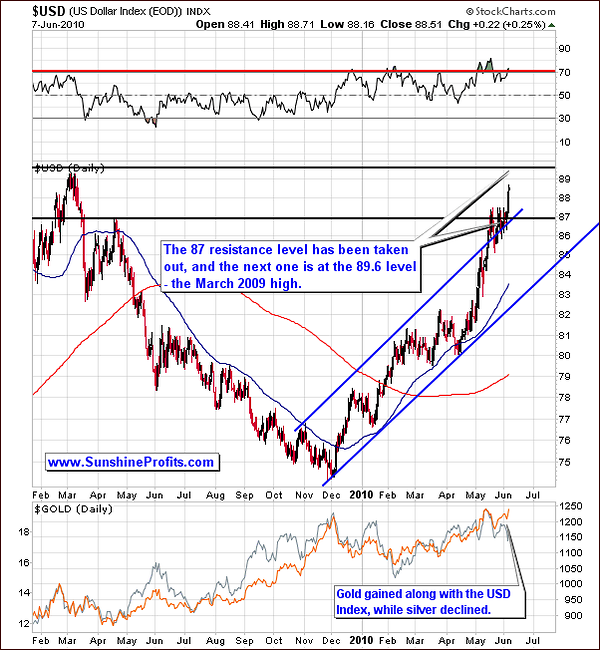
What we've seen in recent days is the USD breaking the strong resistance level of 87. This was preceded by a few weeks of sideways movement, before breaking above this strong resistance level. This is significant. Some consolidation was seen below the initial top, which - at that point - could have been considered a double-top. The very recent price action finally provided us with a confirmation. Still, the consolidation before this move caused the full breakout to be more significant. This breakout does not appear to be an accident, even though the price of the index did not close above the resistance level for three consecutive trading days. The USD index has been closely watched throughout the world during the consolidation, and it still moved above this strong resistance level.
The RSI is above 70, which is a common occurrence after a consolidation period. Therefore, further price increases are probable and we expect the USD to approach the next resistance level of around 89.6 which was the level of the March top. Perhaps we will see the USD top out there or consolidate once again. We will know more when we get closer to this level, and we know the way in which this level is approached.
Gold's reaction has truly been amazing as we saw a slight decrease followed by increasing values. We expect gold to continue its upward movement over the next few days or even a week or more. Perhaps the reaction of each precious metal will mirror that of gold, but - even if that is the case - to a much smaller extent. Non-USD investors are buying gold and their domestic currencies are declining in value. With gold and the USD rising, this will cause further increases in gold's price. Furthermore, gold will rise more significantly in currencies other than the U.S. Dollar if the USD continues its upward climb along with gold priced in it.
We expect the USD to rise above 89, which is likely to translate into higher gold prices, but it may not be as bullish for silver and mining stocks - we will discuss this in more detail later in this update. This is why we recently suggested switching from mining stocks and silver to gold.
We also indicated that the non-USD Investors might want to go long gold. The increase in the value of the USD Index means that on average the value of other currencies relative to USD will decline. Furthermore, the value of all goods priced in USD will rise from the non-USD perspective (the value of a car priced in the USD will increase if you're holding euros, because you will need more euros to buy the same amount of USD to finance the purchase.) Therefore, if gold rises in USD and all goods' prices rise from a non-USD perspective, the gold price in non-USD currencies will benefit from both a rising USD index and a rising gold price in USD. All these factors contribute to the likelihood of gold rising even further.
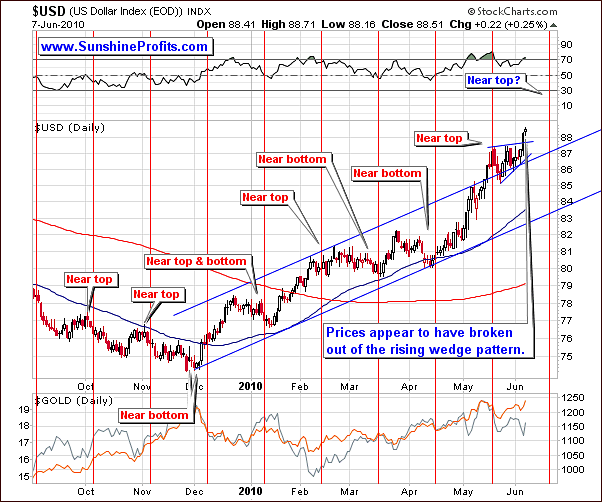
In this week's short-term chart, we clearly see a breakout from the rising wedge pattern. We see the breakout and one day of closing prices above that level. Conservatively, we need to see three consecutive closes prior to declaring a breakout of a pattern. However, this time, the pattern itself appears to be a form of confirmation of a previous breakout.
What was unclear previously is quite clear now. Our previous lack of clarity between the double top formation or consolidation period left us searching for a decisive move in either direction to confirm the breakout/decline. It has been confirmed by a move higher, and this trend is likely to continue for the next several days or so. Perhaps we have not had a full confirmation at this time, for we have seen two closes (rather than three) above the rising wedge pattern. We feel it is unlikely that we will see prices plunge from here. The cyclical pattern in the USD index leads us to expect to see the 89.6 resistance level attained in mid-June or slightly later.
Summing up, the USD recent price action suggests further upward movement. The implication for precious metal traders is that gold is likely to increase in the near term. However, the implications are much less clear for silver and mining stocks.
Euro Index
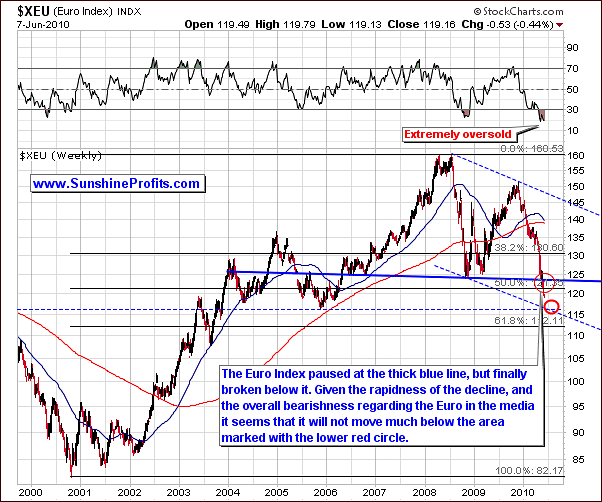
In the Premium Update published on May 21st, we identified two strong support levels that the euro was approaching (marked with red circles on the above chart.). Since that time we have seen the euro move lower after having paused briefly. Right now, the euro is declining towards the lower support area at the level corresponding to its 2005 low as well as its mid-2003 high. Additionally, the lower border of the multi-year trading channel is marked by the declining dotted line on the above chart.
These two border levels cross right at the area marked with the red circle. Also significant is the level of the Fibonacci 61.8% retracement level obtained from the euro's 2000-2008 rally. The euro is not likely to fall much further from here. We have illustrated its probable bottom with the red circle, and we believe that there is about 90% probability that the euro would not move below the Fibonacci 61.8% level.
Summing up, it appears gold is driven by the downward movement in the Euro Index. As the euro declines, gold's price increases, because - as mentioned earlier in this update - we see significant demand from European Investors.
General Stock Market
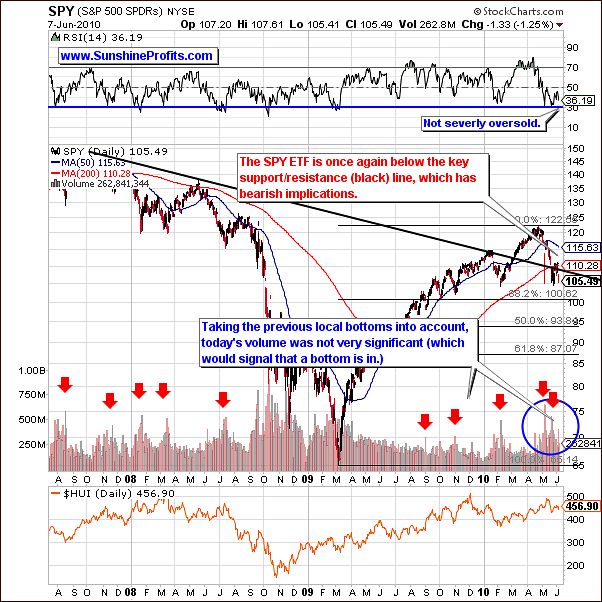
As for the general stock market, this week's move was somewhat unlikely, given that prices had closed above the declining resistance support level. We saw the general stock market move below this level and bounce off the 200-day moving average. This was done on visible volume levels. This is a bearish sign.
At this time, the RSI is not in severely oversold territory. Perhaps further weakness will be seen. The implication for gold and silver Traders is that the main stock indices could drive silver and mining stocks lower. Gold is not as affected by the general stock market weakness as one might expect. We will cover this topic more deeply in the Correlations section.
The Fibonacci 38.2% retracement level falls slightly above the 100 SPY level. This is approximately at the level seen in the October 2009 low and a local top two months prior. Also, we must keep in mind the psychological importance of a SPY level of 100, which could easily become a newsworthy topic.
At this point, a move to this level appears slightly more likely than a sharp rebound. If the decline to this particular level does occur, we will learn much from the way that it is approached. That is to say, if we see a small rise on low volume, more declines will be likely. Conversely, any movement on high volume will point towards a continuation in the same direction.
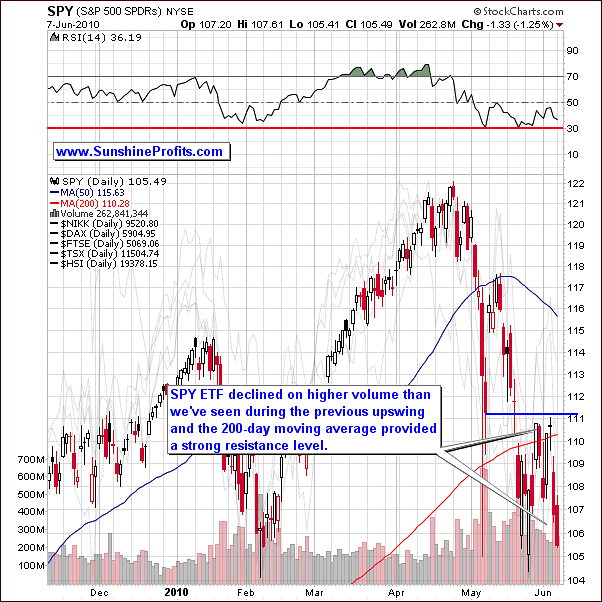
On the short-term chart this week, we can easily see the volume levels. It is quite obvious that volume levels were higher for declines than seen on upswings. This is clearly a bearish indicator.
Prices did not go below the 200-day moving average. Also, we saw prices remain below the early-May decline levels. There was a bounce off the resistance level and then a further decline. This is not a bullish indicator. This risk to go lower is quite high at this time.
Additional factor worth keeping in mind here is that U.S. Dollar's strength could also mean lower values of the main stock indices. In the latest Market Alert we wrote the following:
During the previous part of the USD rally (beginning in mid-April) we've seen a sizable decline in the main stock indices. While the general stock market didn't break down today, there is a significant risk that this would take place again.
The logic behind this phenomenon is that when the value of the USD increases then the goods produced in the U.S. are becoming too expensive for foreign buyers and therefore sales of the U.S. companies decrease. Consequently, their share prices decline as well.
Summing up, the situation on the general stock market is now slightly bearish, and effects on the precious metals sector mainly impact silver and mining stocks. Gold is not affected to any great extent as its correlation with the general stock market is quite low. Speaking of the correlations, let's take a look at the values from our correlation matrix.
Correlations
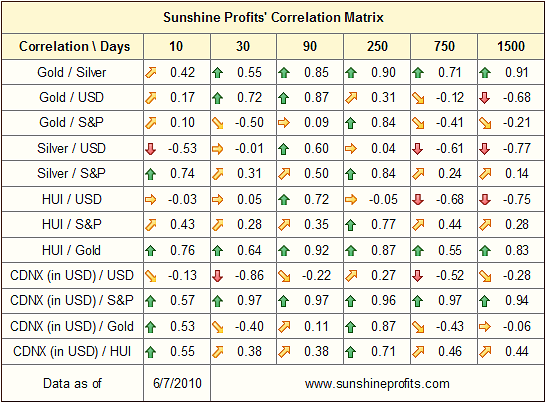
This week, the 10-day and 30-day columns on the correlation matrix give us some insight into the PM sector. We see that gold and USD are highly positively correlated whereas we do not see this with silver and mining stocks. The rally in the USD does not have as much influence on these markets.
Apparently, investors purchase gold with euros and other non-USD currencies. There seems to be little interest from a non-USD perspective in silver and mining stocks, which could be attributed to the phenomenon mentioned above. Namely, the effect that the increase in the value of the USD Index had on the general stock market (it declined), appears to have negatively influenced the white metal and the mining stocks.
This trend seems unlikely to change soon. We, therefore, expect higher gold prices in the nearer term and suggest particular caution if you still wish to hold silver or mining stocks at this time for trading purposes as the situation seems very unclear. As mentioned in the latest Market Alert, we suggest switching to gold instead.
With respect to the general stock market, the correlation matrix shows silver and HUI following similar trends. While not extremely high, the readings are positive. Conversely, gold in the last 30 days has moved on average in the opposite direction of the general stock market.
Summing up, the suggestion here is that caution is needed for trades in silver or mining stocks. Holding gold is clearly preferred over other precious metals (including platinum, palladium, and also the mining stocks) at this time.
Gold
In the recent Market Alert, we discussed how the self-similar pattern, which we've referred to in recent updates, is no longer reliable. It served us guidance for a few months, greatly improving the accuracy of the analysis, but it does not seem to be much useful any longer. Generally, there is a trade-off between particular pattern's reliability, accuracy, and the time that it is valid. The self-similar pattern was really something outstanding because it provided all of the above benefits for a relatively long time. The reality is that each and every pattern has to end and that self-similar pattern could not have been an exception.
The key is to monitor the market and make sure that we remain objective, while judging particular pattern's reliability. Once it stops working, we must respect that and move to other tools that provide us with better signals - that's it, there's no point in striving to over-analyze a particular pattern once it is clearly no longer applicable. The bad news is that this transition point is known only after market clearly refuses to follow the pattern. Since the pattern had been reliable up to the transition point, this means that during the transition, one may not be on the correct side of the trade. This is not something to be overly concerned about, as this is inherent part of trading and speculation that there are no sure bets - it's all game of probabilities. The point is not to be correct each and every time simply because that is impossible.
The point is to adopt rules that will enable one to increase their wealth over time instead of looking for the "perfect tool". There is none, and assuming that something or someone could perfectly (!) estimate future prices will lead to disappointment and - more importantly - financial losses. That is the case because when one would view a particular move as a "sure bet", one would likely use too much capital per trade (why would I use only part of my capital if I know that the market will move up/down?! - one can't know this, one can only speculate with a given probability of being correct, and that is a very big difference.) It could result in temporary increase of wealth, but in the end would end with a spectacular loss, because every now and then even the best tools have to be wrong.
The goal is to identify moments when a particular pattern stops working, and then stop using it, and move to other techniques. Simple as that, yet based on our experience the vast majority of market participants fail to do so. The big alternative to having a good tool that works most of the time, but it is not perfect is not having a perfect tool - the alternative is to have an illusion of having a perfect tool, which will eventually cause losses.
Please take a few minutes and study the case study in our essay dedicated to explain the logic behind diversifying one's assets and why it makes sense to use only a part of one's capital per trade. It's been more than 2 years since we've posted it on our website, but it is just as important today.
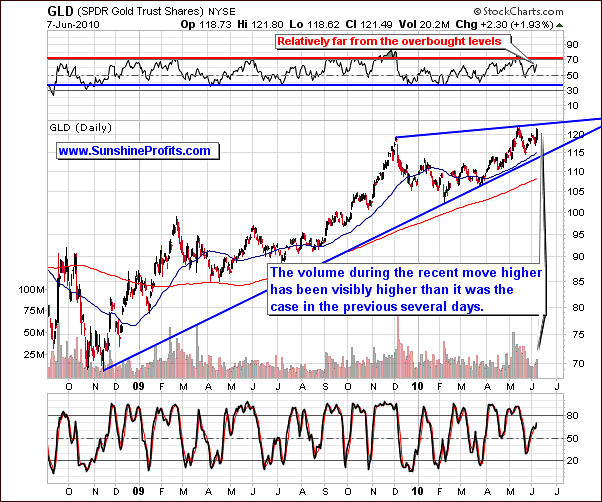
Moving back to the gold market itself, in this week's long-term chart, the more classical RSI tool indicates that we are not in an overbought situation. We saw a decline and then a bounce-back and we may see it go a bit higher than we saw in early-May. The rising support line confirms this. We have seen relatively high volume in recent daily upswings. This confirms an upward direction for gold in the long term.
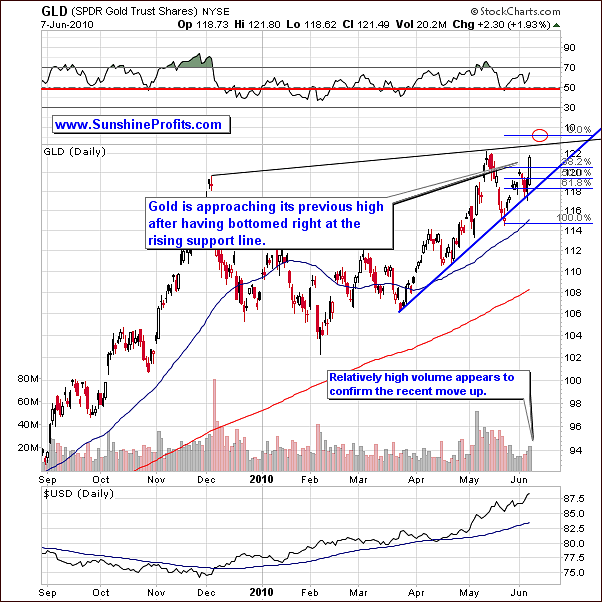
In this week's short-term chart, we see very large volumes. The rising support level has been tested twice followed by additional upward movement. After a slight decline, we saw the rally resume. The rising support line has therefore been verified. The next target is slightly above the last month's high.
Perhaps we will see additional rallies similar to today but it does not seem likely that gold will move significantly higher, simply because this rally appears to be euro-decline-driven, and the next serious support levels in the latter are relatively close. Daily volume levels have not been enormous, as was the case in November, 2009. This market is not showing strength typically seen in the early stages of a major rally. Therefore, a huge upswing in gold prices is not seen as likely. We may see slightly higher movement, perhaps to a level indicated by the red circle on the short-term chart above.
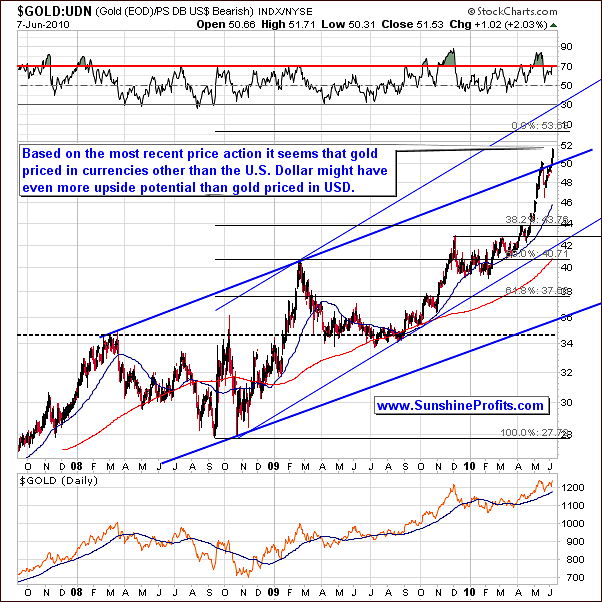
Looking at gold from a non-USD perspective, it is very possible that we will see a more significant rally here than on the USD side. Perhaps, we may see a level as high as 53.6 in the gold:UDN ratio. This is based on extrapolating a line from the October 2008 to early 2009 rally. A similar percentage increase here will bring us to this next significant resistance level.
The suggestion here is that gold is not likely to rise dramatically, especially from the USD perspective. From a non-USD perspective, however, such as the euro, sterling or the Indian rupee, we are likely to see a greater percentage increase in near-term gold prices. This is something that Traders may want to profit on.
Summing up, as we stated in our June 4th Market Alert, it seems a good idea this time to buy gold in non-USD currencies, and to switch to gold if you owned other precious-metals-related assets. A significant rise has been seen recently, and we expect this trend to continue in the short-term.
Silver
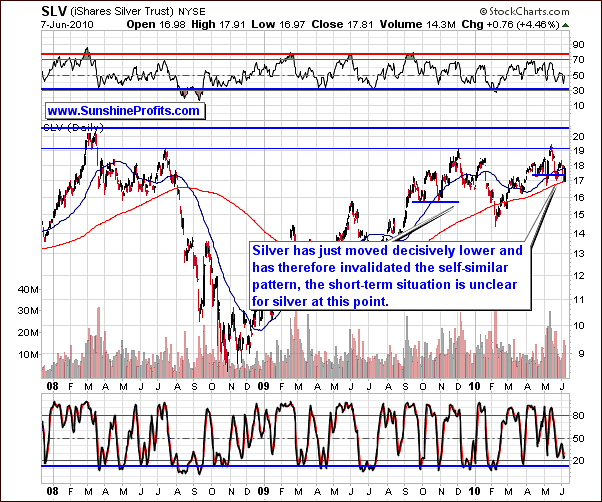
Moving on to silver, in our recent Market Alert we emphasized that one of the key signals that have invalidated the reliability of the self-similar pattern was silver's performance. Silver had moved visibly below the 50-day moving average on strong volume. Up to this point silver's performance was more or less in tune with what we've seen in November 2009.
Despite yesterday's move back up, silver's performance is not really amazing. It is gold that has seen new highs of late while silver has been flirting with bottoms. Given the bearish June seasonal patterns for silver (being twice as strong as those of gold), it is likely that silver will lag behind gold on any upward movement and actually may not go higher at all. Also, we see a positive correlation between the general stock market and silver as compared to gold's actually having a negative correlation.
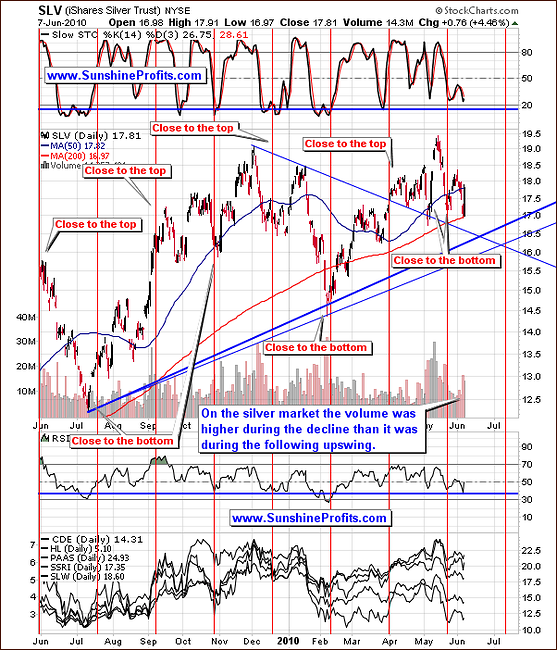
On the short-term chart for the SLV ETF this week, we see several support levels intersecting near the $16-$16.50 level. Regardless, there is a lack of clarity at this time and silver's direction is truly a tough call today. Gold is much more likely to move higher in the near term. Furthermore, the stochastic indicator and RSI are not at levels indicating a bottom, nor are they suggesting a top. Although the RSI did touch the blue line signifying a possible bottom, this was not confirmed by the stochastic indicator.
Summing up, lower prices for silver are quite possible from here. Although we may see a period of sideways movement, it's a tough call, and therefore it seems to be a good idea to move from silver to gold. The metals may also be influenced by the seasonal strength of June patterns, a topic we have repeatedly discussed in previous updates. The month normally shows significant downtrends especially for the white metal. This scenario seems to be even more likely given the weakness seen in the past few days.
Precious Metals Stocks
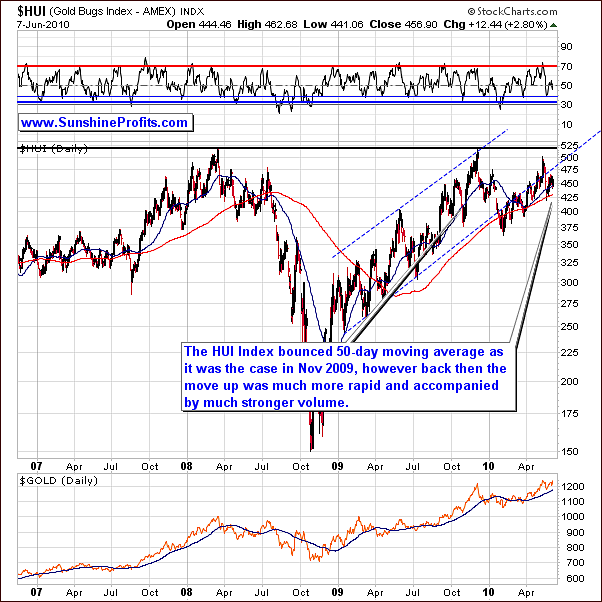
With respect to the precious metals stock sector this week, the HUI index did move above its 50-day moving average. This was similar to the rally seen last November but the similarities end there. The upswing has not been rapid, has not seen strong volume, and also paused (which was not the case in November). This rally's momentum is not even close to the one seen in November, which suggests this is not likely to be the beginning of any serious rally in mining stocks. Although we may see higher prices, it is unlikely that they will outperform gold. That is the case because of the situation on the general stock market is rather bearish at this point.
Furthermore, the RSI is in the middle of the trading level, an indication that upward or downward movements are equally likely.
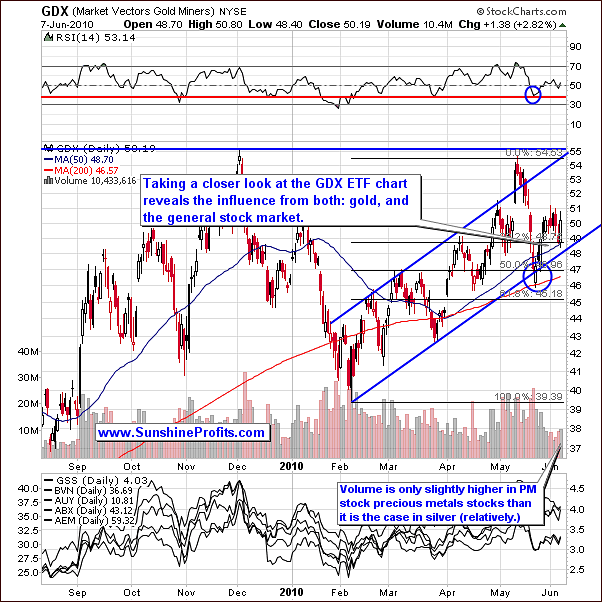
The GDX ETF chart provides us with details regarding volume. At times, this resembles either gold's chart or the general stock market (which has seen huge declines recently). Here, we also see a rebound from the rising support level correction, as was the case in the gold market. The point is that gold is near its previous local top and mining stocks are not. Volume has been slightly higher during this upswing (for 2 days), but the November rally showed far more strength.
The situation here is unclear as was the case with silver. How the general stock market will influence mining stocks is a huge question at this time.
Summing up, gold is by far the most likely profitable investment at this time. It is the only precious metal sector which is showing clear positive trends and probable gains in the near term. The situation is simply too unclear for the rest of the PM Sector.
Other Charts
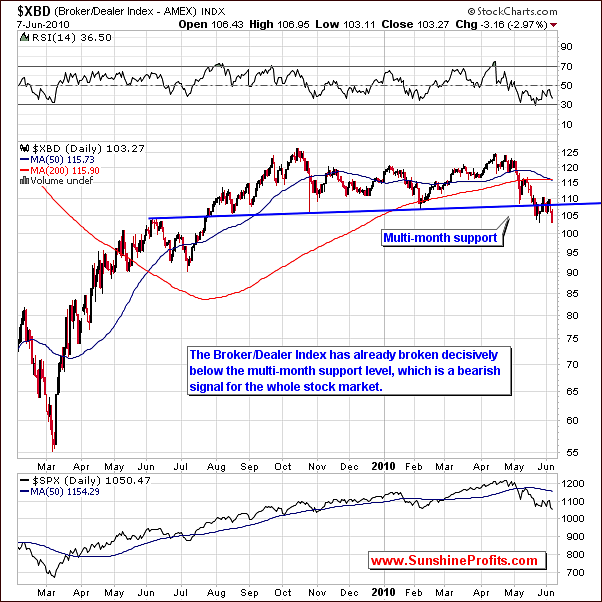
The XBD Broker-Dealer Index is a proxy for the financial stocks. Recently it has been providing important signals as we see it has presently moved below its previous (February, 2010) low level. Clearly, breaking below this important support level suggests that we may very well see this kind of weakness in the general stock market as well. This is bearish for silver and mining stocks.
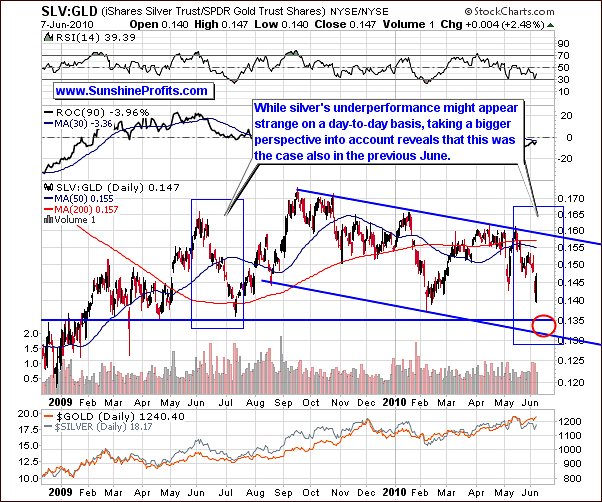
The SLV:GLD chart is another, which we have used on occasion. It is a reversal of the gold/silver ratio, moving in the opposite direction though using the same data. While silver's outperformance is strange on a day-to-day basis, its extreme volatility makes anything possible. Silver is truly a small market when compared to gold and therefore, a single day up or down is not really meaningful as far as implications are concerned.
Still, silver has underperformed gold recently, especially in the past few days where we have seen the self-similar pattern invalidated. Although the decline appears big, it is not yet as big as the previous downswings in the ratio - for instance the Jan-Feb 2010 one, and - more importantly - the June 2009 one. Therefore, if history rhymes once again, we might see further underperformance of silver in the next several days.
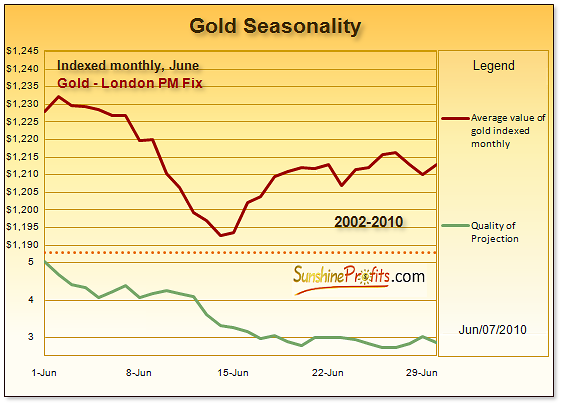
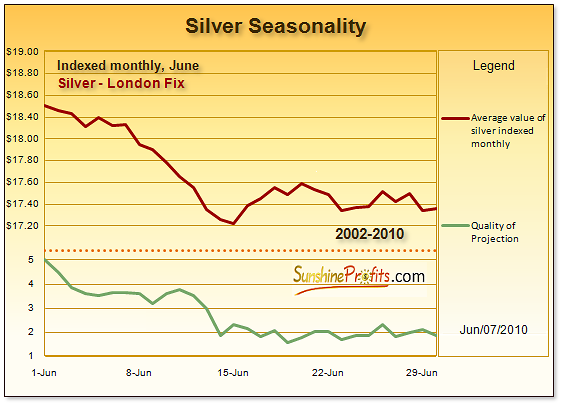
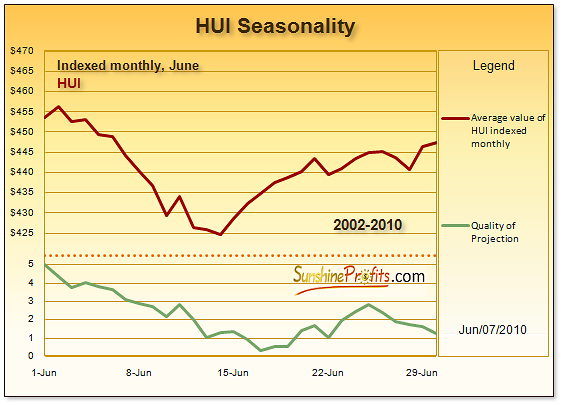
Seasonals
In the previous sections of this update and in the very recent Market Alert we've stated that silver's average decrease in the first half of June is around 6% whereas gold is only about 3% and we would like to take this opportunity to provide you with charts illustrating this phenomenon. Additionally, please note that the average decline in the HUI Index in the first half of June also equals about 6%.
Summary
The situation in silver and mining stocks is unclear at this point, thus making the risk/reward ratio look unfavorable. Gold has a much greater likelihood of profitability in the near term, as compared to other precious metals, and gold upside potential appears even bigger if you're trading gold for currency other than the U.S. Dollar.
With a decent probability of decline on the general stock market and the broker-dealer index supporting a downtrend, the outlook is quite bearish for silver and mining stocks for the week ahead. The seasonal pattern for gold and silver will be weak for the next week. The impact of this seasonal factor has historically impacted silver twice as hard as gold. Quite simply, holding gold instead of silver appears to be a better choice from the risk/reward perspective.
The next Premium Update will be posted normally, on Friday June 11th and it will include our top junior rankings.
This completes this week's Premium Update.
Thank you for using the Premium Service. Have a great weekend and profitable week!
Sincerely,
Przemyslaw Radomski

