
Do you remember the 1983 Hollywood comedy, Trading Places, where two billionaire brothers attempt to illegally manipulate the price of orange juice in the futures market? Although the movie was a work of fiction, the characters were based on a pair of real-life brothers—Bunker and Herbert Hunt—who in the 70s tried to make a killing on silver only to have their heads handed to them on a silver platter. It’s a bizarre drama where even Libya’s Moammar Qaddafi gets a cameo role.
Recently the rise of silver has been spectacular at almost 150 per cent spike over seven months and a high of a $49.70 an ounce peak on Monday. But to put it into perspective let’s look at the even more spectacular 400 per cent rise in five months that took place during the Hunt brothers episode when silver breached the $50 mark.
Here’s a bit of background to refresh your memory.
Beginning in the early 1970s, the Hunt brothers, Texas oil billionaires and possibly the richest family in America at the time, began accumulating large amounts of silver. In 1973 Qaddafi nationalized the Hunts’ oil fields in Libya and demanded a 51% royalty. The Hunts were angry that the State Department didn’t do more to defend their property and as a hedge against inflation and the failure of U.S. policy, they increased the silver purchases. When the Hunts had begun accumulating silver back in 1973 the price was in the $1.95 per ounce range. Early in '79, the price was about $5. In late '79-early '80 the price was in the $50's, peaking at $54.
Keep in mind that it was illegal for private citizens to hold gold at that time. President Franklin Delano Roosevelt had signed Executive Order 6102, “The Gold Confiscation Act,” in 1933 and for the next forty-one years it was illegal for U.S. citizens to “hoard” gold. Since gold, the traditional store of wealth, was not a viable option, the Hunts decided to hold their wealth in silver and began to buy it in enormous quantities.
Beginning in 1973 and continuing into 1974, they slowly began purchasing silver futures contracts totaling 55 million ounces and then took physical delivery of all the contracts. Since they were concerned with inflation and the potential confiscation of precious metals following Nixon's closing of the gold window, (the same worries that keep some people up at night even today) they arranged for transfer of the bullion to Switzerland.
By the spring of 1974, the markets started to get jittery about the amount of silver out in private hands. Annual demand at the time was about 450 million ounces but production was only 245 million ounces. Of the estimated 700 million ounces above ground, only 200 million was deliverable against futures contracts. Silver had risen to above $6 per ounce during this time and then settled back to the $3 to $4 range for several years.
By 1979 the Hunts had nearly cornered the global market. This was a time of uncertainty. A weak President was facing a difficult situation in Iran where Americans were being held hostage and the Russians were waging a war in Afghanistan. During the last nine months of 1979, the brothers profited by an estimated $2 billion to $4 billion in silver speculation, with estimated silver holdings of 100 million ounces. The brothers were estimated to hold one third of the entire world supply of silver other than that held by governments. During the Hunt brothers' silver buying spree, prices of silver futures contracts and silver bullion rose from $11 an ounce in September 1979 to hit a high of $50 an ounce in January 1980.
In response to the Hunt's accumulation, the exchange rules regarding leverage were changed on January 7, 1980 when the COMEX adopted "Silver Rule 7" placing heavy restrictions on the purchase of commodities on margin. The Chicago Board of Trade (CBOT) and COMEX changed the rules in the middle of the game and the Hunts were bankrupted. Their game was up. The Hunt brothers had borrowed heavily to finance their purchases, and as the price began to fall again, dropping over 50% in just four days, they were unable to meet their margin call of $100 million, causing panic in the markets. The price began to slide, culminating in a 50% one-day decline on March 27, 1980 as the price plummeted from $21.62 to $10.80, a day that became known as Silver Thursday.
When it was all over the Hunts owed approximately $1.5 billion dollars. The ensuing panic was felt in the financial markets in general, as well as commodities and futures. There was fear that if the Hunts were unable to meet their debts, some large Wall Street brokerage firms and banks might collapse. A consortium of US banks provided a $1.1 billion line of credit to the brothers which allowed them to pay their margin call. The U.S. Securities and Exchange Commission (SEC) later launched an investigation into the Hunt brothers. The story did not end prettily for the Hunts. They filed for bankruptcy, were banned from trading in the commodity markets, had to pay fines to the IRS. In short, for them there was no silver lining.
For us there were plenty of silver linings this week. Gold and silver futures remained near record highs Thursday after data showed U.S. economic growth slowed while prices for gasoline and food rose. Investors were also moving into the metals as a safe place to park cash after separate data revealed U.S. jobless claims unexpectedly jumped. The intraday peak of $1,535.10, was hit after as the U.S. dollar fell on the back of assurances Wednesday by U.S. Federal Reserve Chairman Ben Bernanke that low interest rates will remain a feature of U.S. policy for an "extended period."
We can’t predict with certainty what will take place in an extended period (we will comment on that in the following part of the report), but to see what might take place in the short term let’s turn to this week's technical part with the analysis of the Euro Index. We will start with the long-term chart (charts courtesy by http://stockcharts.com.)
Euro - USD Indices
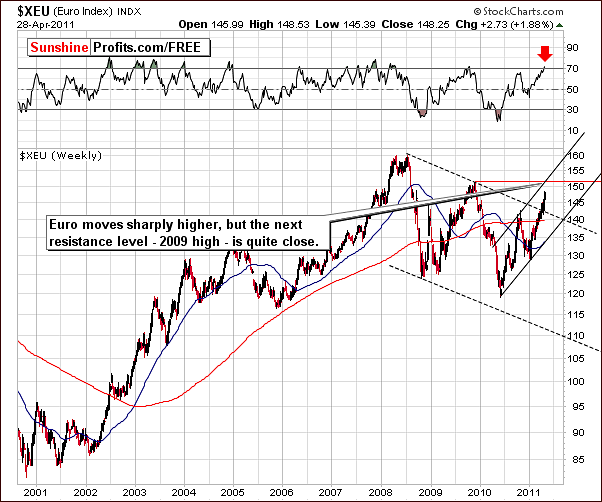
In the long-term Euro Index chart this week, we see a breakout above the declining trend channel. The Euro rallied soon thereafter and the question now is “how far it will go?” Taking the chart and RSI level into account, it appears that a move past the 150 level is possible with likely target area close to 152 (2009 high). This would coincide with the upper border of the rising medium term trend channel and would be in tune with an RSI showing an overbought condition as well.
Here, in this very long-term chart, the RSI may send a sell signal but we must keep in mind that this chart is based upon weekly index levels, not daily. Therefore, the point to sell could materialize in a week or two once this RSI sell signal is given and this is consistent with analysis in later parts of this week’s update.
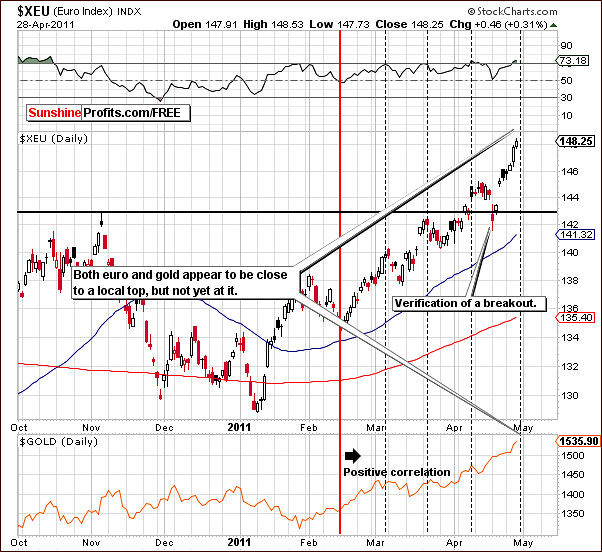
Looking at the short-term Euro Index chart, we see that both the Euro and gold, which are positively correlated, are approaching turning points. Although this is not precise, the indication is that risky territory is fast approaching. Caution is necessary, as both markets could go higher and perhaps Speculators may wish to bet on this. We will continue to monitor the situation, watch for signals of a pending top, and notify you accordingly.
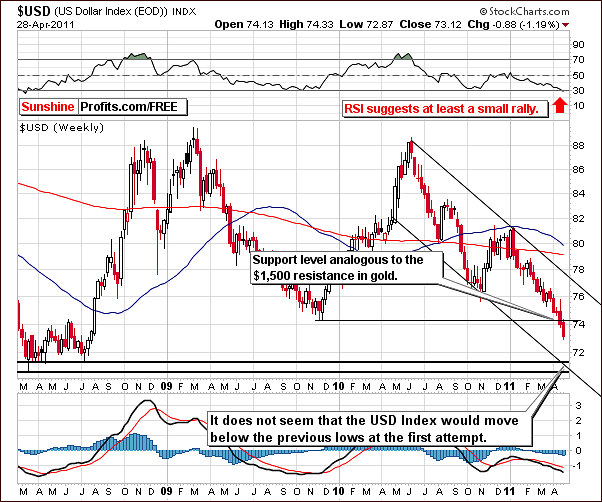
In the long-term USD Index chart this week, the RSI suggests that the trend may reverse soon. Of course, the USD Index generally reflects upon trends in the Euro Index, though not precisely.
A strong support line is relatively far away but with the speed of the recent decline could be reached fairly soon. It does not appear likely that the USD Index will move below the 71 level, at least not on its first attempt. Additional gains for gold are likely to be seen but the situation is quite tense as this key support level for the dollar is being approached quickly.
Given the lack of strong support right below the current value of the USD Index, the message of the RSI is more likely a “watch out” rather than a “buy dollars” at this time.
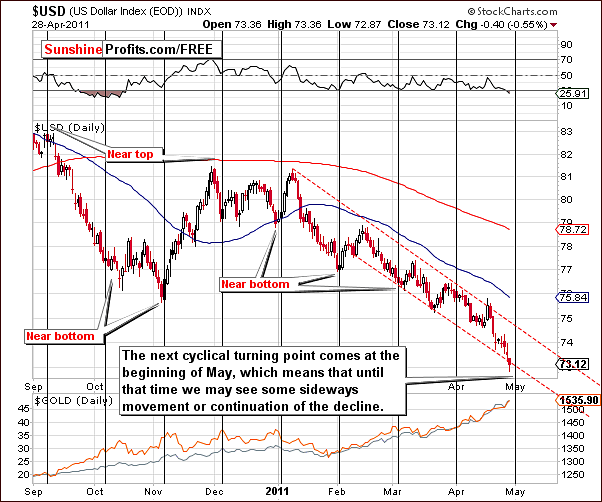
In the short-term USD Index chart, this week saw a rapid decline and an approach to a cyclical turning point. A turnaround in the trend could be seen soon - possibly within a week or so. The same can be said about the precious metals sector, however in this case the reversal would be to the downside.
Summing up, given the current trend and its strength and the fact that no strong support is seen for the USD Index and no meaningful resistance for the Euro Index, continuation of the recent moves is possible in the days ahead, however, it will likely be followed by a move in the opposite direction. Perhaps a sharp one. The Euro could then re-verify its breakout and could decline to the low 140’s. This, coupled with higher USD Index values would likely lead to declines across the precious metals sector.
General Stock Market
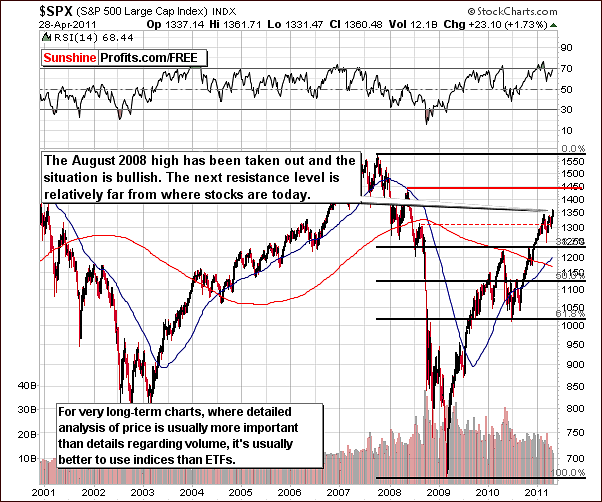
In the very long-term general stock market chart, we have had a significant rally which is clearly visible here. The breakout above the August 2008 highs has finally materialized and the next resistance line is much higher. The outlook is indeed bullish at this time for stocks in general, even though RSI provides an overbought signal.
Correlation Matrix
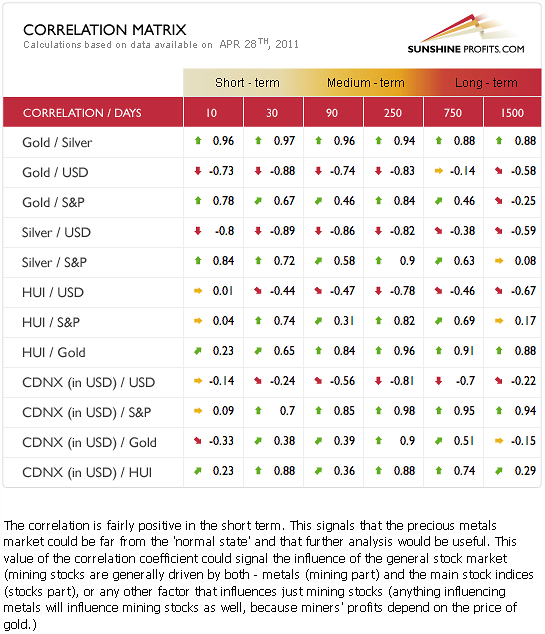
In this week’s Correlation Matrix, we see that the strongest correlation coefficients this week are between the dollar and the precious metals. The general stock market appears to be less important at this time. One noteworthy point is that the positive correlation between gold stocks and gold has recently weakened significantly.
This situation is clearly not normal. Gold stocks are not following gold itself and this cannot be explained by the trends in the general stock market. Gold prices have risen, stocks have generally been trending upwards, yet gold stocks have not followed suit. This is a pattern normally seen around tops in the precious metals and is an important point to keep in mind.
Summing up, the current trends seen this week will likely continue for several (1-15?) days and be followed by a turnaround in both currency markets. When this comes to pass, it will likely have a very negative effect on the precious metals sector.
Gold
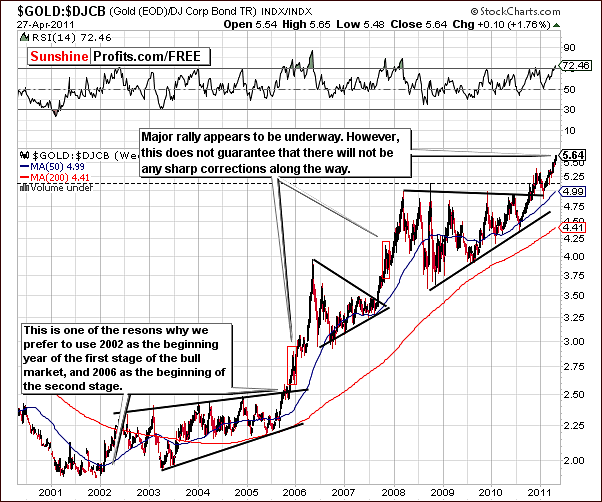
We begin our gold section this week with a look at gold:bonds ratio. The ratio has been rallying since verifying the breakout and moving above the triangle pattern and previous highs. Keep in mind, however, that even though this rally may continue, a sharp correction is possible along the way. We saw this at the very end of 2005 and in late 2007.
With the RSI level above 70, it is possible that a local top will be seen soon, as this has been the case numerous times in the past. Of course, since we are dealing with a very long-term chart here, something which appears very close could still be one or two weeks away.
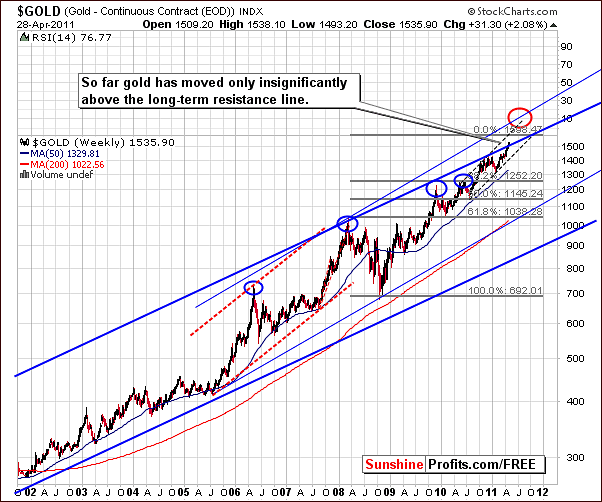
In this week’s very long-term gold chart, we note that a small move above the very long-term resistance line is seen, but with the index level just a little above this line, it is not yet cause for great excitement. Now what we would like to see is a continued uptrend, then a decline back to the support line on low volume and finally a continuation of the rally on significant volume.
Until a clear move is seen following the recent small move above the resistance line, it is not clear whether it is a breakout or a fake out so it must be monitored closely. We will watch the situation in the coming days/weeks and report to you accordingly.
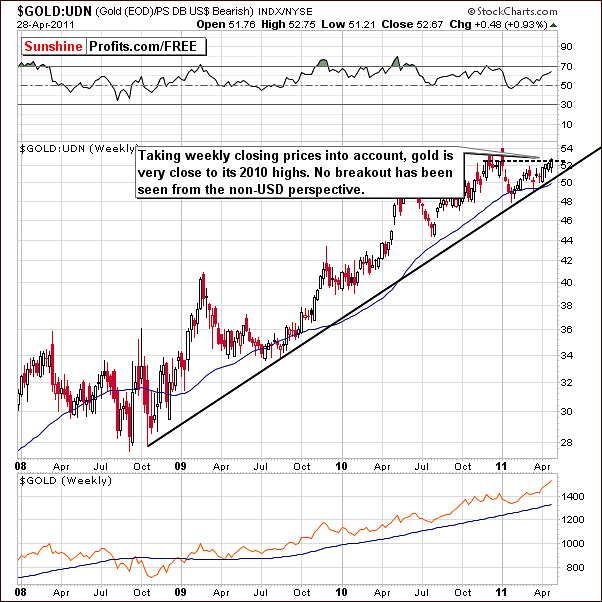
From a non-USD perspective, we can see in this week’s chart that the index has not moved above the level of previous highs. While it is true that the 2010 weekly closing levels are very near where we are today, it is quite clear that we are below the level of intra-day highs seen at that time. When gold from a non-USD perspective reaches the level of these previous highs, this may very well correspond to a local top in gold’s price, also from the US dollar perspective. This is an important point to keep in mind in the days and weeks ahead.
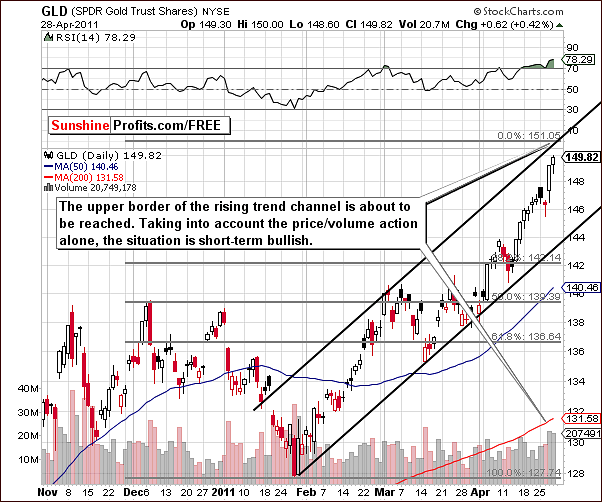
In the short-term GLD ETF chart, we can clearly see that we are in the midst of a short-term bullish period based on the price/volume action seen this week. As we stated in our Market Alert April 28, 2011, the GLD ETF has rallied on strong volume this week. This trend continued on Thursday and the sentiment continues to be bullish overall for the yellow metal.
Price levels are approaching the short-term resistance line which equates to about a $12 higher price for spot gold at this time, however if euro rallies significantly, then we could see gold rallying by more than $12.
It does appear that we are in the final part of this rally and it would not be surprising to see a big plunge, which would obviously signal the end of the rally. Keep in mind that the recent price and volume action which has been bullish in nature could very well continue for several days before reversing direction. We will discuss this issue further in later sections of this update when we analyze the performance the whole precious metals sector right before the previous major tops.
Summing up, although there are still some bullish factors very much in play, it seems quite probable that we are approaching a local top and will see an end to the current rally and a likely decline in gold’s price sooner rather than later. The exact timing of this turn is still somewhat unclear at this time, but in the days ahead, additional signals will likely clarify this and we will keep you informed as more information comes out.
Silver
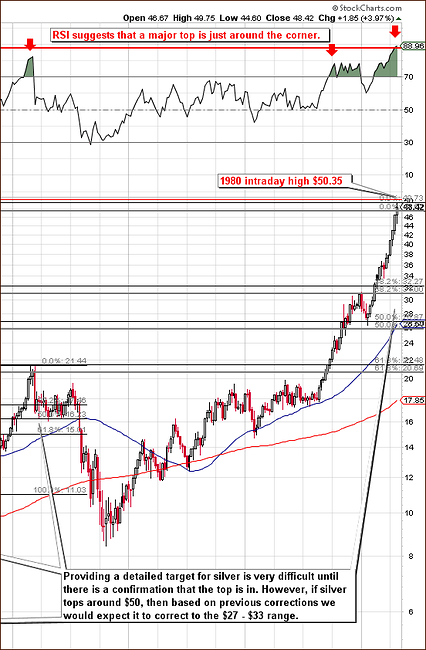
In the very long term chart (please click on this chart for more details) for silver this week, we can see just how precisely the target based on the Phi number 1.618 actually was. Although the $49.73 was not hit exactly, we saw the local top ($49.79) quite close to this level before the US markets opened on Monday.
On April 25th, 2011 we wrote the following:
If this top is going to be similar to the previous major tops that we've seen so far - and we view that as likely, then we will see significant volatility in the following days/weeks and probably a double top of some kind; please take a look at 2006 and 2008 tops in silver for more details. This means that there will probably be another chance to exit the market that would be accompanied by additional confirmations.
On April 28, 2011 we continued:
The volatility is clearly high and silver appears to be on its way to form above-mentioned "double top of some kind". Perhaps it would reach its record $50.35 intraday high. Yes, that is significantly higher from where silver is today, but please note that with this kind of volatility in the white metal, it will not be easy to exit one's position.
The next target level for silver, if it does move above its previous high, could be the 1980 high of $50.35. This should indeed provide a very strong resistance to silver’s rally and without some new support, silver does not seem likely to make it here on its own. Perhaps with soaring stock market and gold moving to new highs, this could be seen but it does not appear at this time to be very likely. Indications are that the local top is close and a big correction, possibly down to the $30's range may very well be seen in the following weeks/months.
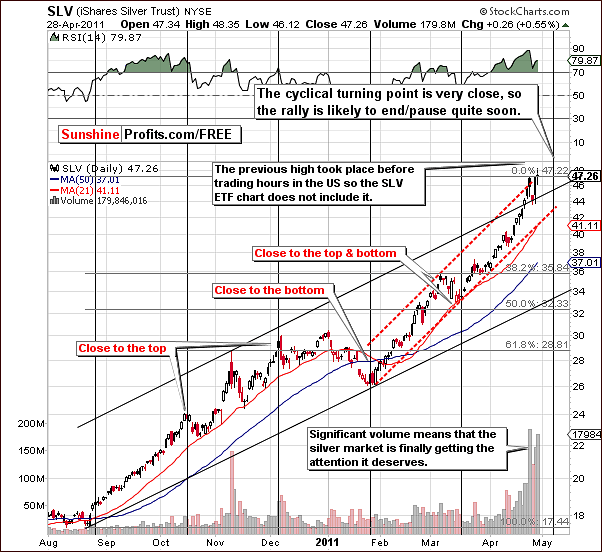
We turn to the short-term chart now to further confirm the points made from our previous chart. It appears that we are quite close to silver’s next cyclical turning point and this may give us some clues as to what will happen next. Silver could top out quite soon (in the first half of May) with a rally or some sideways movement seen until that time.
The likely scenario is for a sharp decline to be seen close to this next cyclical turning point. Although this is not a certainty, this is what we see when all the pieces of the puzzle (points made in other parts of this update) are aligned.
One final point should be made here concerning silver’s recent volume levels. It seems that many Traders have become aware of silver’s story and this is a positive factor for the long term as the white metal has gained exposure worldwide. For the short term, however, this could actually be a negative as it’s possible that almost all buyers are already in the market. More will be discussed on this topic later.
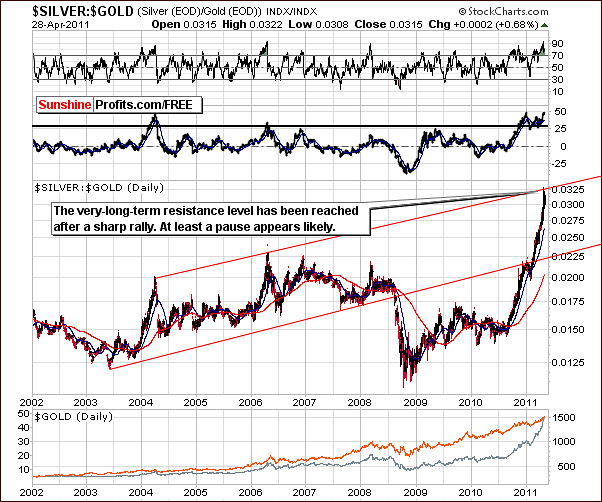
In the Silver:Gold ratio chart this week, we see that the ratio has moved to the top of the very long-term resistance line. It actually reached this point on Monday and moved back down after that. Even if both gold and silver rally, it seems unlikely that Silver:Gold ratio will surpass Monday’s high. In other words, it appears likely that silver’s dramatic outperformance is over – as far as this particular rally is concerned.
Summing up, the situation in silver is extremely tense at this time. It seems that we are near an important top, although we may see higher prices for the next several days/weeks before it is reached. Most Traders should not attempt to take advantage of this rally, for it could be difficult to exit quickly if the situation becomes very volatile. Such will be the case if a multi-dollar decline is seen in silver’s price right after the top is formed.
Mining Stocks
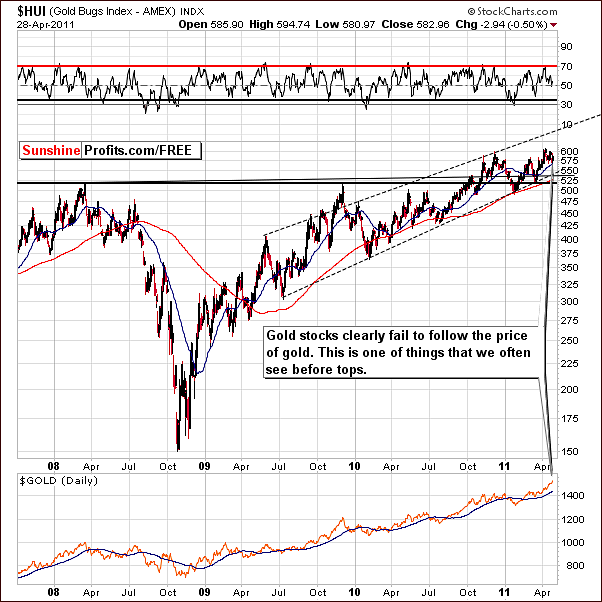
In the HUI Index (proxy for gold stocks) chart this week, we clearly see a profound case of the underperformance of gold stocks relative to gold itself. For example, gold prices rose on Thursday while gold mining stocks declined slightly. This would not have been so bearish if the general stock market had also declined. This was not the case however – stocks rallied.
So with gold’s price rising and stocks in general in an uptrend, the fact that gold stocks declined is clearly bearish. In addition, it is something that we have often seen in the past before important tops. This is, in fact, very much supporting our theory that we are close to an important top.
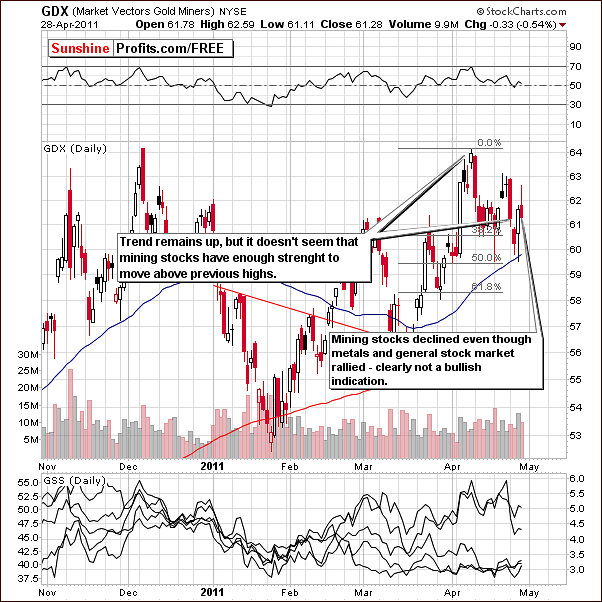
In this week’s GDX ETF chart, we once again see that mining stocks declined instead of rallying. The decline on average volume was seen instead of a rally on strong volume which was the case with the underlying metal.
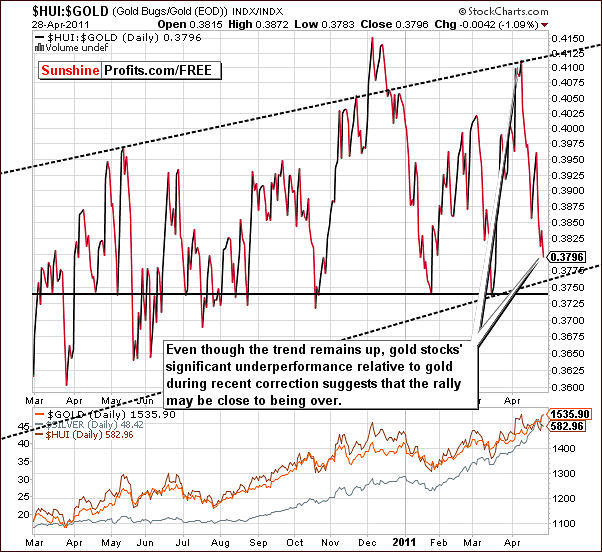
Our final chart related to the gold mining stocks this week looks at the ratio between the gold mining stocks and gold itself. We can clearly see the underperformance of gold’s stocks in recent days without using this ratio, but a look at the chart of the ratio shows that the gold mining stocks underperformance is significant. Investors with holdings in gold at this time should be concerned with its medium-term rally in light of the poor performance seen recently for gold mining stocks. Again, it appears that the end of this rally is close.
Summing up, the underperformance of gold mining stocks is clearly seen from all perspectives this week. Whether it is in the very long-term chart, the short-term GDX chart or compared to the trends seen for gold or stocks in general, the signs are clearly bearish at this time.
Previous Tops
In yesterday’s Market Alert we wrote the following:
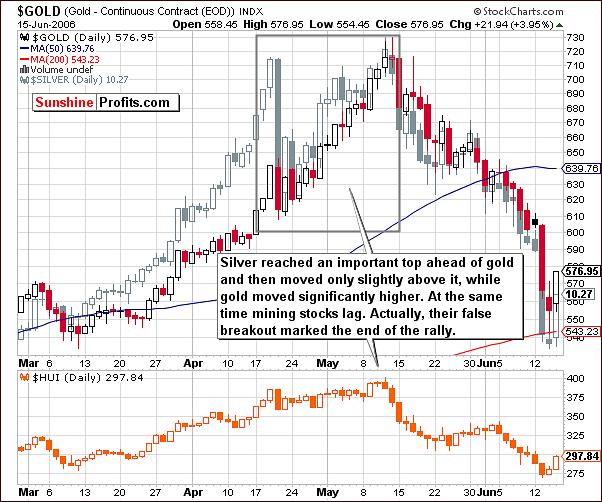
Before the past 2 major tops (2006 and 2008 ones) silver topped out earlier than gold and then moved only slightly above its high while gold truly rallied. Mining stocks have lagged below previous tops and their false breakout in both: 2006 and 2008 meant the end of the rally.
Charts featured in this section illustrate the above point.
Above, we have the first of two charts from prior years which illustrate two previous major tops for gold, silver and mining stocks. We will utilize this information to see if we can apply these past trends to today’s market. If the situation proves to be similar, we could support our theory of being ahead of a major top.
It appears that we have several similarities today to what was seen in 2006 and based on that, we can extrapolate the rest in an effort to confirm points made earlier in this week’s update. In 2006, silver reached an important top ahead of gold, then moved lower, and then went higher along with gold. Gold did rally above the previous highs, however, silver did not. This appears to be the situation once again today. Taking into account Monday’s top for the white metal ($49.79), gold later moved to new highs whereas silver did not.
Another point can be made with reference to the gold mining stocks. Back in 2006, they did little and there was no rally even though metals moved considerably higher - quite similar to the situation today. Once the gold mining stocks finally moved above previous highs, they then declined, giving a final sell signal. It was a fake out not a breakout and a perfect time to exit the market as a huge decline followed for gold, silver and gold and silver mining stocks.
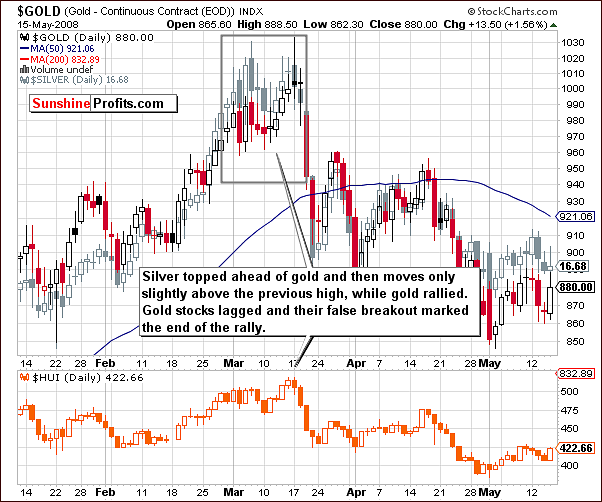
In 2008, do we see similarities as well? The answer is yes, though not to the extent seen two years earlier. There was a double top in silver, whereas gold rallied to one major top. Basically silver topped earlier, moved to its previous high, gold moved to new highs and then declined dramatically. This is a pattern which we are seeing right now, except of course for the decline, which has yet to be seen.
So what about the gold mining stocks in 2008? Well they were moving sideways and doing very little and then moved up above their previous highs in the final days of the rally.
The analogy is quite strong here and thus we have recently wrote that opening speculative long positions in gold could be a wise move at this time. At the same time, the situation needs to be monitored closely for any sings suggesting that the top is being formed – for instance gold stocks moving to new highs accompanied by multiple bearish signals. We will keep you updated.
SP Indicators
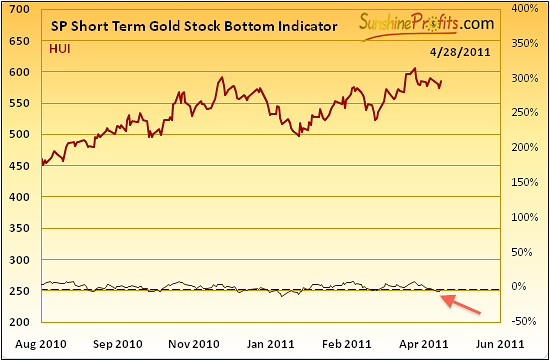
As we stated in our Market Alert April 28th, 2011, our indicator detecting short-term bottoms has just flashed a buy signal which - given its previous performance - is something that should not be ignored. You can check the chart (SP Short Term Gold Stocks Bottom Indicator) in the Premium Charts section on the website.
This indicator did a good job of signaling i.a. the March bottom and also the prior one seen in January –February to name only a few. We were likely at a short-term bottom in the precious metals sectors (right after Monday/Tuesday decline), but please note that this indicator has a short-term nature meaning that it was designed to detect short-term moves. Consequently, the only thing that should be inferred based on the buy signal is that the precious metals sector is likely to rally in the following days. Nothing more and nothing less – it does not tell us whether or not the rally will continue for more than just several days, nor does it tell us if gold stocks will move above their previous highs.
Summing up, combining the above information with other points made in this update, it seems that the whole sector is about to move higher, but the risk/reward ratio is most favorable in case of gold.
Sentiment Analysis
Sometimes traditional technical (we don’t view all of our methods as traditional, though) or fundamental analysis isn’t enough to draw best conclusions; signals might be weak or contradictory, and sometimes. In all cases, it’s good to have some sort of confirmation. So, if we want additional information what would it be?
It seems that we already take into account everything as price is supposed to discount everything and since we analyze price charts then there’s nothing left for us to do – right? Not quite.
First we have to answer the question, what else matters when it comes to stocks? Again, according to Dow Theory, the price of stocks discounts everything (which means that every single information has influence on price), but we can draw some interesting conclusions from some bits of information more so than from others.
One of the most important factors is investors’ sentiment.
Emotions influence investors who very often decide due to their feelings rather than cold logic. Human psychology plays such a significant role in finance, that even a whole separate field in economics called Behavioral Finance was established. It tries to find how human will act in different situations in the market. Many rules of behavior have been researched and established. For example the same amount of money won or lost won’t give us the same intensity of feelings. Losing a certain amount of money will cause us more upset than the happiness felt if we had won the exact same amount.
So, how do investors behave near the market peak?
When the price of gold rises news spreads quickly and the attention of many people focuses at that moment on gold. Everyone is hoping to make some profit, and they are convinced that gold is the best investment for them at the moment. They try to learn as much as they can about the reasons for the price increase and if there is still a possibility to make some money. They use various sources for their research: the Internet, newspapers, magazines, television, government’s information, almost anything they can get their hands on.
If moods are exuberant, more and more people pile in to buy and the price keeps rising. Positive information emerges from the market, which encourage more investors to buy gold, which in turn causes the price to increase.
When the market is bullish, every single positive signal is magnified and prompts huge rises. Negative signals are often ignored, because everyone is thinking positive (by the way, how many analysts are currently ignoring the key fact that silver is very close to its 1980 high which is a major resistance level? There are quite many voices that focus on the short-term rally and completely lose the not-so-bullish long-term perspective).
Prices rise to the point where everyone that was interested is already in the market and there is no fresh capital flowing in. In that case the rally runs out of steam, stops, and then starts to decline. Drops can be dramatic because of speculators who sell their positions. This is the mechanism of how local tops are formed.
So how we can use that mechanism?
We can try to assess sentiment in the market. One of the useful tools is volume analysis, which shows us in fact if the analyzed asset is still popular among investors, or if investors stop buying this asset. However, the major drawback of the analysis of volume in this light is the fact that it’s money-weighted. If there was only one buyer than all the volume would be attributed to this particular buyer, not to the whole market. In other words, volume imprecisely measures the sentiment of the “big guys” and the problem here is that this group is does not correctly represent the whole market as far as sentiment is concerned. Investment advisors, market specialists perceive news and price movements differently than someone new to investing. The key point is that it is this someone new to investing that will act emotionally and whose emotions we want to somehow detect.
If we could somehow measure this sentiment, we would be able to predict tops with greater precision.
The good news is that Sunshine Profits has developed a special tool that can be used to measure sentiment of the average investor for the precious metals sector.
Please take a look below for details.
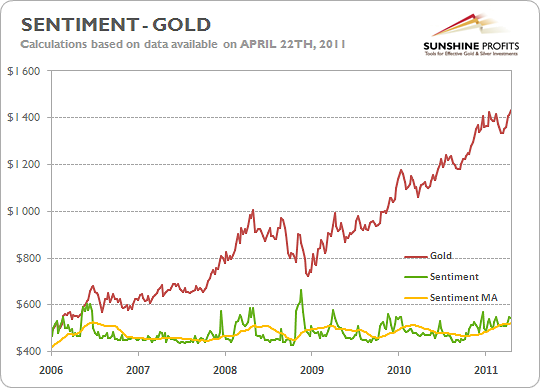
As you may see on the graph above, periods when gold reached its local top converge with periods of a very positive sentiment. The yellow line marks the average sentiment from the last 30 days. Notice that if Sentiment (marked by the green line) has significantly greater values, something interesting happens in the Gold Market – in most cases a top is being formed. Look at peak in May/June 2006. Sentiment was way above its average, and what is more interesting, when Sentiment falls down immediately gold price dropped after a few days. There are many similar cases that you can spot on graphic. Pay attention to the last days and you may see that Sentiment is above Sentiment MA (average).
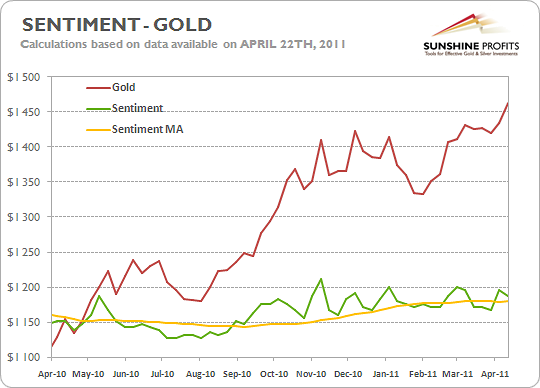
This graph shows you more precisely how Sentiment is related with Gold price. Notice that the shape of Sentiment and of the Gold price is similar. Moreover, you may notice that tops in Sentiment occur almost always before Gold price peaks. Especially interesting is the period between November and January where peaks of Gold prices were formed just after Sentiment peaks.
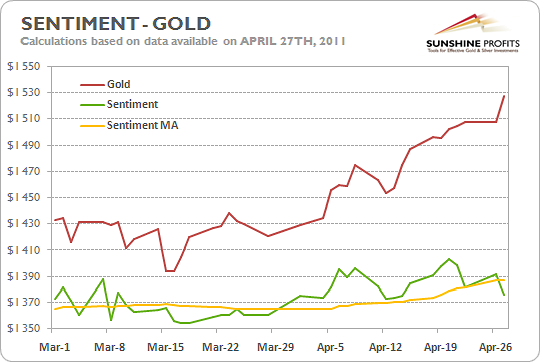
Now let’s analyze the last two months. We can easily spot that the shapes for Gold and Sentiment are similar. However, we may suspect that Sentiment peaks and lows during that period occurred before the Gold peaks and lows. The most visible example of that situation is between the 5th and 15th of April.
Even without taking into account all other factors mentioned in this update, based on the sentiment analysis alone it seems that the top is very close. Price is skyrocketing, however, we observe that Sentiment has become very significant recently after which the dynamic dropped.
Summing up, the fall of Sentiment might be just an “accident”, but we view it as a signal that basically vast majority of those who were inclined to get in the market are already in it. As in the past, it is possible that the price of Gold will continue to rise for several more days, however, it seems that the top is close.
Letters from Subscribers
This week we would like to start with Bolivia, one of the poorest and least developed countries in Latin America, but which is also one of the world's largest silver producer.
What impact would nationalization of mining in the world's sixth largest producer of silver have on short term and long term silver prices?
Naturally, it would be a long-term positive factor for the silver prices as the nationalization of mining would most likely lead to lower supply of the white metal. This could be caused by either governing authorities that would prefer to stockpile silver instead of selling it abroad or by the fact that a monopoly (nationalization – thus more or less one owner of the whole industry) generally produce less and at higher price than it is the case with a competitive market.
In the short term, it's impossible to tell, as markets are so emotional and volatile. Theoretically, nationalization should be a positive factor for the short run (the same logic as above), however it could be the case that this risk is already factored in the price. In other words, this could be the "buy the rumor, sell the fact" situation. If you recall, that was the case when the SLV ETF was introduced. Everyone and their brother explained how positive this will be as many more people will be able to invest in silver. Price soared which could have been partly attributed to these remarks.
However, we should not forget that when the SLV ETF was finally brought to life the price of silver plunged.
Silver's recent volatility simply can't go unnoticed below the radar. This naturally sparks questions about possible upside targets for the white metal.
Do you think that silver can reach $60 by early June? I have read so and am curious what you think about this possibility. It seems to me that the expectations have changed after Bernanke's speech yesterday.
The question is if markets really believed that Bernanke will stop supporting the economy with cheap money. We don't really think so, and thus we don't think that much changed.
Please note that Bernanke is well aware of the fact that he manages not only short term interest rates, but also expectations regarding them and many other numbers as well - for instance inflation expectations. Therefore, instead of taking it at the face value, we would view Bernanke's (and other monetary authorities') speeches as just another thing that he (they) controls.
Summary
The Euro Index continues to rally after its recent breakout, but its next strong resistance level is not far away. The opposite trends will likely be seen in the USD Index and it appears that the currency markets are the key to understanding the precious metals sector at this time.
The current situation indicates that we will see a small rally in the precious metals markets, which will likely be followed by bigger declines after the currency markets correct their moves. Gold moved to new highs on Thursday whereas silver did not.
The topping pattern seen in 2006 and 2008 appear to be repeating. The observation is further confirmed by the lack of proper reaction in the gold mining stocks. This strong analogy indicates the rally is not yet over and a bet on higher values for gold seems appears justified from the risk/reward perspective.
Betting on higher silver prices should only capture the interest of the most risk tolerant of Speculators and higher prices for mining stocks do not appear worthy of consideration at this time. The latter could actually be a signal to exit the market if a breakout above previous highs is seen. This is based upon a past pattern where we actually saw a fakeout in gold stocks followed by a big decline. We will continue to monitor the situation and notify you accordingly.
Our next Premium Update is scheduled for Friday, May 6, 2011.
This completes this week's Premium Update.
Thank you for using the Premium Service. Have a great weekend and profitable week!
Sincerely,
Przemyslaw Radomski

