
There were two “firsts” this week and they were connected. For the first time in its history the U.S.'s perfect triple A credit rating was downgraded, and for the first time in history, gold hit the $1,500-an-ounce mark. Also, the news over the week end of a $1 billion gold bullion purchase by one of the largest college endowment funds sent a strong message about gold’s re-emergence as a respected, legitimate asset class.
When gold hit that psychologically important round number on Tuesday it didn't surprise us, but we admit that silver’s performance in the past few days gave us a small thrill.
Gold prices broke records as investment demand for the metal soared drawing strength from Monday's announcement by credit ratings agency Standard & Poor's, which downgraded the outlook on U.S. government debt to "negative" from "stable" due to the U.S. Government's mounting debt. Despite Washington's promise to tackle the deficit, it has a long way to go to strengthen the country’s fiscal health. There is some irony that the raters who bestowed AAA rating on almost every toxic subprime security now see problems with sovereign government debt. Perhaps they are overcompensating, but nevertheless, this was a blunt warning shot. Gold is possibly the best fear gauge and, if that is the case, then we can safely conclude that investors are running scared. The very idea that U.S. debt obligations could be put on negative watch was a game changing idea for many who always believed that the safe port in stormy seas is U.S. Treasury securities. There are also fears about Europe’s shared currency as Portugal, Greece and Ireland seek financial aid, oil hit highs and there is a palpable threat of inflation. And oh! Let's not forget the game changing turmoil in the Middle East.
Now that gold futures have reached the psychologically important $1,500 level, some are wondering if gold's trajectory will continue or slow down. It is interesting to notice how the two biggest holders of U.S Treasury securities reacted to the news. Japan downplayed concerns about the creditworthiness of the U.S. giving Treasuries a vote of confidence, while China didn't even try to veil its worry. “We hope the US government will take responsible policies and measures to safeguard investors’ interests,” said China's foreign minister. China has plenty of reasons to be worried. It is the largest foreign owner of US Treasuries with $1,154.1bn. in US Treasuries ahead of Japan’s $890.3bn. The Federal Reserve is the largest overall holder of US Treasuries with $1,368bn on its books. The sheer size of China’s reserves means there are no other asset markets in the world large or liquid enough (certainly not gold) for China to stash its increasing cash pile.
As the United States and Europe struggle to get their economies rolling again, China is having the opposite problem: figuring out how to keep its revved-up growth engine from generating runaway inflation.
The latest sign that things are overheating came on Sunday, when China’s central bank ordered the biggest banks to set aside more cash reserves to reduce the amount of money available for loans. This is an attempt to cool down the economy. It follows the announcement on Friday that China’s economy was growing at an annual rate of 9.7 percent, by far the strongest performance by any of the world’s biggest economies. It goes without saying that money problems in China can reverberate loud and clear the world over. High inflation endangers China’s status as the world's low-cost workshop for the world. The only tool central banks have to fight inflation is to rate key interest rates, something they have to do very carefully so as not choke off growth. But the difficult part is that inflation is rising faster than interest rates creating a perpetual negative real interest rate environment (interest rate minus inflation), which means your dollar in the bank is worth less. As paper currencies lose value, gold shines brightly as a store of wealth.
Texas Hold'em
We have written before that institutional investors are going to wake up one day and realize that they need to buy gold for their portfolios. Well, that's beginning to happen.
This week the Texas teachers’ pension fund, one of the largest college endowments, announced that it has placed 5% of its assets in gold bullion, nearly $1 billion's worth, in excess of 650,000 ounces at today’s prices. It is interesting to note that the fund chose to take physical possession of the bullion rather than buy it through a gold ETF. There they sit, all 6,643 gold bars, in an undisclosed location underground in New York City. The chief investment officer for the fund told CNBC that they began acquiring gold in September of '09 at about $950 dollars an ounce and that their average price is about $1,150. He said that rather than continuously rolling futures contracts, it became easier and more economical to take possession of the bullion.
The standard asset allocation recommendations routinely call for a 5-10% allocation to gold (which we find too low). Yet, despite gold’s rise it still represents less than 1% of the global market cap of all assets. Without a doubt, investors will be watching closely to see if this move triggers similar reallocations among other large pension funds. Some big time heavyweight investors are already deep into gold territory, as we have reported before. Some of the big-name investors who were smart enough to profit by betting against mortgage-backed securities have invested their profits in gold. In the fourth-quarter of 2010, legendary investor George Soros added 24,800 shares of the GLD making him the seventh largest holder behind John Paulson who owns 31.5 million shares. Large investment banks are also loading up on gold.
Gold and silver certainly shone this week. Let’s take a look at both to get a handle of what we can expect next. Let’s begin this week's technical part with the analysis of the USD Index. We will start with the long-term chart (charts courtesy by http://stockcharts.com.)
Euro - USD Indices
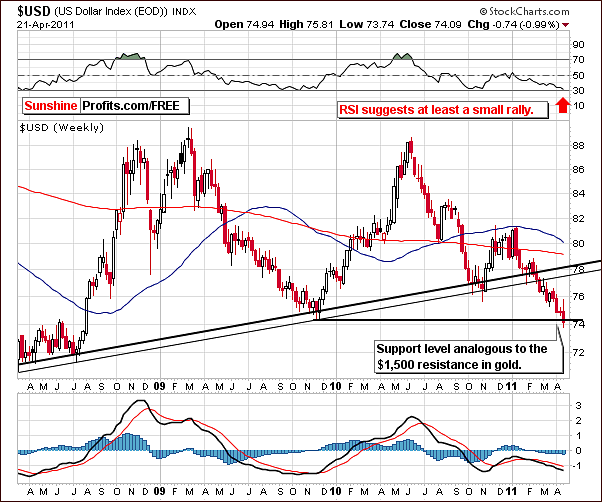
In the long-term USD Index chart this week, we see a continuation of the decline which began in early January. Index levels are now close to the level of the 2009 lows, and this support line is currently being tested.
A slight move below the support line has been seen, but the breakdown is not yet in. RSI levels are currently close to 30 and indicate that perhaps the local bottom will be seen very soon. This has been the case many times in the past when RSI levels were so low.
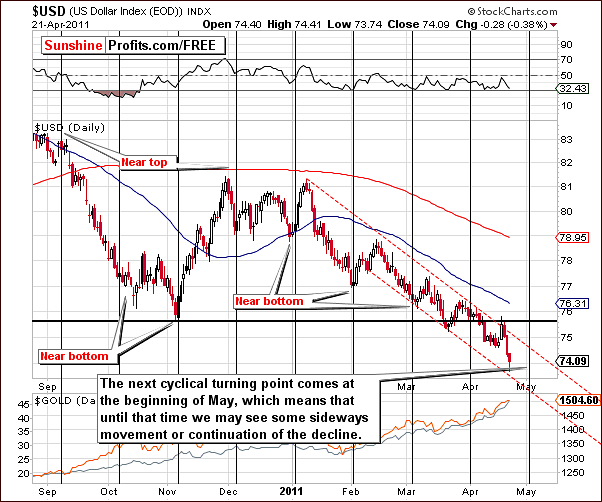
Looking at the short-term USD Index chart, we see that index levels are still within the declining trend channel. The lower border was recently touched and the index moved back up slightly. It does not appear that a rally is imminent as the next cyclical turning point appears to be likely in early May. Until that time, more weakness or sideways movement is more probable as opposed to seeing any serious rally begin right away.
At this time, it’s too early to comment on the likely strength of the next rally in the USD Index. However, given the decline which has been in place since January with no significant contra-trend moves, it is possible that the rally could be significant. This of course, would be quite negative for the precious metals sector in general.
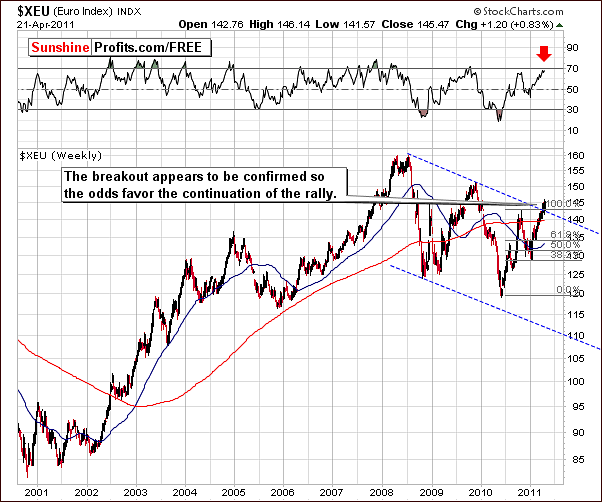
In the very long-term Euro Index chart this week, we can see that index levels have broken through the declining, long-term resistance line. This is a very positive factor and, taking this chart alone, we would expect the rally to continue.
Of course, the situation for the dollar will likely impact what happens with the euro to a great extent. A turnaround is expected in the USD Index but is not likely to be seen immediately. So the rally here in the Euro Index could continue and possibly turnaround in a few days or even a week from now. Of course, this is somewhat a speculation on our part but the charts are suggesting this possibility. In addition, RSI levels are about to flash an overbought signal as they are very close to the 70-level.
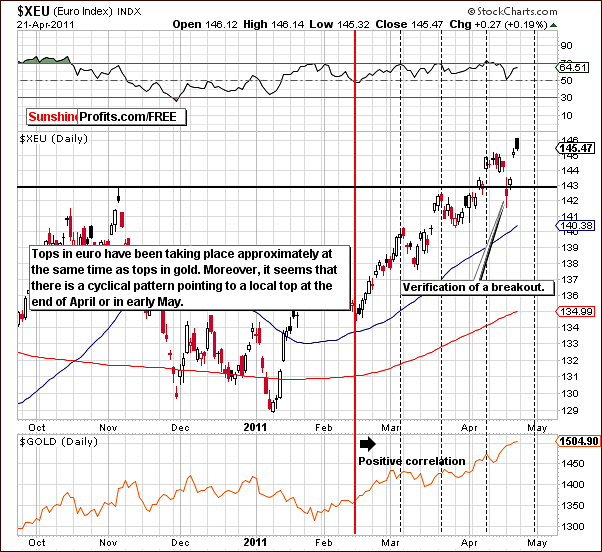
In the short-term Euro Index chart, we see that the breakout has been verified and index levels have moved above the level of the November 2010 high. Since mid-February, tops in the Euro Index have corresponded to local tops for gold.
An early May turnaround could be seen here as well, as the cyclical turning points mentioned when analyzing the USD Index, are present also here. Such a development could have an important impact on the precious metals sector.
Summing up, the decline in the dollar has continued but is likely to turn around within the next week or two. The rising Euro Index is also likely to see a downturn at that time. Taken together, these currency market events will probably have a negative impact on gold, silver and gold and silver mining stocks, but not necessarily right away.
General Stock Market
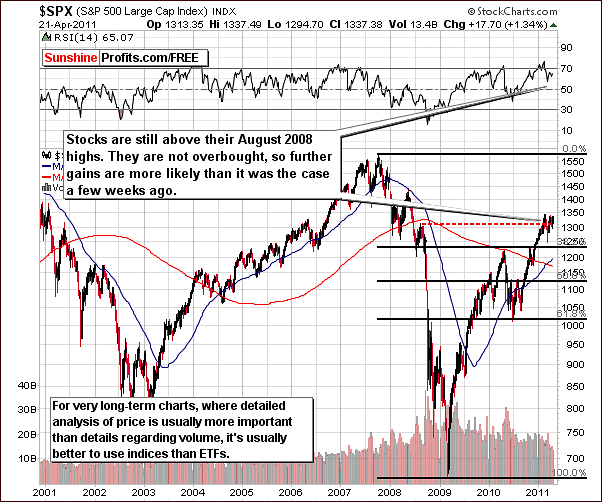
In the very long-term general stock market chart this week, not very much happened overall. Recent price movement has been somewhat sideways and the S&P 500 are holding above their August 2008 highs. Clearly this level (slightly above 1,300) is quite strong from a resistance and support perspective. The current rally paused upon reaching this level early this year.
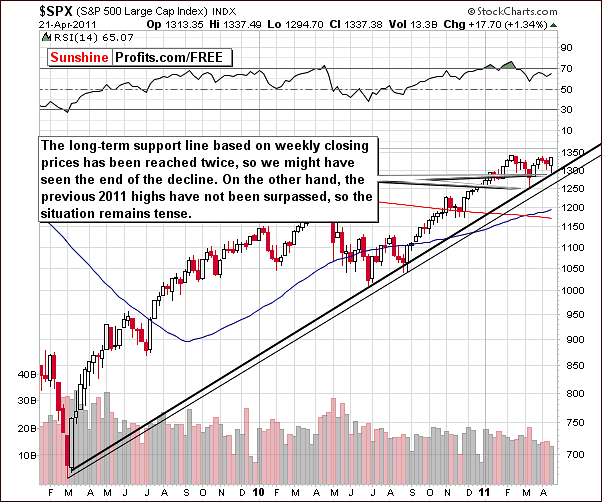
Turning to the medium-term chart for the S&P 500, let’s try to answer the question “where will stocks go from here?” Thursday’s trading session turned out to be quite optimistic and price levels have now moved above 2011 highs in the Dow Jones Industrials.
The S&P 500 – measure for the broad market, however, has not moved above previous highs, so the true breakout in the general stock market is not yet in. A continuation of the rally is likely but is not very likely since the breakout in Dow Jones Industrial Average has yet to be verified by the S&P 500 Index.
Summing up, stocks in general continue to show strength but also are struggling to move significantly above support/resistance levels in the range of the 2008 highs. The trend appears to be up from here but the overall sentiment can only be described as slightly bullish.
Correlation Matrix
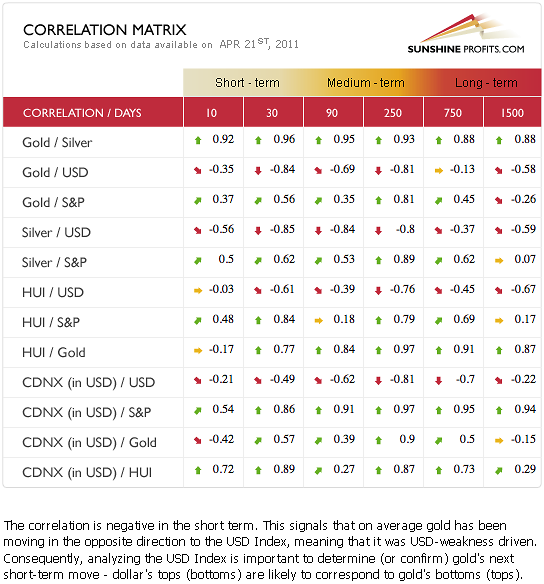
In this week’s Correlation Matrix, we see that the values indicate that currency markets appear to have a more significant impact on precious metals than the general stock market, at least in the short-term columns. Conversely, stocks appear to influence the mining stocks more than does the USD Index.
The performance of stocks in general could be viewed as a possible cause for the lack of any spectacular rally in the mining stocks even though gold and silver themselves have rallied significantly. The correlation between gold stocks and the S&P 500 is actually higher than that between gold stocks and gold itself in the short term. In the medium and long term, gold and gold mining stocks are highly correlated. It seems therefore, that if the precious metals continue in an uptrend, gold stocks will catch up.
Summing up, the dollar appears to be the key point in analysis of the precious metals. This appears to be bullish for the short run; however, a turnaround is likely in a week or two and the situation will remain tense for some time with respect to the pace of growth in gold and silver.
Gold
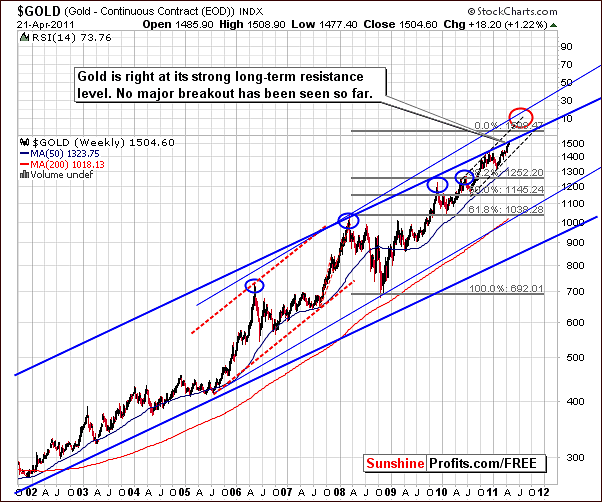
We begin our gold section this week with the very long-term chart. This week, gold’s price has risen a bit more than 1%, but, more importantly, gold has reached the $1,500 target level we have been writing about for several weeks now. This is an important resistance level, but the most important one is the upper border of the rising trend channel (marked with thick blue line). Although Thursday’s close was slightly above $1,500, no breakout above the key resistance line has yet been seen.
A general rule of thumb regarding major long-term breakouts is that they should be visible here in the very long-term chart (that’s a rough approximation of the three-consecutive-trading-days-above-the-line rule). As you can see, gold appears to have reached this resistance line and really gone no further as of Thursday’s close. The situation is tense at this time and will remain so until gold moves decisively either to higher price levels or back below the $1,500 level.
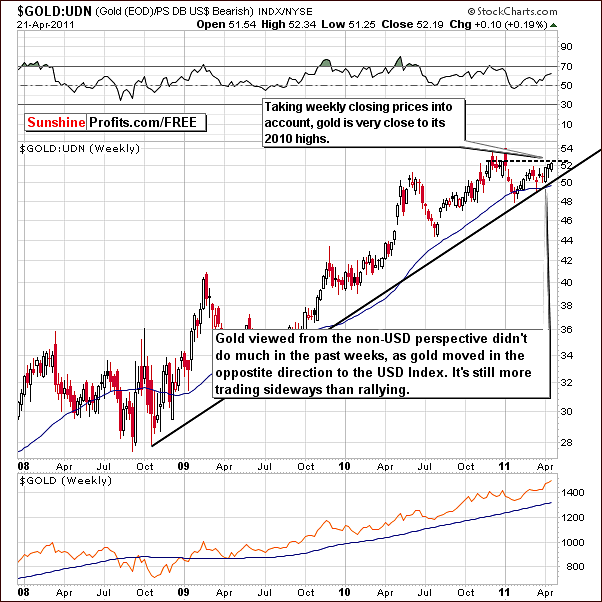
In this week’s non-USD Gold chart, we see index levels have remained below the level of previous highs as well as above the long-term support line created from previous bottoms. This is enough to keep our outlook somewhat bullish, and the likely trend here does remain up at this time. It is important to note, however, that from a non-USD perspective, gold is close to the resistance level created by previous weekly closing prices and this prolong the sideways movement seen recently.
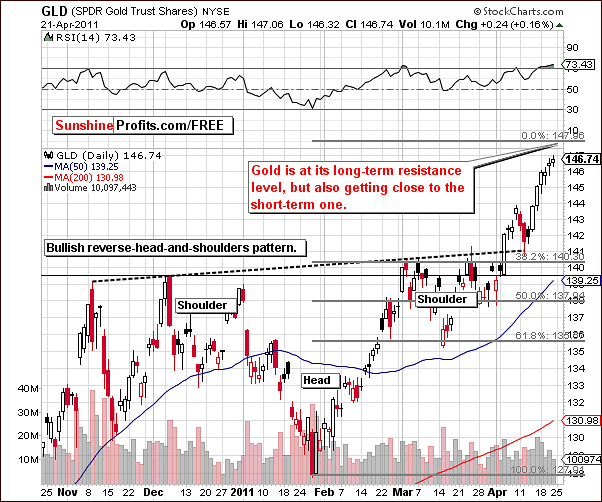
Our final gold chart this week is the short-term GLD ETF (proxy for gold that allows us to analyze volume) chart and it seems that perhaps we will see a quick rally towards the $148 level or so. This would correspond to about a $13 rally in spot gold.
Volume levels have declined somewhat in recent days, which makes us wonder if perhaps the buying power is drying up. While the levels have not been low enough for us to issue a sell signal, it is quite possible that we will send out a Market Alert on this matter very soon.
Summing up, two resistance lines are in play and we are roughly $13 away from our target level in spot gold. Extreme caution should be exercised at this time. Still, at this point it seems that the emphasis should not be put on the analysis of gold, but on silver, and its analysis begins with our next chart.
Silver
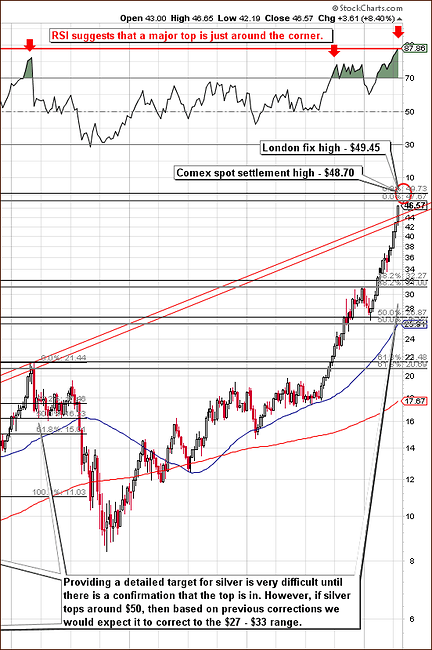
In the very long term chart (please click on this chart for more details) for silver this week, we see that its price has risen close to several very important resistance levels. These have been created by previous highs and by taking into account the Phi number 1.618.
Slightly above Thursday’s close in our chart is a horizontal grey resistance line which we have created based upon the 2001 bottom and the 2008 high (weekly closing prices) for the white metal. Please note that it also corresponds to the early 2011 top.
The thin black line was created using the same major turning points (2001 and 2008 ones), but this time we used intra-day highs. The target level indicated by the red ellipse is based upon these two resistance lines.
Resistance levels based on the Phi number are one thing, but the key point here is that silver is close to its all-time high which is near the $50 level. Several highs are labeled in our chart based on various exchanges. The Comex spot settlement high of $48.70 and the London fix high of $49.45 are both within our target area.
So in all, we actually have four important resistance level slightly below $50 and slightly above Thursday’s close in relative terms (10 years ago 3-dollar move would be viewed as groundbreaking, but right now it could be a matter of just a few days). The speed of silver’s current rally certainly opens the possibility that this target/resistance level could be reached soon.
The high RSI levels, which are seen today also correspond to local tops in 2004 and 2006 and indicate that such a turning point may be at hand. It is also possible that some sideways price action or even a slight downturn may be seen before a continuation of the current rally and the final top. It does appear likely that the target (red ellipse on the chart) level will be reached and this will probably signal the end of the current rally.
Traders who are very risk averse may wish to exit the market now. This is not our official recommendation though. It seems likely that waiting another day or week could be a good option, especially if we get confirmation of silver’s tops from other markets.
Investors with long-term holdings may want to consider preparing to sell part of this investment if the right signals are seen in the coming days. At the very least, all Investors should check silver’s price action (and monitor mailboxes for our Alerts) more frequently as it appears we are clearly in a “Red Alert Zone”.
A final comment we wish to include here addresses how low silver could go once the local top is reached. If this is seen very soon, it seems that, based on previous declines, a retracement of 50% to 61.8% of this current rally could be seen. With the rally beginning at about the $18 level and moving up to $50, the most probable target range for the bottom of the decline to come appears to be between approximately $27 and $33.
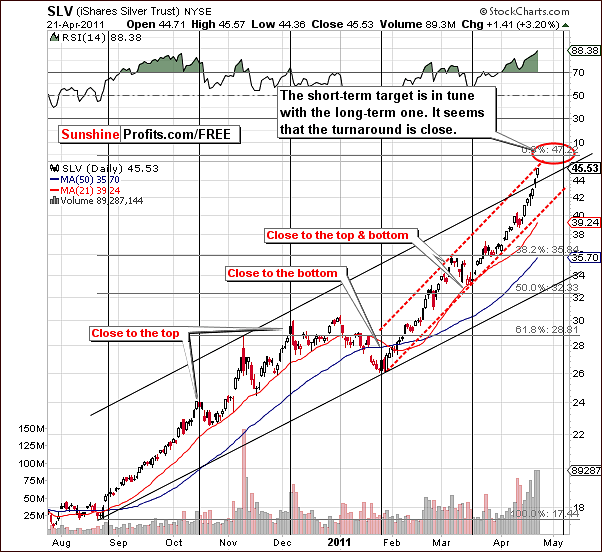
Turning to the short-term chart for the white metal, we see another confirmation that a local top could be seen soon. SLV ETF levels are currently close to the upper border of the rising trend channel. Thursday’s closing price was also very close to the target level in our chart which was created by extrapolating the beginning of the rally with local tops seen in early November and early March.
The target level is slightly above $47 (SLV ETF), which is roughly $2 above Thursday’s close and corresponds to a $48 price for spot silver. These levels are in the lower section of our target area. It is clear that a major top could be seen soon and seldom do these tops occur only in one part of the precious metal sector. It is probable that when silver reaches its turning point, gold and mining stocks could do so as well. It seems at this time that silver could be the key to the resulting price moves and subsequent trends throughout the precious metals markets.
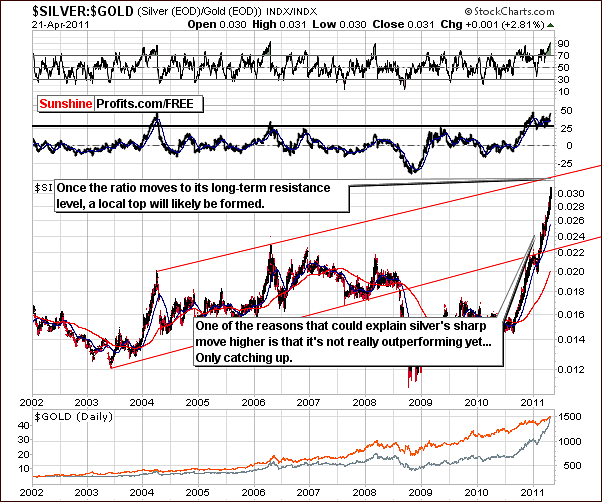
In the Silver:Gold ratio chart this week, we begin with a look back to what was stated in our Premium Update April 15th 2011. We said that the ratio has not yet reached the very long-term resistance line. This upper border of the trading channel (marked with red) will likely be the point at which the ratio reaches its next local top. This will serve as a confirmation that once this resistance line is reached, the short-term rally for silver and gold will likely end.
About two weeks ago, the Silver:Gold ratio was in the middle of the trading range. Since that time, silver has clearly outperformed gold and the ratio has quickly approached the upper border of the trading channel. The speed in which this took place was unexpected and has likely brought us closer to the end of the current rally more quickly than seemed probable. This ratio could, in fact, be the key to properly timing the gold and silver markets at the current juncture. We will continue to monitor this closely and keep you informed of any important developments.
Summing up, silver appears to be fast approaching the end of its current rally. The past eight months have seen a virtually meteoric rise in silver’s price. We will likely see this rally end very soon and the subsequent price decline could be significant. Traders and Investors alike should closely monitor the white metal in the days ahead and be ready to close positions on short notice. We will utilize our Market Alert capabilities as needed when the situation warrants.
Precious Metals Mining Stocks
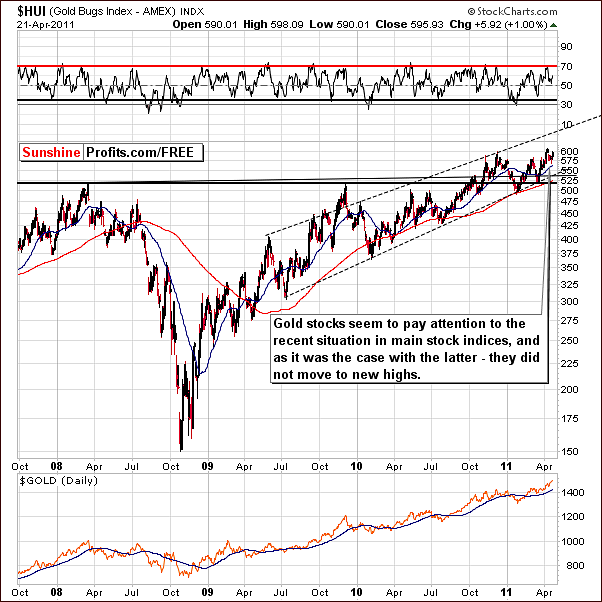
In the HUI Index chart this week, as in all the mining stocks in general, the price action seen was quite disappointing. No new highs were reached even though silver’s price soared and gold moved above $1,500. On the whole, the gold mining stocks barely budged. Their correction was significant but the rally has been insignificant even compared to gold.
It seems that the gold mining stocks have been pretty much paying attention to the situation in the main stock indices having reached no new highs. The same is the case throughout the mining stocks group.
In last week’s Premium Update, April 15th, 2011, we stated “if precious metals themselves continue to rally, gold and silver mining stocks could see much higher price levels as well.” With gold trying to break out above a key resistance level, the struggling gold mining stocks could very well rally if the yellow metal succeeds in moving beyond $1,500. If silver moves above $50, this too would help its mining stocks. It appears somewhat unlikely that silver will succeed on its first attempt however.
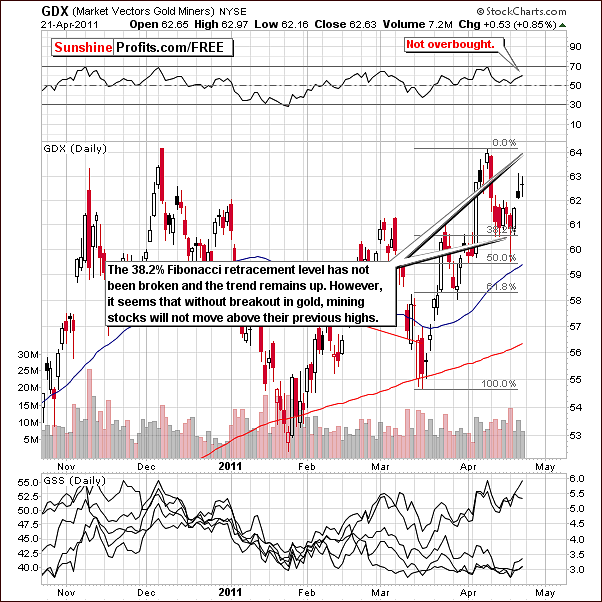
In this week’s GDX ETF chart, we see that the Fibonacci retracement level, which was mentioned last week, appears to have held the decline in check. This support level was actually pierced on an intra-day basis with a close above it and a subsequent rally. Overall however, this was not overly impressive.
Apparently, gold mining stocks Investors are not convinced that gold will break out above $1,500. Until such a move is seen and verified, gold mining stocks will likely not move to new highs. If gold declines along with silver, it is likely that the gold mining stocks will move lower as well. Gold mining stock Investors should therefore closely monitor the silver market since it appears to be the leading indicator for precious metals overall. We will keep you informed as well as the situation develops.
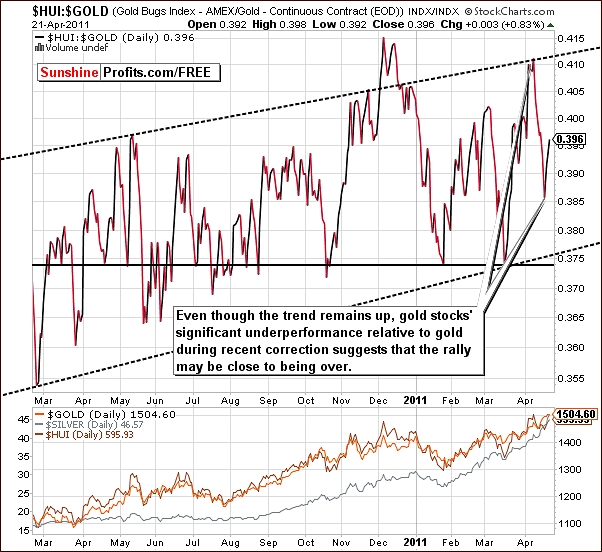
Our final chart related to the gold mining stocks this week is a look at the ratio between the gold stocks and gold itself. Overall the trend is up, though during the most recent correction, gold mining stocks underperformed to a large degree.
The fact that gold mining stocks are underperforming by themselves is not a bearish factor especially when taking into account the breakout above key resistance levels for gold, silver and gold mining stocks. Indications are that these breakouts will not succeed on this attempt and a consolidation will likely be needed first.
Summing up, the underperformance of the gold mining stocks is likely to turn around only if gold can breakout above the $1,500 level. At this point, it’s not very likely.
Letters from Subscribers
We would like to begin this week's "Letters..." section with clarification of the April 8th, 2011 Premium Update. Our Subscriber asked us to comment on GDX and GDXJ.
In your last update you stated that seniors have been outperforming juniors for six months. However, in looking at a comparison of GDX to GDXJ I see that this is not the case. Is GDXJ not a good representation of the junior mining stocks?
We wrote the following: "generally, precious metals mining junior stocks are not outperforming the senior stocks since the beginning of the year". We did not state that juniors are underperforming - they are generally moving in a way that is similar to senior stocks, and since the risk associated with the junior sector is bigger, then moving your capital from juniors to seniors was not a bad decision. Moreover, yes - we do believe that GDXJ is a good representation of the junior mining stocks.
Now we would like to move to the correlation of the mining stocks to metals.
Can you tell me why coer d"alene mines is going down so much when silver is up and the other silver stocks are up. I can't find any news.
The situation in Coeur d'Alene Mines Corp. (CDE, CDM.TO) appears to be similar to the one that we've seen in GSS several months ago in November 19th, 2010 Premium Update. Please note that back then we wrote the following regarding GSS shares:
The problem is that its price share is often influenced by factors other than the price of the metals and things like that can (and most likely will) happen. It is not possible for anyone to know all the details regarding all the companies, but that doesn't prevent you from including only the best gold and silver stocks in your portfolio. While you cannot know all the details yourself, you can check how other investors assess this company. If markets are rational in the long run, then all we need to do is isolate the required information from the random price moves; after all, each of them is caused by investors' decisions.
Company's share price is related to silver but it is also related to other factors as well. If these other factors are negative and important, then the net effect could be disappointing for people seeking exposure to the price of silver.
For example, although the price of silver has increased dramatically, the price of crude oil also increased, meaning higher costs for most of the companies. CDE's projects could have been influenced by this factor to a greater extent than other companies and this might have caused this stock's underperformance up to date. Shares might get diluted, investors might get scared of particular political risk connected with operations in particular countries and so on and so forth. There are numerous factors to take into consideration before we estimate that the company's profit (and the price share) will rise along with the price of particular metal (here: silver). Remember that some problems with some companies may be difficult to spot. That's why we are not covering typical financial analysis of companies. We have written more about this topic in our Frequently Asked Questions.
In quantitative terms, CDE has a low value of the R-square coefficient in the long term, which is another way of saying that its overall exposure to the price of silver is relatively low. It is very bad from the short- and long-term perspective. CDE is certainly not our first choice when it comes to selecting silver stocks.
So - as it was the case with GSS - it seems to be a good idea to switch from CDE to other stocks, for instance SLW.
Another question we received this week was about the implications of the falling US Dollar:
With the US$ dropping, and the Loonie rising, would it be wise to start investing in US companies with US properties (in areas where currency values are dropping, thus cost of mining in part drops too; or to start considering that Canadian companies with Canadian (Or Australia whose currency is rising faster) with a negative slant?
The key point to remember here is that the currency exchange rate and inflation rate are not independent. Consequently, lower value of the USD does not have to translate into lower costs for mining.
The main cause of both inflation and lower currency exchange rate is that the money supply is too big. The result - based on the basic law of supply and demand - is lower value of money (given currency). It's lower in terms of goods (goods are more costly because of that - inflation) and in terms of other currencies (given value of other currencies didn't change). Consequently, lower value of a currency is likely to be seen along with inflation in this particular currency.
In other words, even if value of USD continues to decline significantly we are likely to see significant price increases, which also means rising (in terms of USD) costs for mining companies.
Here is another question from one of our Subscribers that begins with a quote:
… from credible sources, that suggest we are about to experience massive upheaval in precious metals when the Fed backs off from QE2 in the near future. The recommendation is a near complete, short term jump to cash to ride out a “flight to safety” as the stock market crashes (taking precious metals with it – a la 2008).
The logic seems sound. The only question I would have is … how would the government sell treasury bonds if the Fed doesn’t monetize them at this stage?
That is a very good question, which is one of the reasons that we are hesitant to take this piece of news "from reliable sources" for granted. With politics (and in this case, international politics) there are simply too many unknowns to take into consideration. Perhaps the Fed would agree for a partial monetization, or perhaps treasuries would be bought by some other financial entity, which would agree to buy them without demanding higher interest rates in exchange for some other favors... All too speculative to make financial decisions based on it. We'll get back to this once we have more information.
Summary
The USD Index has continued to decline and could go a bit lower before reaching a local bottom. The Euro Index has just verified a breakout and moved above its declining trend channel. When these indices eventually turn around, the impact is likely to be negative upon the precious metal sector.
The general stock market appears to be in an uptrend but no breakout has been seen in the broad market. With the Dow Jones Industrials breaking out without a corresponding move in the S&P 500, the situation is only slightly bullish at this time. Stocks still appear to be somewhat hampered by the level of the August 2008 highs which has appeared to be providing both support and resistance at various times in the past few months.
The short-term implications still appear to be positive for the precious metal sector in general. The tendency of the currency markets could reverse and visibly influence the precious metals. A turnaround could very well be seen here as well.
The target levels and cyclical turning points suggest additional small rally in the precious metals sector. The target for gold is somewhat unclear, silver is likely to move closer to its previous highs just below the $50 level and mining stocks are likely to move to their previous highs. The most important market to monitor at this point is silver and silver:gold ratio, which is about to reach its own target level.
So, summing up, a turnaround in the precious metal sector is probably close at hand. Very risk-averse Traders may wish to close long positions, though this is not our official recommendation at this time. We will continue to monitor the situation and report any confirmations of local tops being in. If the situation gets much more bearish than today and local tops are confirmed, we may suggest selling part of one’s long-term holdings.
Our next Premium Update is scheduled for Friday, April 29, 2011.
This completes this week's Premium Update.
Thank you for using the Premium Service. Have a great weekend and profitable week!
Sincerely,
Przemyslaw Radomski

