
What kind of metaphor could we use to describe the price action of precious metals this week when gold hit a new record of $1,476.37 an ounce and then fell off the high only to rally once again on Thursday? A mountain range like the Alps with valleys and peaks, or maybe a bumpy roller coaster in an amusement park?
It seems that metaphors in our everyday language are ubiquitous like hotdogs and mustard in a baseball game. We use them without even thinking about them. The earliest metaphor is found in the Sumerian language narrative The Epic of Gilgamesh and Aristotle talked about metaphors in his “Poetics.”
What else are the terms “bull and bear markets” if not metaphors? When we talk about money we tend to use liquid metaphors. According to David Brooks in his latest column in the New York Times, “We dip into savings, sponge off friends or skim funds off the top. Even the job title “stockbroker” derives from the French word brocheur, the tavern worker who tapped the kegs of beer to get the liquidity flowing.”
Professor Michael Morris, a psychologist in the business school at New York’s Columbia University, studies the metaphors used in the media to describe movements in stock prices. He claims that the choice of words can influence investor expectations. When the stock market is going up, we tend to use “agent” metaphors used to describe a living thing with clear intentions. The market climbs, or soars, or fights its way upward. On the other hand, when the market goes down, we tend to use metaphors for inanimate objects such as the market falls, drops, plummets or slides. In the course of human evolution we had to be able to think quickly on our feet if something was alive or not. If something is moving downhill it could be a rock rolling but if it's moving uphill, you could literally bet your life that it's alive.
Professor Morris conducted a study of three groups of college students. Each group received graphs of stock market activity along with one of three versions of a commentary. One version described the price trends with “agent” metaphors like "jumped" or "climbed.” The second group got commentary that used object metaphors, which made it seem that the movements were the result of external forces. Prices might have "dropped off a cliff" or "bounced back." The third version was free of metaphors and used plain words like "the market increased" or "the market decreased."
The study showed that participants who had been exposed to the agent metaphors were more likely to forecast that the market trend they had observed one day would continue on the following day. In other words, the content of commentary and the metaphors used does affect the judgments that investors make.
Professor Morris's team analyzed the metaphors used on a cable television stock market program and found that when there's an uptrend, commentators are more likely to explain that uptrend in “agentic” language, and thereby may lead investors to think that the uptrend will continue tomorrow. Whereas when there is a downtrend, commentators are less likely to describe it in active language.
An interesting thing to observe this week was the reasons that economic commentators gave for price fluctuations. On Tuesday gold for June delivery lost $14.50 to settle at $1,453.60 an ounce at the Comex division of the New York Mercantile Exchange. The gold price has traded as high as $1,468.50 and as low as $1,445 while the spot gold price was shedding more than $11. The reasons for the decline were explained by falling oil prices and by a Goldman Sachs report with a short-term bearish call on oil and copper, the industrial bellwethers. (That’s an interesting metaphor for you. The term “bellwether” refers to the practice of placing a bell around the neck of a castrated ram leading his flock of sheep so that the movements of the flock could be noted by hearing the bell. However, as you will read in the closing part of the update, we think that gold and silver will outperform their industrial leaders).
Precious metals were particularly hard hit by the Goldman-induced selling even though they were not – platinum aside – directly mentioned in the note. Silver had hit a 31-year high of $41.93 an ounce but fell back at one point to $39.75, a 5.2 per cent reversal. The explanation for this in Bloomberg is that an investor took an outsized option bet that SLV will drop 37% by July. Bloomberg reports: "A trader’s almost $1 million bet that an exchange-traded fund tracking silver will plunge 37 percent by July was today's biggest single options trade on U.S. exchanges as futures on the metal reached a 31-year high. The 100,000 options to buy 100 shares each of the iShares Silver Trust (SLV) at $25 by July changed hands at the ask price of about 10 cents and exceeded the open interest of 6,054 outstanding contracts before today, indicating that a buyer of a new bearish position initiated the transaction. The ETF rose to the highest intraday level since trading began five years ago, $40.33, before erasing gains. It fell 0.5 percent to $39.67 at 12:54 p.m. It hasn't closed below $25 since November."
On Wednesday, gold rose recovering after its biggest one-day drop in nearly a month. The explanation for the upward move was that the dollar retreated amid expectations the US Federal Reserve will maintain its accommodative monetary policy for now. Also, the market reacted to the positive industry report issued by metals consultancy GFMS group saying that gold's decade-long price rally could take the metal above $1,600 an ounce by year-end, as investors' appetite for gold sharpens further (notice the food metaphor.) The company sees gold prices averaging $1,455 an ounce this year and sticking to a range of $1,319-1,620 an ounce. In its Gold Survey 2011, metals consultancy GFMS said there was growing evidence that buyers may drive prices still higher this year. "There is a higher starting point for each successive investor-led rally in the price. Thus, assuming investment demand will at some point take off again this year, there remains good scope for new highs in the price to be recorded," the consulting group said.
Thursday morning when gold futures began climbing some analysts attributed it to weakness in the U.S. dollar, the euro and sovereign debt issues in Europe.
When on Friday Gold jumped to another record high to $1,479.70 an ounce on Globex, after settling at $1,472.40 on the Comex division of the New York Mercantile Exchange analysts said it was inflation fears in China that are pushing gold and silver prices higher. China's inflation jumped to a 32-month high. Another reason given for gold's performance was a softer U.S. dollar. We will have more to say on the latter relationship in the following part of this update.
We don’t know if next week investors will get their risk appetite back. While markets are not focusing on geopolitical risk in Africa and the Middle East and the Japanese natural and nuclear disasters, these problems remain and will lead to continuing safe haven demand. We turn to the technical portion to give you some food for thought. We have devoured the charts, tried to digest them and we stewed over them and let them simmer on the back-burner. We will start with the long-term Euro Index chart (charts courtesy by http://stockcharts.com.) and we will cook up some explanations and hope that they will not seem half baked to you.
Euro - USD Indices
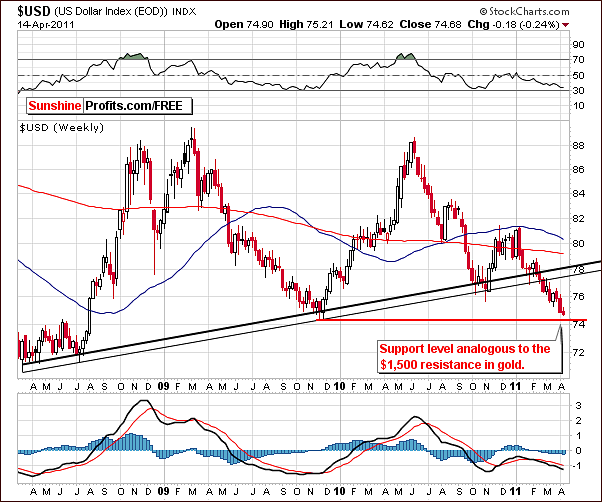
In the long-term USD Index chart this week, the year-long trend of the dollar dropping has continued. The index level has reached levels very close to the support line - close to the 74 level. This is analogous to the $1,500 level for gold; that is, a move to 74 will likely be accompanied by gold moving to $1,500. Should the USD Index break below the 74 level, gold would likely move towards $1,600 after having surpassed its $1,500 resistance level.
Conversely, if the dollar should rally and not decline to the 74 level, gold would probably not surpass $1,500 and, of course, its long-term target level of $1,600 would not be approached at this attempt. The most likely scenario at this time does appear to be further declines for the dollar in the short term and this is good news for gold and other precious metals investors alike.
The above scenario is strongly confirmed by the situation in euro.
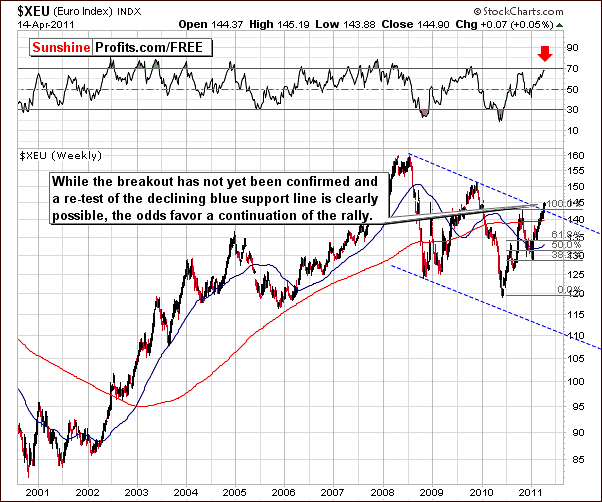
In the very long-term Euro Index chart this week, we have seen a breakout above the declining trend channel. Although this has not been verified, it seems likely that this breakout will be confirmed in the coming days.
Since the euro is the largest component of the USD Index, a rally here is normally accompanied by declines in the dollar. With the breakout being clearly visible here and the rally likely to continue, the USD Index appears headed for further declines.
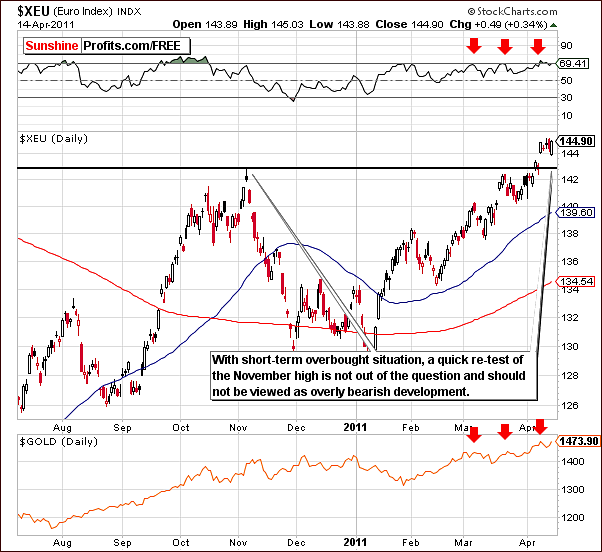
In the short-term Euro Index chart, the breakout is also seen as the index has closed above its November 2010 highs for several consecutive days. It is possible that a consolidation close to the 142 to 143 levels seen last November could be seen and then followed by a further rally.
This would not invalidate the move above the resistance line, which has now become a support line. At this time, it’s clear that a bullish bias is present here.
Summing up, the picture is somewhat clearer this week in the currency markets. It seems likely that the euro will show strength and rally further. The USD Index is likely to decline from current levels and possible move below an important support line in the week ahead. These developments provide positive news for precious metals Investors.
General Stock Market
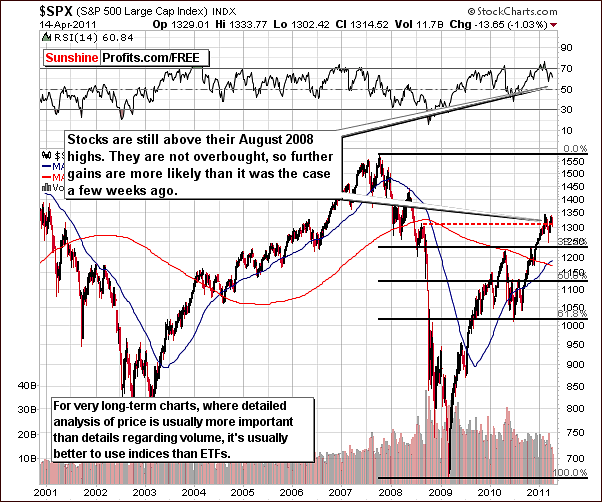
In the very long-term general stock market chart this week, the S&P 500 has struggled to hold on to recent gains. The index level is still above the August 2008 highs however, and the short-term trend remains up. This week’s declines have not changed the short-term outlook at this time.
With RSI levels no longer overbought, a continuation of the 2011 rally is quite possible. Based on analysis of all factors and historical trends, the situation at this time is slightly more bullish than not.
Summing up, a slightly bullish outlook remains in place for the general stock market. Volume levels have been rather mediocre this week and the mixed price movement does not change the overall (slightly more bullish than not) outlook for stocks in general for going forward.
Correlation Matrix
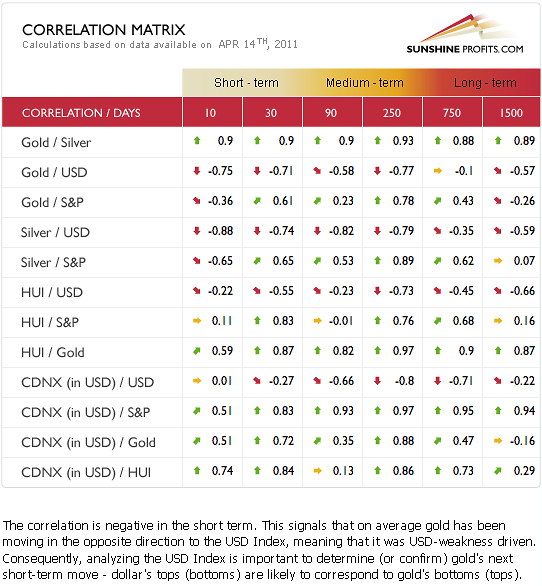
In this week’s Correlation Matrix, we’ll take a look at what does recent developments in the world’s markets mean for precious metals Investors. Gold is quite negatively correlated with the USD Index in both the short term and medium term. This holds true for silver as well. The implication here is that declines in the USD Index should be accompanied by higher prices for precious metals.
The situation in the Euro and USD Indices normally has a profound effect on gold, silver and gold and silver mining stocks. The currency market picture has become a bit clearer this week and the news generally has been positive for precious metals Investors. Gold prices have risen recently and it appears that part of the demand for the yellow metal is likely due to a lack of faith in the dollar.
The implications drawn from this week’s Correlation Matrix are less clear for the mining stocks but there is still a somewhat negative correlation with the dollar. This is also somewhat positive news for gold and silver mining stocks. The short-term correlation between precious metals and the general stock market is somewhat positive. With the sentiment for stocks slightly bullish, this is also a positive factor for precious metals in general.
We strongly encourage you to take a look at detailed explanations of each correlation coefficient. Go to the Correlation Matrix and simply hover your mouse above the correlation value you wish to know better.
Gold
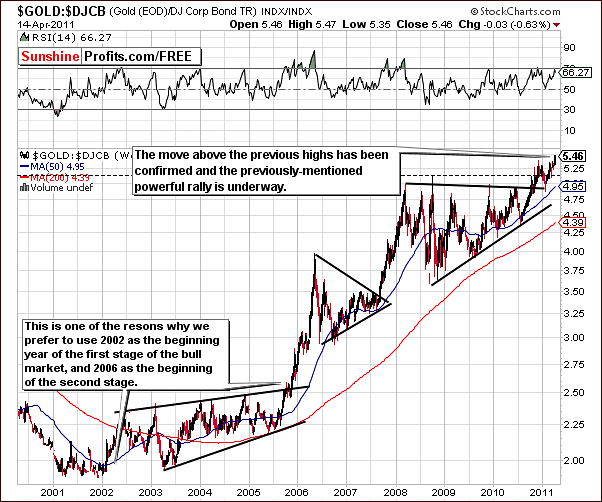
We begin our gold section this week with the Gold:Bonds ratio chart. In the March 18th Premium Update we wrote the following:
It appears that we may have seen a double top formed above the rising triangle pattern and unless gold declines below the upper border of this pattern, the trend will remain up. Even if it moves slightly below, the uptrend will not be invalidated as long as it remains above the lower part of the triangle pattern. We are presently a long ways away from the lower level of the triangle pattern and for this reason, it appears that the long-term outlook remains bullish at this time.
It turned out that the ratio has indeed rallied and that the move down that we’ve seen at that time was just a verification of a breakout. This, and the following rally confirm that we are heading in the right direction – up.
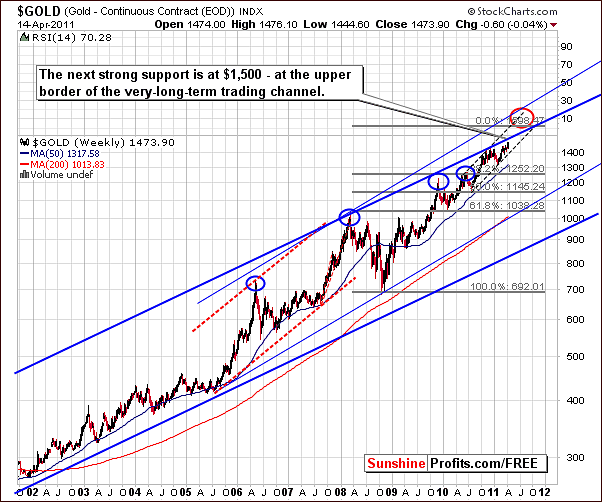
Turning now to the very long-term chart for gold itself, we see that little has changed since last week. The next resistance level is the upper border of the rising trend channel and this has not yet been broken. This resistance level coincides with our short-term target level of $1,500. Once this has been taken out, the door will be open for a further rally perhaps to the $1,600 level or even higher (remember when gold was at $300? Back then a $100 move was a major move that required a year or so to develop – right now we’re taking about a $100 move perhaps in a month or two – talk about an increase in the volatility!).
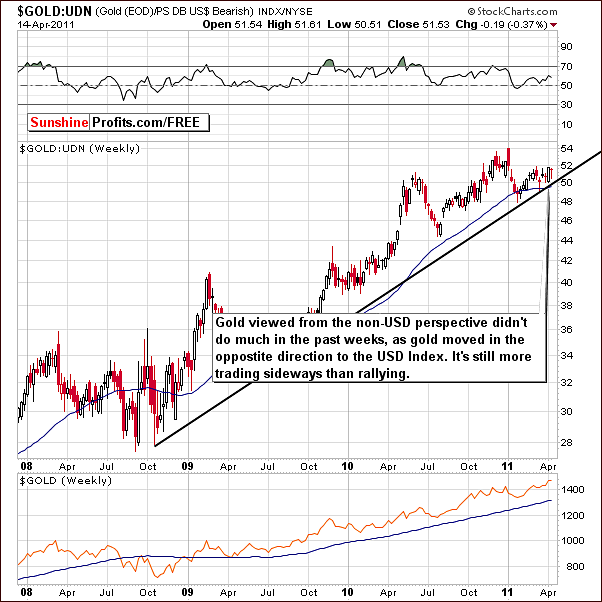
In this week’s non-USD gold chart, no rally has yet begun. Index levels have held below the late 2010 highs and are presently in the range of the highs seen early last year. Throughout recent weeks, index levels have remained above the support line and pretty much traded sideways for some time now. Perhaps what we’re seeing right now (consolidation) is in fact a foundation for a bigger rally.
Gold has climbed this week with declines in the USD Index and this has caused the price action from a non-USD perspective to be fairly mundane. If gold continues to rally significantly from here, then it is likely that a rally will also be seen on the non-USD side as well.
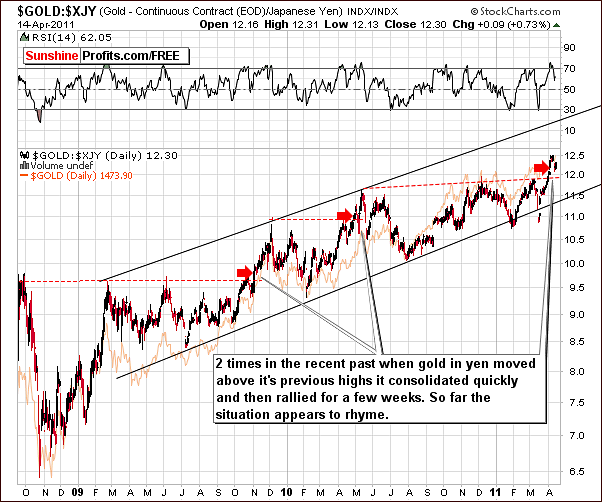
In terms of the Japanese yen, this week's chart shows that the situation is no longer short term overbought (note the RSI indicator in the upper part of the chart). Index levels have corrected somewhat after the breakout above previous highs and in the past, this has generally been followed by a few weeks of additional gains. Perhaps this will be seen once again as the index moves to an important local top which will likely not be surpassed for some time. The situation here is clearly short term bullish.
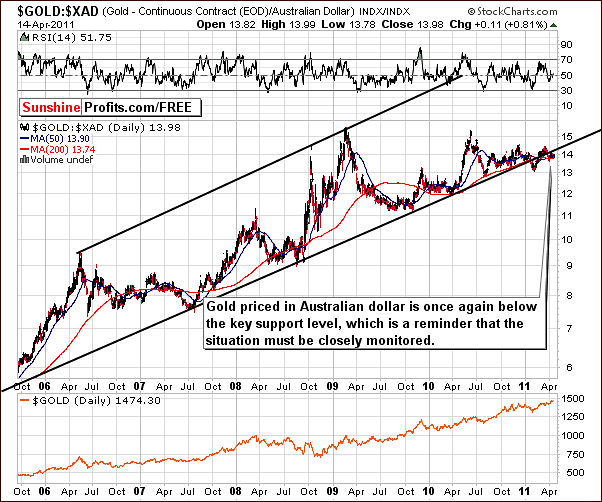
In this week's gold chart from the perspective of the Australian dollar, we see that once again, not every chart provides bullish news for the yellow metal. Once again in this chart, we see that the index level is below a key support level, but we do not believe this is overly important.
The signals which we have received from numerous other gold charts this week are far more important. We do think that gold from the Australian dollar perspective should continue to be monitored and we will continue to do so and inform you of any significant developments.
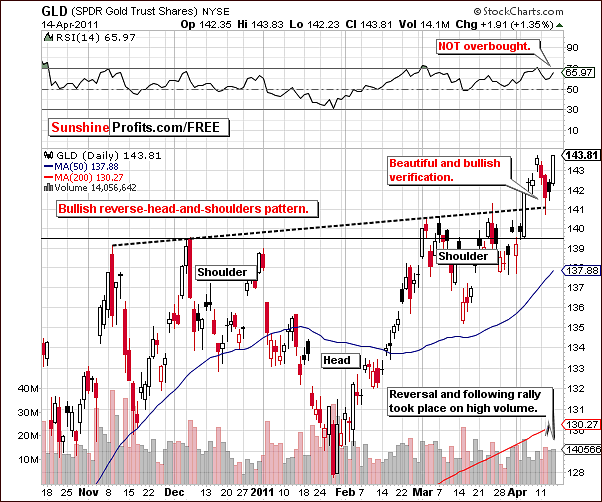
Our final gold chart this week is the short-term GLD ETF chart and it is the most interesting and the most bullish of them all! The very bullish reverse head and shoulders pattern which was formed over the December to April period has indeed been verified.
Price levels have recently moved above the neck portion in the pattern and this move has been verified. Furthermore, the move was accompanied by strong volume, followed by a short consolidation, a decline back to the neck level and a quick reversal and a subsequent rally on significant volume. Simply put, this is both classic and beautiful, a true textbook verification of a breakout.
Based on the information on this chart alone, the possibility of the yellow metal surpassing $1,500 and moving towards $1,600 is very real indeed. It is important however, to remember that numerous charts are analyzed every week and the important $1,500 resistance level must be taken out before we view $1,600 as a viable target. Finally, the RSI for the GLD ETF is no longer short term overbought indicating that additional rally is possible here.
Summing up, in general the signs this week are bullish for gold. This sentiment is supported in several key charts and at this time, long speculative and long investment positions in gold appear well justified.
Silver
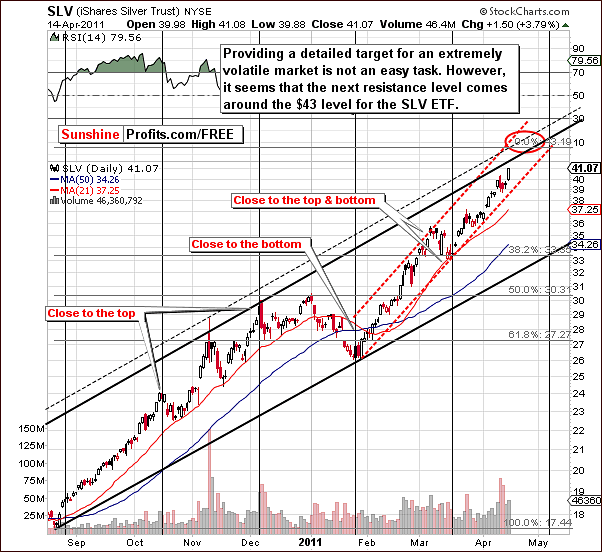
This week's very long term chart for silver did not provide any significant information beyond the fact that the next major target level for silver is in the $50 range. This is about equal to its 1980 high. The long-term chart was also excluded this week as the pertinent information appears to be available in the short-term chart.
With the next resistance level around $43, silver must obviously break through this resistance before seriously moving towards the $50 level. Due to the volatility of silver, it is somewhat difficult to provide detailed targets. It does appear likely however, that silver's rally may pause once it reaches $43. This could very well coincide with gold reaching the $1,500 level.
Although this view is somewhat speculative, the possibility of gold and silver moving in unison towards $1,600 and $50 respectively does appear somewhat real. Of course, there are many unknowns including the currency markets and many things would have to fall in place for this speculative outlook to come to pass.
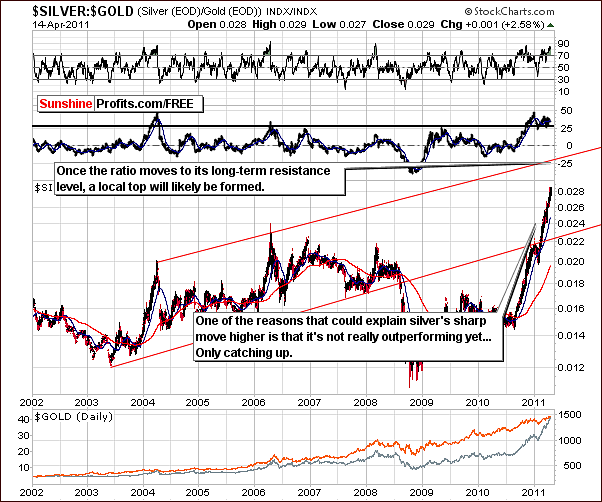
In the Silver:Gold ratio chart this week, note that the ratio has not yet reached the very long-term resistance line. This upper border of the trading channel (marked with red) will likely be the point at which the ratio reaches its next local top. This will serve as a confirmation that once this resistance line is reached, the short-term rally for silver and gold will likely end.
In other words, when the ratio forms a top, we would expect to see a top in gold and silver as well. Note that this would fit the $50 / $1,600 scenario.
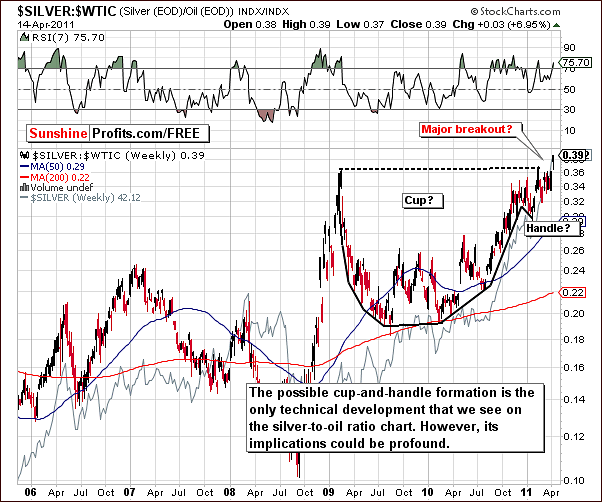
We now present an updated version of a chart which we discussed a few weeks ago in the Premium Update March 11th 2011. We were asked at that time to analyze oil and the ratios between oil, gold and silver. We found only one point of interest that being a possible cup and handle pattern in the silver to oil ratio. This pattern now appears to have completed and the ratio has broken out to the upside. If this breakout holds, it is possible that it will have profound implications for silver investors. In fact, it would imply that silver will actually heavily outperform oil from an investment standpoint.
Decreases in the price of oil would not appear likely to greatly impact the price of silver if the breakout in this ratio is confirmed. Also, if oil prices rise or even stagnate, silver investors will still likely benefit. This is indeed very positive news for those investing in the white metal and is supported in other parts of this update.
Summing up, it is difficult not to be excited about the outlook for silver today. Its performance in recent months certainly has not been a fluke and it appears that further price increases are likely for the white metal. We have presented some evidence which supports silver outperforming oil in the coming months. Silver could move in tandem with gold possibly to record price levels.
Gold and Silver Mining Stocks
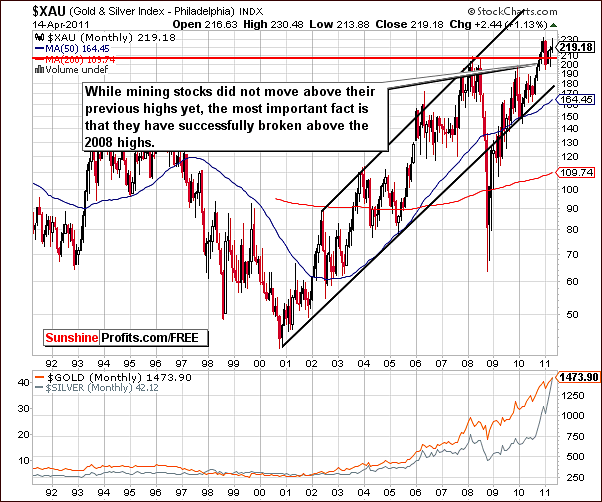
In the XAU gold and silver mining stocks chart, we have not seen new highs this week but index levels have held above the 2008 highs. Although the week lacked excitement, the long-term outlook here remains bullish.
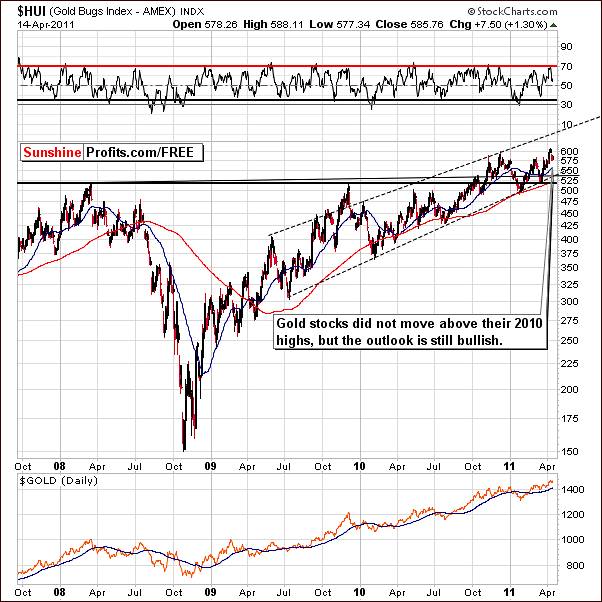
In the HUI Index chart this week, we also continue to view the outlook as bullish. RSI levels here have dropped and are no longer overbought. It appears quite possible that this gold stock index will move higher in the weeks ahead, even though they have not yet broken out to new highs.
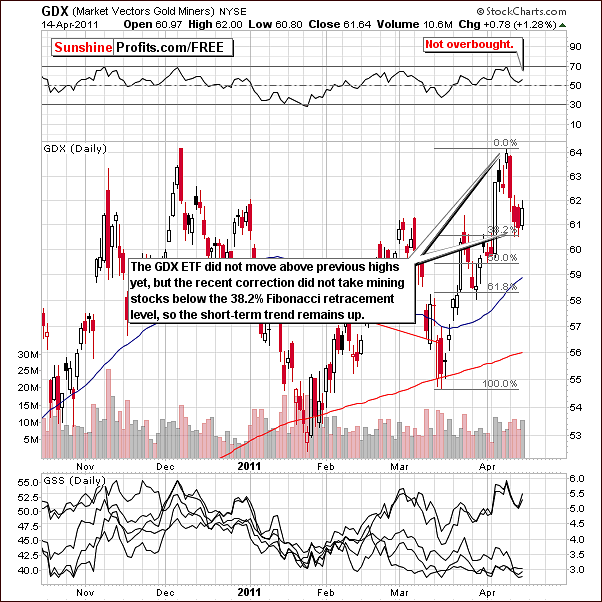
In this week’s GDX ETF chart, at the first sight we see somewhat concerning decline, but after taking a closer look it turns out that the situation is not really bearish.
The midweek declines in the miners were somewhat sharp but did not cause the GDX ETF to move below the 38.2% Fibonacci retracement level. Consequently, the trend remains up.
Thursday's rally, though not as big as what was seen in gold and silver was accompanied by considerable volume. The situation remains bullish for gold and silver mining stocks.
Summing up, the situation in gold and silver mining stocks appears bullish. Long positions here appear to be justified and if precious metals themselves continue to rally, gold and silver mining stocks could see much higher price levels as well.
Letters from Subscribers
This week's developments have prompted some important questions from our Subscribers. We would like to start with the one about the Fed and a possible stop to QE in early May, which would strengthen the dollar and hurt gold. Our Subscriber wanted to know if this forecast which appeared here is not over-simplified. In short, the article says the following (at least according to our interpretation):
- The Fed will likely cease to support the U.S. gov't ["Based on a lot of statements from a number of the voting members of the Federal Open Market Committee" - so no details were provided - Editor]
- The Fed will do this in order to tell the markets that the situation is under control, and at the same time to "leave some powder dry" for the next action (QE3) that could take place later (in 2 years or so.)
- With less than anticipated money supply, the value of the USD will rise and the prices of many assets, including gold and silver, will likely fall at least temporarily.
We agree with the logic as far as the way the mechanism would work - that a delay on QE3 and the possible cutting down of QE2 would have a temporary negative effect on the precious metals prices. However, we are not convinced that that the Fed will cease to support the U.S. government. It might happen, but it certainly does not necessarily have to happen soon. We definitely don't view it as imminent in the coming months. We take this factor into account while preparing our analysis and we are not perma-bulls for any market, including the precious metals market. However, we will prefer to wait for more signals before stating that this rally is over - especially now that gold has moved to new highs and silver is truly soaring.
Another question we received this week was quite common in our mailbox. Do you think this is the correction in silver you said might happen? Where could it correct to and what about the silver and gold mining stocks?
Depends on where and when we have the local top. This is a very important factor to determine the downside target, so we will wait with providing detailed reply until the local top is confirmed.
One of the questions was about a parabolic trend in silver and what does it imply.
Generally, we don't see a parabolic move in silver yet. What we have seen is a sharp rally, but no parabolic shape – at least not yet. The implication of a parabolic move would be that we are very close to the top in terms of days. However, since we don't see that yet, this rally could take silver even higher.
Another question was about platinum and palladium and their relative performance to gold and silver. As far as we're concerned we see the whole precious metals sector moving higher - also platinum and palladium, but at the same time, we think that the further this bull market will take the metals, the more gold and (especially) silver will outperform other metals. The main reason is that gold and silver have monetary history and when inflation really kicks in, a lot of people will lose faith in fiat currencies and will turn to gold and silver. Please note that this is what we saw in the 80s - industrial metals outperformed in the initial stage of the bull market, but in the end, gold and silver more than caught up. Silver especially outperformed heavily in the last stage of the bull market.
Summary
The situation in the USD Index is bearish, mainly due to the recent breakout seen in the Euro Index. The currency markets which have sent mixed signals for several weeks are now a bit easier to read. It appears that the euro will rally and the dollar decline in the short term, even though a sideways (euro's breakout confirmation) movement could be seen.
The situation in the general stock market remains slightly bullish this week. Although price action seen this week has been rather mixed, volume levels have been quite average and with prices holding above the highs of 2008, further rally appears quite possible. The implications here are positive for Gold and Silver Investors.
Gold, silver and gold and silver mining stocks on their own have had rather positive trends for several weeks. The influences from the general stock market and from the currency markets make the outlook even more bullish.
From a long-term point of view, meaningful resistance levels are quite close to where gold and silver prices are today. The $1,500 and $43 resistance levels will be a major factor in the coming days and weeks. Gold and silver mining stocks are generally in the range of previous highs as well.
If the price levels that we just mentioned are taken out, the next target levels are quite profound and important. Gold could move to $1,600 and silver to $50. Gold and silver mining stocks could move much higher as well, although no clear target is visible at this time.
The situation overall is still quite tense though with a positive bias. We will continue to monitor this closely and report to you accordingly if we believe that taking profits off long positions appears justified from a risk/reward basis.
Those of you who have not opened any speculative long positions yet and have time (and will) to monitor the market closely on a daily basis, could still get in the market now. Otherwise (you can't or you don't want to spend too much time monitoring the market) it seems that you may want to wait for gold to break out (and confirm this move) above $1,500 before opening long positions.
Our next Premium Update is scheduled for Friday, April 22, 2011, but – as always – we will keep you informed should anything change as far as our views on the precious metals market are concerned.
This completes this week's Premium Update.
Thank you for using the Premium Service. Have a great weekend and profitable week!
Sincerely,
Przemyslaw Radomski

