As Subscribers to the Premium Service, you were fortunate to know about last week's correction ahead of many other market participants and thus were prepared to hold on tight to your gold and precious metals investments. In the previous Premium Update I said that a brief consolidation is in the cards, and is likely to take place immediately, or after, a few more days of rising gold, silver and PM stocks prices, and a small dip in the USD Index. I wrote:
(…) if mining stocks break down from the triangle pattern, the following move should be rather insignificant - I don't think that it would take the GDX ETF below 37 level.
This week the GDX ETF (proxy for PM stocks) moved down to 37.02 and bounced sharply up. Tuesday and Wednesday's move to the 37 level was swift on relatively high volume, ditching many investors off the golden/silver bull. I doubt these investors were nimble enough to get back on the bull at the exact bottom, and are now wishing they had kept their positions intact. Fortunately, as Premium Service Subscribers, you were well prepared.
Before we get to technical analysis and what's next for precious metals, there is something I read last week you might find interesting.
It looks like The Wall Street Journal, known for its conservative approach to gold, is finally paying attention. It recently published a story titled Catching the Gold Bug about the upsurge in investments in physical gold. And last week the WSJ published model portfolios tailored for our troubled times with gold as a bulwark defense for both inflation and deflation scenarios.
The premise of the article by Jeff D. Opdyke, WSJ personal finance reporter and author of the paper's weekly Love and Money column, was that experts can't agree on whether inflation or deflation is in the cards. This leaves many investors in a quandary as to how they might construct a portfolio at a time of great uncertainty. The article presented three model portfolios: one for inflation, one for deflation and one for the case in which neither takes place.
The idea is for each investor to prepare for the economic scenario he thinks most likely to take place and build in some insurance in case he guessed wrong.
For the inflation scenario Opdyke suggests commodities as the primary play.
Commodities, particularly gold—hedge against the dollar, offering a 2-for-1 benefit if a weak dollar accompanies inflation, as some expect.
Opdyke suggests putting 25% of the portfolio in commodity ETFs, 15% in cash, 15% in TIPS, 10% in REIT and 15% in equities, with an emphasis on mining companies such as Freeport-McMoRan Copper and Gold and other companies tied directly or indirectly to commodity prices, such as driller, Diamond Offshore Drilling, and farm-related companies such as Deere and Monsanto.
Just in case the inflation scenario doesn't pan out, he recommends long-term Treasury bonds and Municipal bonds since both will likely soar in value amid deflation since their long period of fixed payments will become an attractive source of income as prices fall and paychecks shrink.
In the deflation scenario, gold and other commodities move down the scale to become the insurance part of the portfolio. The bulk of the portfolio is a no-brainer. Most (35%) goes into long term Treasury bonds which are likely to surge, and much of the rest into cash (20%) and some municipal bonds (15%).
Opdyke says that in the event that world bankers will manage things right, and the economy will suffer neither severe inflation, nor severe deflation, the recommended portfolio is 20% in U.S. equities with broad exposure to large-cap and small cap stocks funds, and 20% in emerging market foreign equities. Another 30% gets earmarked for a bond fund. For the insurance component of this portfolio to protect against either inflation, or deflation, Opdyke recommends 10% in long-term treasuries, 10% in commodity ETFs and 10% in cash.
Summing up, no matter what one expects the world economy to do next, the WSJ is now suggesting that the commodities share (with PMs being the most important component) in your portfolio should amount to at least 10%. Please note that the WSJ's circulation of over 2 million means that many investors who previously never considered them worthy of attention have just "discovered" precious metals. What's bullish here, is that this type of news is different from what you normally see as a "gold news" (Gold is about to breach $1000 and go higher!). It is not dedicated to hyping gold as a speculative opportunity, but as a sound, long-term part of every investor's holdings. Investors following this type of advice are not likely to drop PMs during consolidations, so this new investment demand is not temporary. Consequently, it contributes to higher gold prices in the coming months and years.
For the record, I believe that one's exposure to precious metals should be much higher than the WSJ essay suggests — more like 20% of one's holdings should be in physical metals, not to mention PM stocks and possibly speculative holdings.
Moving on to this week's precious metals markets, let's begin with gold (charts courtesy of http://stockcharts.com).
Gold
I would like to begin with a yearly chart in order to put current events into the proper perspective.
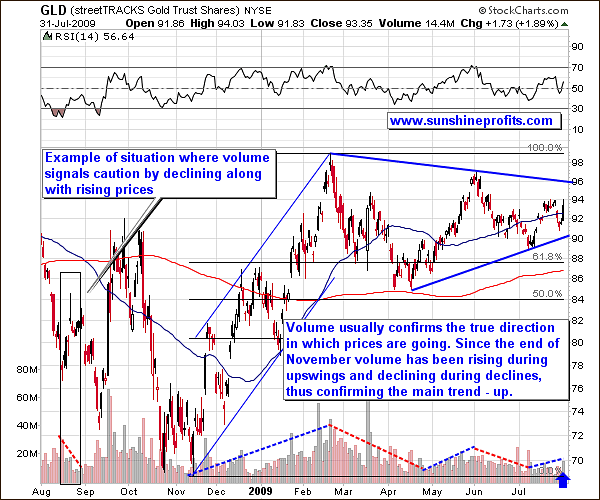
The year 2008 saw disastrous nose-dives in many markets as hedge fund managers were forced to liquidate positions to raise cash. Consequently, many markets were hit that normally would have been expected to hold up well, including the gold market, generally known as a safe haven during times of economic turbulence. As time passed, however, investors picked up investments with the best fundamental situations and prices resumed the previous trend. This is what happened with gold.
Although the situation for gold and other PM markets is favorable fundamentally and now, also technically, there are voices that doubt the existence of the PM bull market and wait for it to plunge once again. My interpretation of gold charts, the fundamental situation and recent news, tells me that higher prices, not lower, are in store in the coming months. I'm not talking about the next several days or even weeks (short term is another thing, and we'll get to that in a minute). I am talking about the direction precious metals will move from here on. I realize that there are analysts out there, who believe that the bull market in commodities and precious metals is over. I disagree.
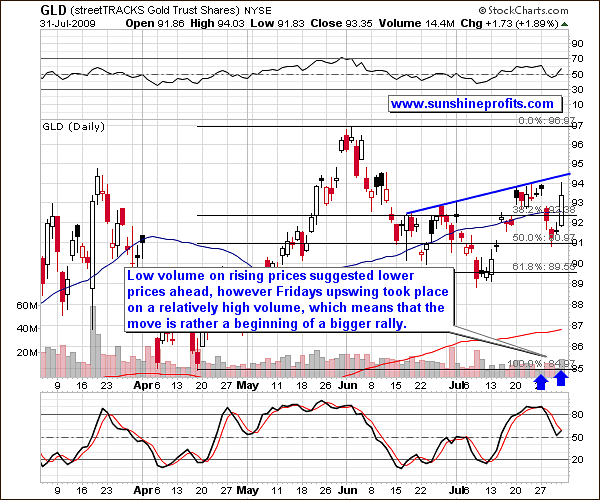
Analysis of the short-term GLD chart reveals that during the period of June to early July, gold corrected about 61.8% of the preceding upswing, which by itself is a sign that the downswing has been completed. Many markets, and particularly precious metals, tend to correct the amounts that correspond to the most important Fibonacci ratios: 31.8%, 50%, and 61.8%. Since we just saw gold correct to the lowest of these Fibonacci levels during the second week of July, we may assume that the declines are indeed over.
Analysis of volume is significant. Gold's move higher on Friday took place on relatively high volume. Please note that the previous Friday we closed higher on very small volume. I wrote that we may infer that gold is likely to move just a little higher before correcting. Gold did indeed move a little higher on Monday, also on small volume (marked with a blue arrow), and then declined. This week the implications are exactly the opposite.
Gold rose almost to the blue thick resistance line, which may stop this rise for a few days, but I expect it to break through after that. If we get a small pullback from here on low volume, and I want to emphasize the low volume, I will consider it to be another favorable entry point.
Silver
Last week I wrote:
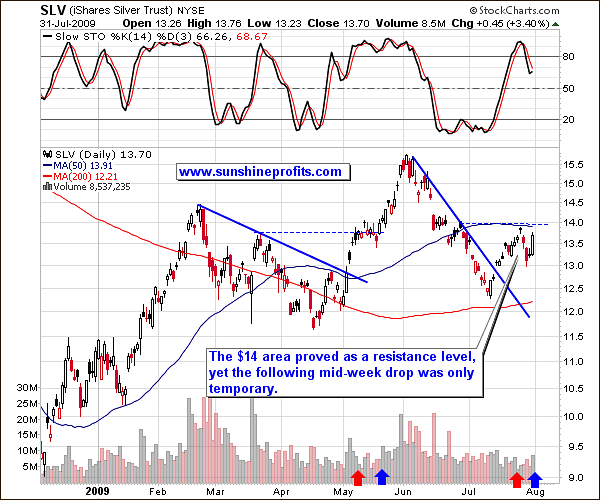
During a similar breakout in May, silver has consolidated around the price level corresponding to the previous local top - the $13 - $14 area. The analogical price level today is several cents higher - around $14.
The small consolidation, which I mentioned further in the essay, took place this week, and now, technically speaking, silver is in a much more favorable juncture. The momentum traders have been shaken out of the market by this week's correction and new buying power emerged. Momentum traders will be back once we move higher, adding more fuel to the rally. (I realize this is a simplification of the entire trading mechanism.) On the above chart we see this as a small consolidation. Many indicators react to such a consolidation by going out of the overbought territory, as you can see in the featured Stochastic Indicator.
Please note that when prices rose on a strong volume, a rally followed (marked with blue arrow), but when the same took place on relatively low volume, we have seen lower prices of silver (red arrows). Therefore, high volume during Friday’s upswing suggests that this day has most likely marked a beginning of a new rally.
Precious Metals Stocks
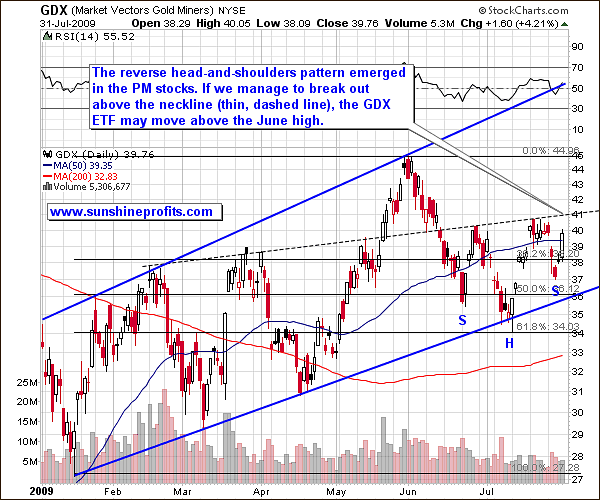
Precious metals stocks have also corrected the full 61.8% Fibonacci retracement level - to $34. Again, this signals that the correction is indeed complete.
Volume has been declining in the mining stocks since the beginning of June, but it is nothing to worry about, taking into account the reverse head-and-shoulders formation that has just emerged in the sector. In this formation, the volume declines as the formation is being shaped, until the price breaks out, at which time we want to see high volume as additional confirmation.
The particularly interesting feature to notice in the head-and-shoulders pattern is that it provides clear guidelines to the minimum range of the move likely to follow a confirmed breakout. The size of the rally should amount at least the "height" of the head. Here, taking the conservative approach towards rounding, it equals $40.5 - $35 = $5.5. After calculating this number we can add it to the neckline level, which is where the breakout would take place. Here it's about the 41 level, so if we successfully break out of the pattern, the GDX ETF is likely to go to at least $46.5.
One thing that might concern us right now is the general stock market's overbought condition, which makes a plunge rather likely. This could be in spite of an encouraging government report Friday that the American economy's long decline leveled off significantly from April through June, crystallizing expectations of a turnaround in the second half of the year. The nation's output shrank at "only" an annual pace of 1 percent in the second quarter, after contracting at a rate of 6.4 percent earlier this year. Consumer spending, however, has continued to fall as fearful Americans tighten their belts. Please take a look at the following SPY chart:
General Stock Market

As far as the general stock market is concerned, there are not many changes from last week, when I wrote:
However, since this rally broke above its previous high of $96.11, we may need to wait for the SPY to go to the black, thin resistance line (about the 100 level) before it moves lower. The 100 level is a resistance level due to the fact that it is a round number and likely to draw media attention. (The 96.11 level corresponds to 956.23 in the S&P).
The main difference this week is that the resistance level is slightly above the 100 level, however the rest of the previous commentary is still relevant. The main stock indices have been rallying strongly during past few weeks and a correction is more and more likely, especially given the overbought levels in the RSI indicator.
The chart for the other important ETF fund, the Diamonds (DIA), proxy for the Dow Jones Industrial Average, has also bearish implications.
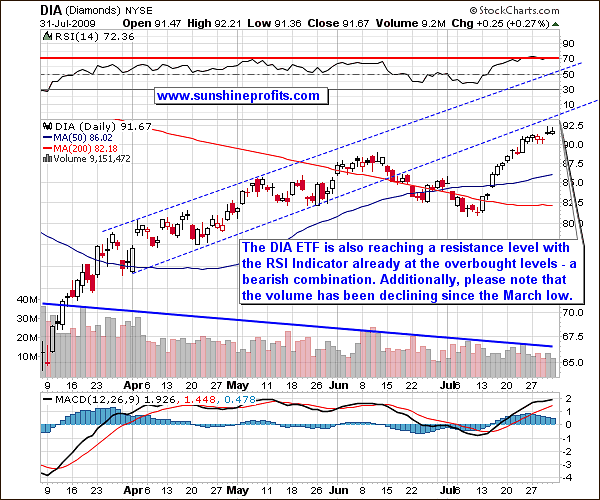
Part of this chart is similar to the SPY ETF chart. The RSI Indicator is overbought also in Diamonds case and the price is also near a resistance level - however a different one - the lower dashed line.
What is more visible on this chart is that the volume has been declining on average since the beginning of March - along with rising prices. This is a serious bearish factor, but unfortunately, it does not provide us with precise timing suggestions, at least not yet. The overall implication of the analysis of volume in the long term is that the PM sector is the place to be, and not necessarily the general stock market.
Although the above charts suggest caution for most stocks, it does not necessarily mean the same for the PM sector, as you will see in the table below.
Correlations
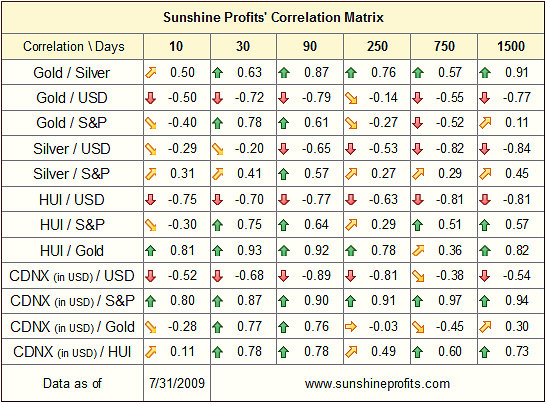
Previously, the USD Index has moved in tune with the general stock market and the precious metals market, which resulted in very strong correlation coefficients. This week, however, the situation has changed. During the last two weeks the correlation between the S&P 500 and the gold sector (gold, mining stocks) decreased significantly. The change has been less visible in the case of silver, as the white metal is generally more closely correlated with most stocks.
It's important to notice that in the case of gold and gold stocks, the correlation turned from positive to negative. In essence, during the past two weeks, gold and PM equities have moved in the opposite direction to the main stock indices. I would not go so far as to say that a bearish situation in the general stock market would be positive for the PM sector in the short term, but the numbers are telling us that a possible downturn in most stocks will not necessarily mean the same for gold. From a purely statistical point of view, the 10-trading-day column is not significant. However, the change here is big enough to soon also make a difference in the 30-trading-day column. We will wait and see.
While at the moment the general stock market is not a key short-term factor influencing PM prices, the USD Index still does. The correlation between USD Index and the HUI Index is strong (and negative). However, the technical picture for the dollar is bearish, so the implications for the PMs are exactly opposite.
USD Index
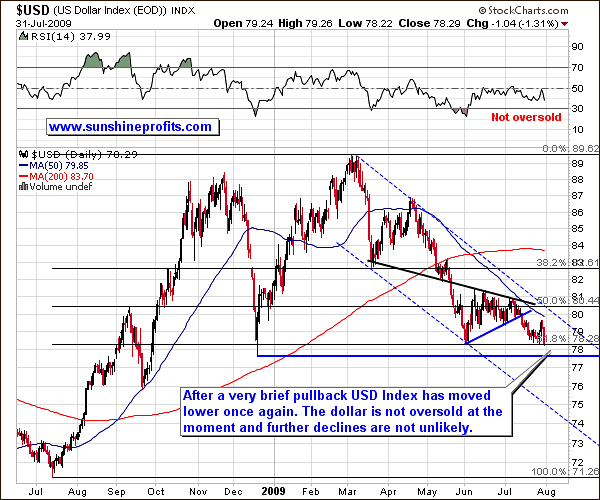
Last week I stated that the move higher is not likely to be large, as small volatility during downswing usually suggest also small volatility during a pullback if one is to materialize.
This is exactly what we saw this week. The USD Index moved temporarily a little higher, but quickly resumed its previous downtrend. For more details we will need to zoom in.
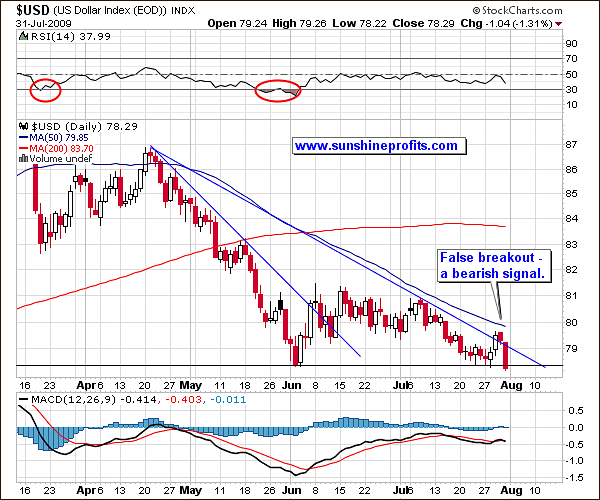
The short-term USD chart reveals that price tried to break through the declining trend line, but failed to hold above it and plunged decisively. It even closed a little below the previous June low, thus making further declines more likely. Of course, the breakdown below the previous lows has not been a dramatic one, but it is a subtle clue that lower prices from here are more likely than higher. Should the value of USD Index close below the black, thin line for two more consecutive days, a sizable move to the downside could follow.
Junior Mining Stocks
As stated in the Key Principles section, the list of top juniors will be updated approximately every 4 weeks, so this is the Update that should contain the revised version of the list.
The tables below feature our favorite junior stocks at the moment of writing these words. For more information on how you can use these lists please refer to the Key Principles section, especially to the part dedicated to juniors.
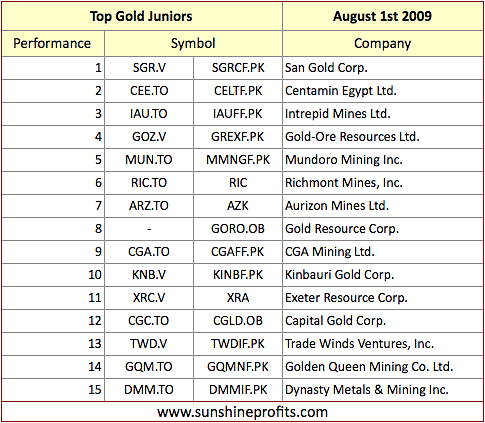
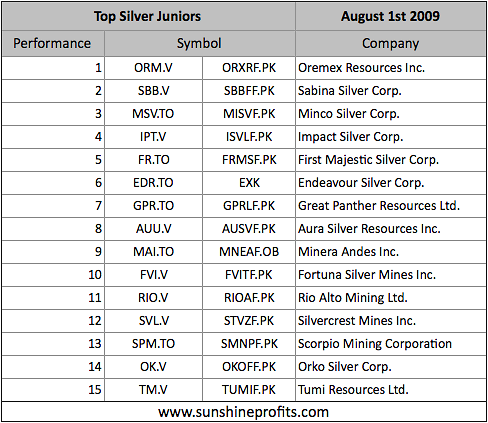
Please note that the company that topped the gold junior list last month - San Gold Corporation (SGR.V) - is still on the #1 place, and it has recently moved much higher (over 24% in the last 3 days), thus visibly increasing profits of those who constructed their junior portfolio based on our ranking. Although the move has been significant, and prices may consolidate for a few days, this company still appears as a good bet from the long-term point of view.
Summary
This week we have seen precious metals dip sharply, but briefly. Since the precious metals sector has moved higher rather rapidly in the middle of the previous month, such a correction is a healthy development and increases the probability of further gains. The existence of the bull market in gold is confirmed by the appropriate action in volume.
As far as short term is concerned, we have just seen strength in PMs and in corresponding equities, which indicates that more gains are likely in the not-too-distant future. Additionally, mining stocks appear to have formed a reverse head-and-shoulders pattern, which also has bullish implications. The technical picture for the general stock market is bearish, but lately precious metals have been reluctant to follow most stocks. If one is to pick a market that was the key driver for PM prices, it's the U.S. Dollar, which now appears to be breaking below its previous lows - another bullish factor for gold and silver investors.
This completes this week's Premium Update.
Thank you for using the Premium Service. Have a great weekend and a profitable week!
Sincerely,
Przemyslaw Radomski


