The story of gold is as rich, lustrous and complex as the metal itself. It is as ancient as the Egyptian Pharos and modern as the mirrors coated with gold which astronomers use to capture images of the universe. The metal's mounting value is connected directly to its economic role as a stable alternative to paper currencies, and its rise should speak volume about the health of the global monetary system.
John Maynard Keynes, the economic guru of many of today’s economists, called gold a “barbaric relic.” Lenin went even further. He suggested an ingenious way to demonetize gold. Under Communism gold would be used to plate the inner surfaces of public urinals. Lenin of course, had the means of preventing the people for making off with the urinals. He had the secret police. But neither Keynes nor Lenin has proven to be right. In fact, the way it’s going, it looks like it is paper money that is going to the toilet.
This week we have collected for you some off the wall, unusual and even bizarre anecdotes about gold that show you that some things never change.
History is replete with famines, but have you ever heard about the Great Bullion Famine? It seems to have implications to today’s economic situation.
During the years 1370-1420, various major mines around Europe become completely exhausted and gold and silver mining declined. Another big problem facing the West at that time was a trade deficit with China and India (sounds familiar?). Exotic luxuries such as spices, silks, and cotton were highly prized in Europe, but European products such as wool from England were not valued in the east. But what was valued then, as now, in the east was gold and silver and those sent to the east in payment for goods never to return in payment for exported European goods. Mints closed down all across Europe because of the lack of bullion. Gold coins gradually disappeared from circulation due to hoarding and the market was invaded by debased "black money", and the public turned increasingly to surrogate currencies and to simple barter.
The scarcity of bullion was one of the triggers of the Age of Discovery as Portuguese explorers sailed down the African coast to open new routes to sub-Saharan gold. Christopher Columbus in the diary of his first voyage mentions gold 65 times. After the discovery of silver in Latin America the bullion famine ended. But the Spanish monarchy had to learn the hard way that too much of a good thing can be a curse. They had dug up so much silver that the metal itself dramatically declined in value. What they failed to understand is that the value of precious metals is not absolute. Money, just like about everything else, is only worth what someone else is willing to give you for it. An increase of the supply, or today we call monetary expansion or quantitative easing, will merely make prices higher, or what today we call “inflation.”
So from the Great Bull Famine came a period called the “Price Revolution” which affected all of Europe from the 1540s for about 100 years. The cost of food rose dramatically. Rising food costs is also something that we are seeing today.
Niall Ferguson, in his book The Ascent of Money, wrote that when an American exchanges his goods or his labor for a fistful of dollars he is essentially trusting … Ben Bernanke not to repeat Spain’s error and manufacture so many of these things that they end up being worth no more than the paper they are printed on.
If we go much further back to a more significant document than Columbus’s diary, the Bible, gold is mentioned 417 times according to Answers.com. It makes its first appearance in Genesis 2:11 in the Garden of Eden story describing the first of the four rivers that flowed through the Garden. “The name of the first is the Pishon. It is the one that flowed around the whole land of Havilah, where there is gold.” Moses used gold beaten into plates and sheets for the construction of the Tabernacle, as described in Exodus. Later, in Kings I, 10:16, David set aside 100,000 talents of gold to build the Temple in Jerusalem.
How much is 100,000 talents of gold? Since a talent is considered to be about 75 pounds, in today’s prices that would come to about $150 billion.
His son, King Solomon, did even better. Being the wisest among men, he knew that gold is a good investment. According to Kings I, King Solomon, received in one year an income of 636 talents of gold. That would come to approximately $1billion in today’s values. Not shabby at all. Solomon uses part of his holdings to construct his famed temple, allegedly overlaid with gold.
Here’s story about gold we recently read. It seems that the once glorious Republic of Venice was in decline in 1590 and, as we all know, desperate times call for desperate measures. Why not latch on to an alchemist, Marco Bragadini, who the Venetians had heard had discovered how to make gold. Venetian soldiers were sent to deliver this golden goose to Venice and the Venetian senate ordered scientific tests to verify the power of the alchemist. Bradadini filled a crucible with quicksilver, added a pinch of his secret powder and set it to fire. Soon the quicksilver turned to gold; it was all true. Bragadini informed the senate he could produce six million ducats or whatever they would require. The months wore on but production was meager. Sensing a growing impatience with his operations Bragadini fled. He was caught and the Pope, who considered him a spawn of the devil, ordered his execution.
And here are a few numbers that are associated with gold from the World Gold Council website.
- The atomic number of gold is 79, which means there are 79 protons in the nucleus of every atom of gold.
- The total number of tons of gold mined since the beginning of civilization is 165,000, which would fit into a crate of 20.4 meter on a side (about 8500 cubic meters). More than 90 percent of that has been mined since the California Gold Rush.
- The number of grams in a troy ounce of gold is 31.103
- The percentage of gold mined today to be used as jewelry is 60 %.
- The percentage increase in the price of gold from Dec 2000 to October 2010 is 394.
- The number of times gold has reached a new high in 2010 is 35.
To see if gold might reach some new highs soon, let’s turn to the technical portion of the Premium Update and begin with analysis of the Euro Index. We will start with the long-term chart (charts courtesy by http://stockcharts.com.)
Euro - USD Indices
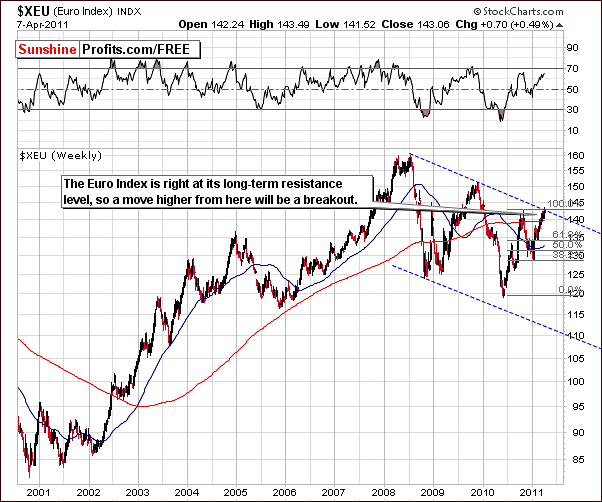
In the very long-term Euro Index chart this week, little change has been seen as index levels are right at the dotted blue long-term resistance line. In the coming days, we will likely see some price action which could reveal much about where the next trend will likely lead. This will, of course, be closely tied in an opposite manner to what happens in the USD Index as well.
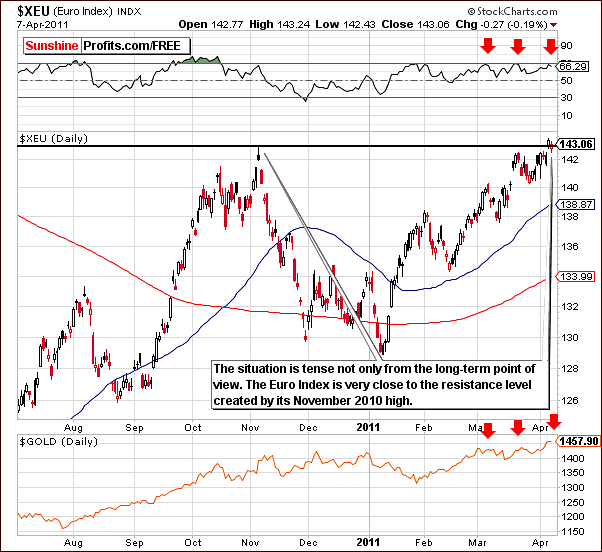
In the short-term Euro Index chart this week, we also see a tense situation. Here we can see that index levels are in the same range as the previous highs that were seen last November.
According to today’s RSI levels, we may be close to a short-term top here and this would be a negative factor for gold. For several weeks, local tops in the Euro Index have coincided with those for gold as well. Now, with gold breaking out to new highs and the Euro Index not yet doing so, we have a somewhat negative situation, contrary to our bullish sentiment for the yellow metal.
It is possible at this time that gold could be leading the Euro Index higher. This theory will likely be supported or refuted in the coming days. For now, we view the situation with respect to the euro as mixed.
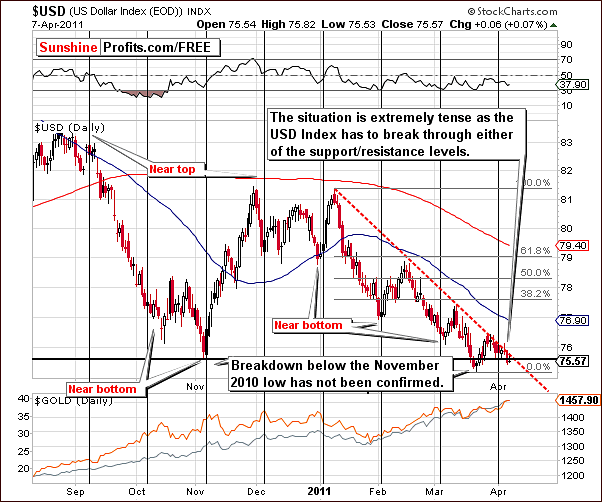
In the long-term USD Index chart, we also see a mixed situation which is somewhat tense. Index levels are close to a cyclical turning point and this could very well materialize into a bigger move quite soon.
The trading range between the declining resistance line and the support line below has pretty much disappeared. The two lines will intersect soon and a move in one direction or another is inevitable once this is seen.
Analysis of gold suggests that perhaps a downward move could be seen in the USD Index. However, if this fails and the USD Index rallies from here, gold prices could decline. At this time, this is the biggest risk factor for investments in gold.
Summing up, once again we have much uncertainty in the currency markets. A decisive move in either the Euro Index or the USD Index will likely have the opposite effect on the other. Should the dollar decline, the situation will likely be even more bullish for gold and conversely a rising US dollar could result in falling gold prices.
General Stock Market
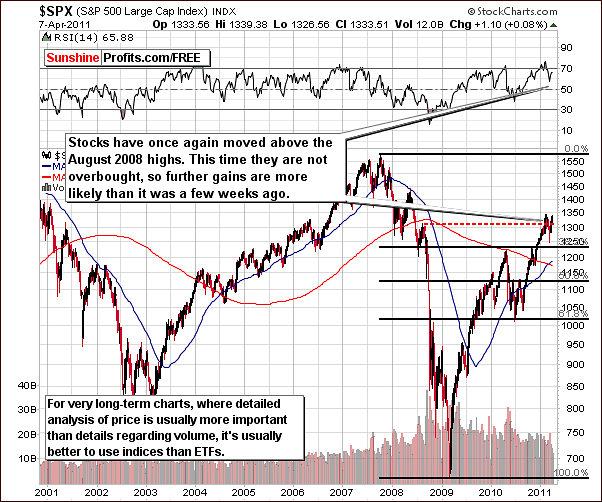
In the very long-term general stock market chart this week, the news remains quite positive. Stock prices have remained above the August 2008 highs and the short-term RSI level no longer reflects an overbought situation. However, it must be remembered that the 2011 highs have not generally been taken out by the broad market on the whole and this could be a concern to some degree.
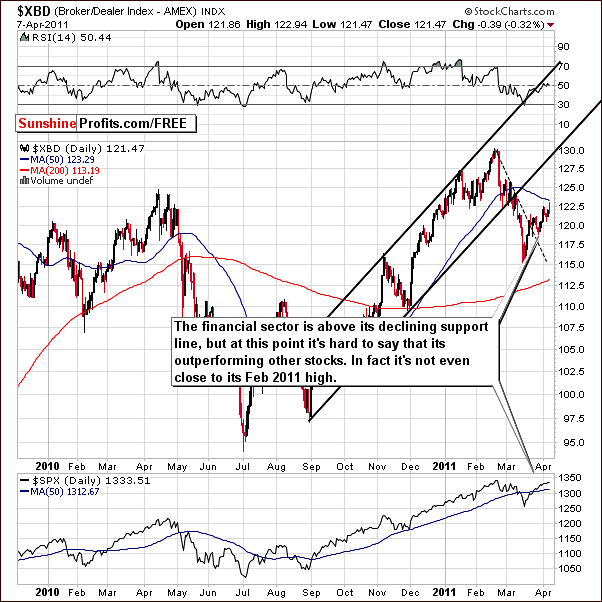
In the Broker/Dealer Index chart this week, we remain concerned because the financials are not leading the general stock market as is usually the case with bigger moves. However, even though the financials have been lagging, the main trend for stocks in general still appears to be up.
A couple of expressions come to mind here: “The trend is your friend” and "generally trends continue until they are no more". There is no proof of a top and the trend remains up.
Summing up, the general stock market continues to show strength although not supported by the financials. With stocks no longer showing an RSI level in the overbought range, it is slightly more likely than not that the current bullish trend will continue from here.
Correlation Matrix
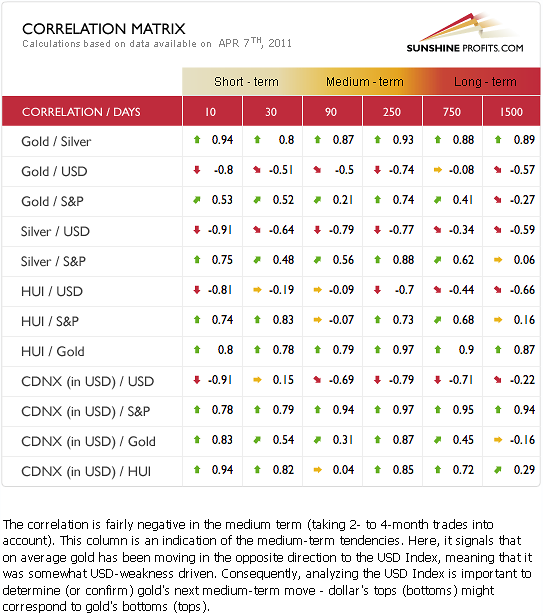
In this week’s Correlation Matrix, we are able to see how the uncertainty in the currency markets is influencing the precious metals.
The situation for gold and silver appears quite positive at this time (as we will explain in the following part of the update), however, the mixed impact from the currency markets continues to be a threat. Namely, the chances for USD Index to rally from here somewhat clouds the situation for gold, silver and gold and silver mining stocks. In the 30-day column, the -0.51 coefficient between gold and USD Index is not all that strong so it seems that we just need to keep an eye on things day-to-day while some of this uncertainty is unraveled.
Generally the outlook from here is bullish for metals, but caution is necessary due to the critical situation in the currency markets.
Gold
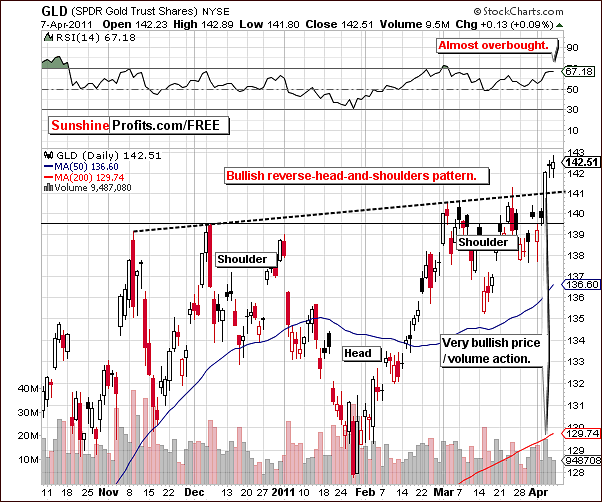
We begin our gold section this week with the short-term chart for the yellow metal since much attention has been focused here this week. Gold has moved to new highs, and this week’s price increase was sizable, clearly visible and accompanied by strong volume.
Although there has been a confirmation in the form of high volume, we didn't felt enough proof has been seen. Therefore we have decided to wait a few more days to see if these price levels will manage to hold and give us more peace of mind (lowering the risk parameter in the risk/reward ratio). Thursday was the third consecutive day above a critical resistance/support line and the recent breakout has been verified by high volume levels. The trend is clearly bullish.
Another bit of bullish news comes from the completion of a reverse head-and-shoulders pattern formation. A further rally (even a $100+ one) from here appears quite possible. Although the RSI levels are nearly overbought and this is somewhat negative, the bullish developments seem strong enough to override this factor. RSI levels alone simply do not seem capable of keeping this rally in check.
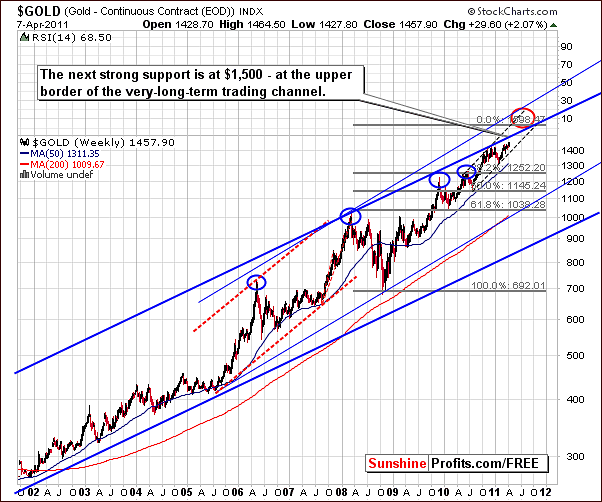
Turning now to the very long-term chart for gold, we also see some interesting developments here. First of all, we see what we’ve seen previously – that the main target for the rally is at/above $1,600. This target will become likely once gold takes out the closest resistance line at $1,500. For now, $1,500 is our short-term target that we believe will be reached quite soon.
The bullish scenario is confirmed also by several other charts.
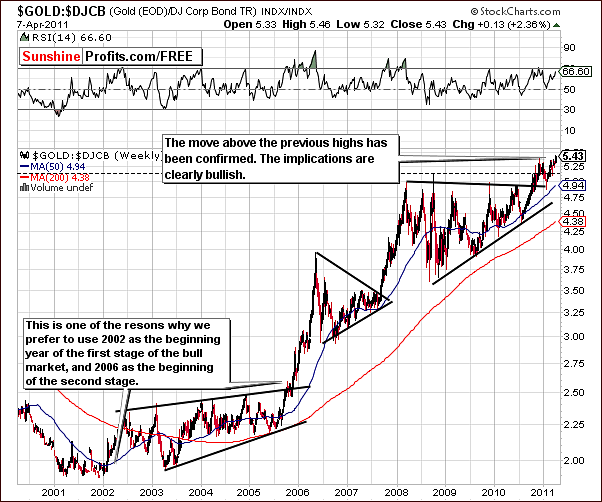
In this week’s Gold:Bonds ratio chart, we see that the move above previous highs has been confirmed and the trend is clearly bullish.
This breakout does not bode well for the bonds market. This seems somewhat consistent with Warren Buffett’s recent comments that he does not like short-term, long-term nor medium-term bonds.
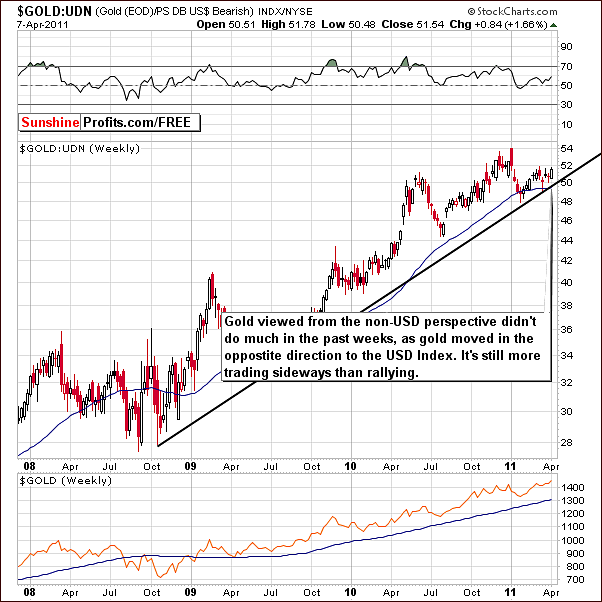
In looking at this week’s Gold from a non-USD perspective chart, we see that the rally is still not very big. Index levels are clearly above the support line and it appears that a considerable rally perhaps to the 54 level or even higher could be in the works very soon.
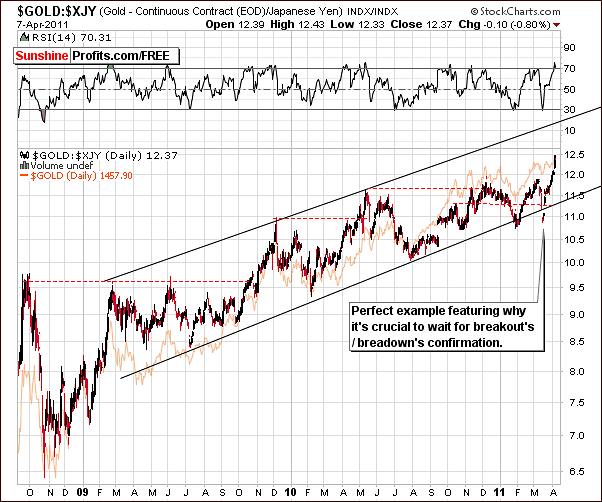
Looking at the chart for gold in terms of the Japanese yen this week, the most important point we wish to make is in regards to waiting for confirmations of breakouts and breakdowns.
Recently, this index showed a breakdown below the lower border of the trading channel. Investors who sold without waiting on a confirmation of this move would have lost out since a quick rally was seen prior to a confirmation of the breakdown. In this case, patience was indeed a virtue for those who waited. In fact in the March 18th Premium Update, we wrote that in case of the above chart the “breakdown” should not be viewed as a true bearish sign for gold.
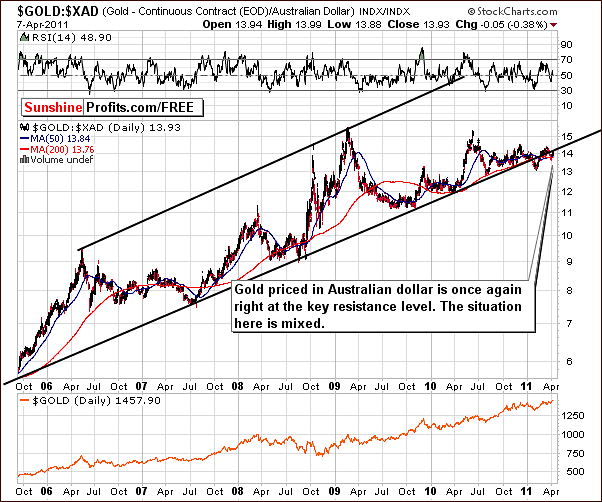
Our final gold chart this week looks at gold from an Australian dollar perspective. Here, we see a move below a key support line and then a move back to this level. So the situation in this chart is mixed, whereas all previous charts appear bullish.
Summing up, based on the general bullish sentiment from nearly all of our gold charts this week, it seems that the time is right for opening speculative long positions in the yellow metal.
Silver
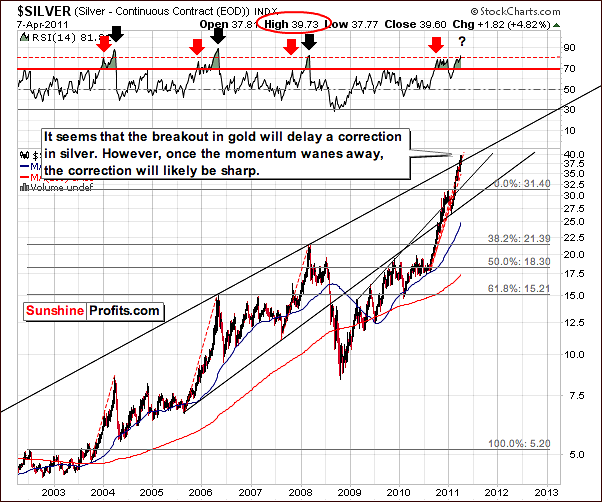
In this week’s very long term chart for silver, we see a breakout above the rising long-term resistance line and this is a positive factor. The situation at this point, however, remains tense for several reasons.
The recent rally can be compared only to the rally of 2005-2006. At that time, the percentage rise was actually a bit higher which leaves open the possibility that this 2011 rally may continue a bit more. In fact, if a bigger rally is seen, then the 2010-2011 silver upswing would actually outperform the rally from 5 years ago. Consequently, it will set a new record in terms of percentage gains for a single rally.
The RSI levels and the size of the current rally suggest that a correction may be seen fairly soon. Furthermore, this correction is likely to be quite sharp. Investors should continue to monitor this situation closely and be prepared to exit the market once it turns unfavorable. We will keep you informed.
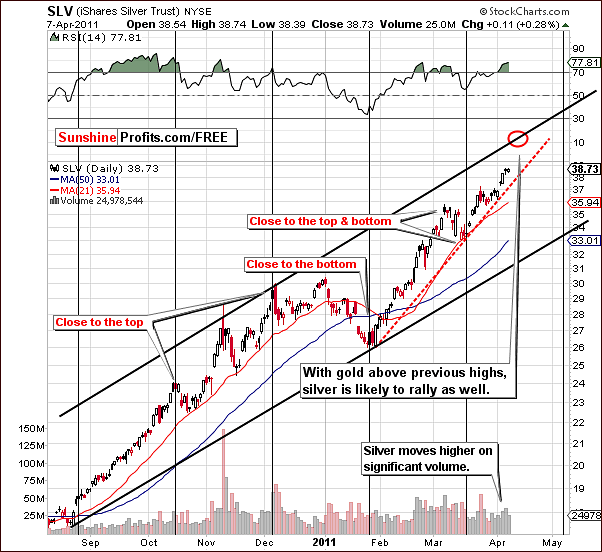
In this week’s short-term chart for the white metal, we can see that silver has moved to new highs much the same way as gold has. Target levels for the SLV ETF, which are marked in our chart by the red ellipse, are close to $41.50. Silver itself has a target level slightly higher. Please note that silver is likely to top along with gold so it might be a good idea to exit the silver market with one’s speculative capital when gold reaches its own target level.
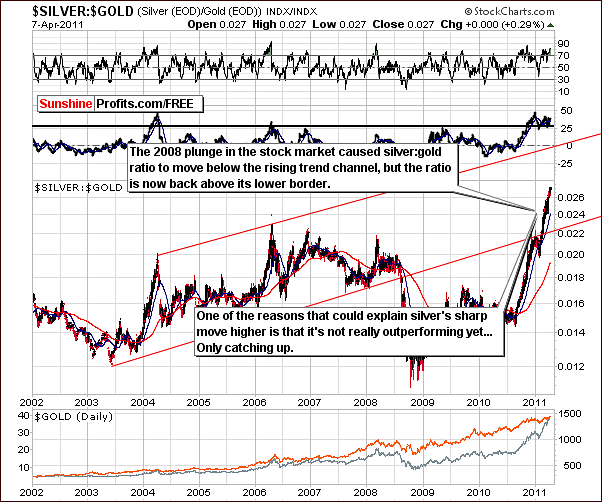
In the Silver:Gold ratio chart this week, we continue to see silver’s superior performance. While silver continues to outperform gold, the silver:gold ratio did not move to its resistance level (upper border of the rising trend channel), so this trend may not reverse for some time.
Once silver:gold ratio gets to this particular level, we will get back to this topic, as it will be likely that a local top will be seen in the whole sector.
Summing up, gold, silver and mining stocks generally reach resistance levels at about the same time. Basically the tops in each market confirm themselves. Silver is likely to surpass the $41 level (and top along with gold – perhaps at $1,500) but could possibly decline significantly thereafter.
This is also in line with the seasonal tendencies of the white metal, a topic we discussed in our Premium Update March 31st 2011. “…an upward trend might occur in the first days of April after which we should be particularly cautious and look for signals of a possible slump. In the second half of the month prices of silver might drift sideways.”
We will monitor the situation closely.
Gold and Silver Mining Stocks
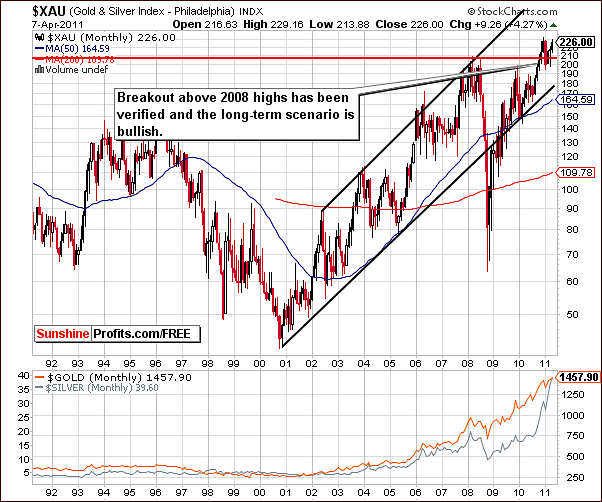
In the XAU (gold and silver mining stocks index) chart, we see that the 2008 highs have been taken out and the breakout has been verified. This is clearly bullish. While it is true that some stocks have moved to new highs and some have not, the overall trend in this very long-term chart is bullish.
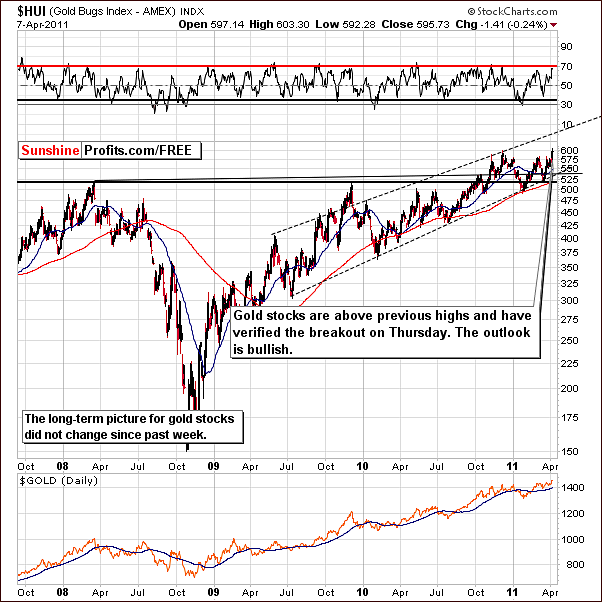
In the HUI Index chart this week, we see that index levels have moved above previous highs. This is a bullish factor since they – like gold – have remained above this level for three consecutive days. Even though the RSI level is close to 70, this does not appear to be an overly bearish sign.
From here, a few days of consolidation followed by a continuation of the rally appears possible. It’s important to note that gold and gold mining stocks have recently moved higher on strong volume, which by itself is a bullish factor, even without taking into account the fact that they moved to new highs.
Speaking of volume, let’s take a look at the GDX ETF, which allows us to analyze it.
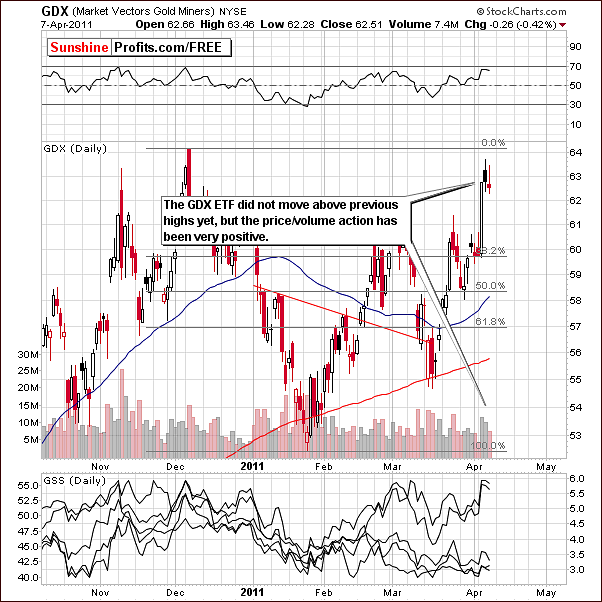
Here, we see that price levels are not above the December, 2010 highs, though they are quite close. Recent price volume action has shown high volume with positive price moves and low volume on consolidating and declining days. This combination is quite positive and bullish for the near term.
Summing up, the overall picture for the whole precious metal sector appears to be bullish at this point in time. Further rallies from here appear quite likely.
Juniors
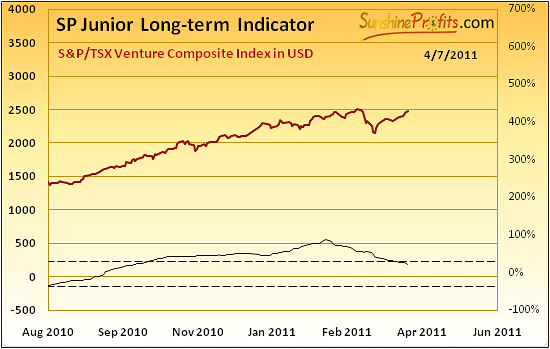
Value of the indicator has been moving below the upper horizontal line. SP Junior Long-term Indicator has been favoring keeping one’s capital in big senior stocks instead of juniors since a few months.
As a reminder the buy signal for juniors is given, when indicator is below lower dashed line and starts to rise (the indicator has been falling for 3 consecutive days and rises on the following day) and the sell signal for juniors (meaning switching to senior mining stocks) is given, when indicator is above higher dashed line and starts to fall (the indicator has been rising for 3 consecutive days and falls on the following day).
We wrote the following in the March 15th, 2011 Market Alert:
In short, we believe that this is a good moment to switch from junior mining stocks to bigger, senior mining companies. Aggressive Traders/Investors may want to cash out of juniors, but this is not what we suggest at this point, as we believe that long-term (!) capital should remain invested in the precious metals market.
What changed? The situation on the general stock market is much more bearish than just a few days ago. Stocks had been overbought for a long time and the correction had to take place sooner or later. Still, the buying power had been strong until recently, when financial stocks started their own decline. The situation has become much worse - technically - and the recent tragedy in Japan served as a catalyst for decline's acceleration.
As we have mentioned many times in the past, the general stock market is more correlated with the junior sector than it is with big senior gold and silver producers. This is why the proper response to the current situation on the general stock market is moving at least a part of your capital that is currently invested in juniors, to seniors. This way, the current decline in stocks will likely affect your portfolio in a less meaningful way.
Naturally, you may verify the above yourself by going to the Tools section on our website, selecting Correlation Matrix, and putting your mouse cursor over the CDNX / S&P (stocks and juniors) and HUI / S&P (stocks and seniors) rows.
Let’s take a look how juniors performed relative to seniors.
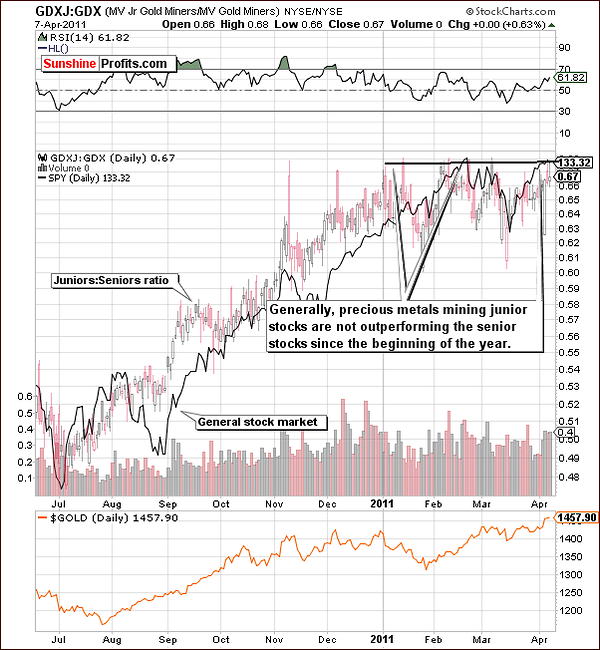
Actually, they did not do much since we’ve seen the signal from our indicator, so it seems that moving from juniors to seniors was not a bad idea, as the risk associated with juniors is much bigger.
Once we get a green light from the stock market (the latter rallies) and we see a breakout in the junior:senior ratio, then it might be a good idea to get back into the junior sector with most of one’s long-term capital. For now, the senior stocks are still preferred.
Nonetheless, let's take a look at this month's junior lists.
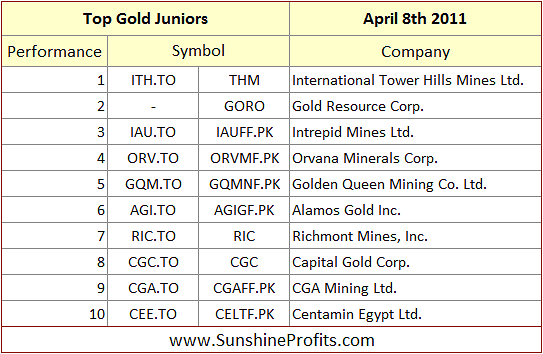
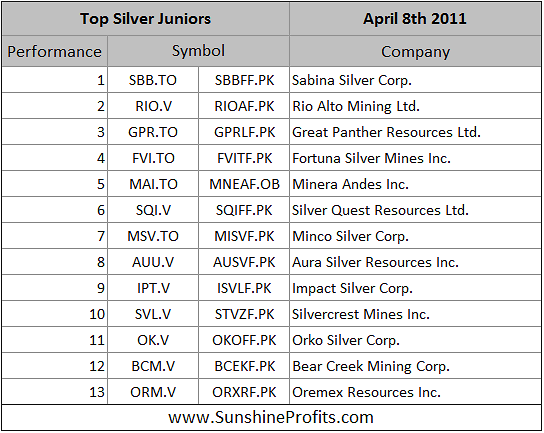
As you’ve noted the biggest change is that we’ve removed First Majestic Silver Corp. and Endeavour Silver Corp. from our silver junior top list. Before taking any action please note that we have not done being dissatisfied with company’s performance. Conversely, both companies were very successful and have grown significantly. We removed them from our list precisely because of that – they are no longer small junior companies. We believe that both companies are a good proxy for silver prices at this time, so we don’t think that you need to sell them, especially that seniors stocks are currently preferred to juniors.
Letters from Subscribers
We would like to begin this week with questions that many Subscribers keep asking.
With the end of QE2 approaching are the markets likely to descend into turmoil? Here are several follow-up questions that come to mind
- Is a steep stock market decline inevitable?
- Who will buy T-Bonds in the absence of QE2 buy-backs and potential Japanese selling?
- Will a collapsing bond market, and inevitable interest rate hikes, help or hurt precious metals?
- How will the 600 Trillion Dollar derivatives market react to this?
- What impact are hedge funds and their derivatives likely to have on precious metals as they react to the end of QE 2, market declines, T-Bond failures and rising interest rates?
- How will the government fund its deficit spending without QE?
- (… ) all precious metals investors wondering if paper dollars might not be the place to be when this mess begins to play out(...) The bottom line question is … what is the best strategy to survive this approaching wall of pain?
Regarding the first question - a steep stock decline is not inevitable. It does not necessarily have to happen. We can see stocks move higher. However, the real question here is whether stocks will keep up with the real (hyper)inflation in the case of financial crisis. It seems that at some point inflation will cause significant problems for US companies that will ultimately translate into lower real (adjusted for inflation) values of stocks. Additionally, relative to precious metals, stocks are likely to underperform heavily in such scenario.
Regarding the other questions - there are too many factors that could influence the final outcome of this epic financial mess for us to predict a detailed way for it to play out. There are plenty of variables that we know and many more that only those in power know of (and many that even they don’t realize). So, instead of trying to guesstimate each individual outcome of thousands of unknown scenarios, we will concur with Nassim Taleb that some things are unpredictable and should be dealt with as such. This means being realistic. However blunt it may appear - the summary is that the situation is going to get very ugly. When a situation turns this way, you will be very happy that you had gold and silver all along.
Practical implications in our point of view - make sure that you own physical gold & silver. Use most of your capital for long-term investments, and use only a part for speculative purposes. You will find more information on this subject in the Key Rules section on our website.
Still, in our opinion the budget will be financed, and most likely it's already been settled a long time ago, and all the "no more spending talks" are just to convince people that they do not want to print the problems away. This would make their job harder as it would raise inflation expectations. So, if it is the case that the Fed had already agreed on additional money supply, then it would make no sense for them to say it straight at this time. Instead, they are trying to convince people how strict they are about the budged, and then finally agree for more spending "just this last time". It will be interesting to read the "explanation" that they come up with this time.
Another question we have received this week was from a reader who found an alarming message on the Internet from an analyst.
He considers $40.00 is a significant 'target' number for silver and when silver hits it (not far to go) it will reverse 10 to 15% taking silver mining stocks with it. He doesn't see this happening to gold - it would just change the Gold/Silver ratio on a temporary basis. He's advised his subscribers not to initiate new positions and install stop losses as insurance.
Does he have a valid point in your view? Would appreciate your opinion, which I value highly.
Unfortunately, we cannot comment because we don't know the reasoning behind this statement. One thing that would confirm this theory is the True Seasonal influence this month. Additional factor that could cause such an action would be a top in stocks. Stocks are currently at the previous high, but that does not imply that they have to decline from here.
If you'd like us to comment in more details on something, then we would require more details - not necessarily suggestions of particular analysts, but more importantly, the reasoning behind them.
One of our Subscribers wanted to know more about True Seasonals.
"It's hard to make a choice here. Two opposite bits of advice in two days. I researched the historic gold chart for 06 and 08. In 06 gold topped on may12. It went up for all April except down $10 for one day on April17. I didn't see a big seasonal dip in 08 either in April or May. In 07 gold reached a high in Mid-April. So we are going to be much lower by April13 based on?"
True Seasonals is an average of many years. It does not mean that the price of gold acted the same way on a particular year every year in the past. To read more about True Seasonals please take a look at our February 10th, 2011 Premium Update and February 18th, 2011 Premium Update.
Here is another question we received this week.
I was pleased to read your report as usual. I wondered if you would lay out for Subscribers key things to apply/look out for when making a decision to go short or long. Also, why not provide signals for SPX,COMPQ, INDU as you are already analyzing the general stock market. I would certainly have appreciated buying into this recent rally.
Once again thanks. Whilst we are not long gold or gold miners we are not long anything.
Look forward to your response and new website.
Our analyses of the general stock market and USD Index are indeed done thoroughly (actually, we analyze more charts than we cover in our reports), but we specialize in precious metals. Before sending an alert we must analyze other markets that might influence it. In order to provide signals for other markets - e.g. stocks / currencies, we would need to dig deep into the specifics of each of these markets as we believe that in most cases it's not possible (and ethically correct) to suggest opening a position based on one chart alone. That's why we focus on a wide range of factors and additionally take time to develop new charts and tools. Therefore, we believe it is optimal to tell you what we think about each market on a weekly basis (note the "Summing up" paragraphs that end each section), but we provide direct trading/investment suggestions for precious metals only.
Finally, we would like to answer a basic question that new Subscribers might find beneficial . A Subscriber asked us to explain the following terms and the differences between them: long position, short position, long-term and short-term position.
Short-term position = speculative position. It is something for which you use your speculative (trading) capital. You use only a part of this capital for each trade and your goal is to profit on the short-term price swings. Generally, in most cases, you should not put most of your capital for speculative purposes.
Long-term position, long-term investment = investment position. That's the part of you capital that you use to buy and almost never sell. The goal is to gain money on the long-term appreciation of the capital. This is mostly a bet on the positive fundamental situation - in this case on the precious metals market. Here, the risk to be out of the market, so it makes sense to sell one's holdings only during the most unfavorable market conditions.
Short position = bet on lower prices - generally it regards speculative capital.
Long position = bet on higher prices. Going long gold means buying gold.
Additionally, we would like to invite our new Subscribers to the Key Rules section where you will be able to find out more about short, long, short-term and long-term positions.
Summary
The situation for the US Dollar is extremely tense. Index levels are right at a crossroads and one route must be taken very soon. The direction taken could have a significant impact on the precious metals markets.
The general stock market appears likely to be moving higher although some bearish factors are present. The lack of support in the financial sector appears to be outweighed by the fact that RSI levels are not in the overbought range any longer and that the trend is up.
Gold and silver are somewhat correlated with currencies and stocks but to a reasonable extent they have been moving on their own. Still, several risk factors are present for the short term and we will continue to monitor these and report to you accordingly.
Based on gold, silver and mining stocks alone, a rally from here appears to be in the cards. Gold has broken out, the move has been confirmed, and is likely to lead the other precious metals higher.
Speculative capital may be used to bet on this outcome at this time. The risk/reward ratio appears favorable for entering speculative positions today. In other words, we're suggesting opening speculative long positions in the precious metals sector.
Our next Premium Update is scheduled for Friday, April 15, 2011.
This completes this week's Premium Update.
Thank you for using the Premium Service. Have a great weekend and profitable week!
Sincerely,
Przemyslaw Radomski


