
In the last Premium Update we talked about gold's role as a safe haven in times of crisis. What about gold reputation as a hedge against inflation? Is it well deserved?
The no-brainer approach to this question is to compare the performance of the gold price during years of high inflation with its performance in moderate and low inflation periods.
Between 1974 and 2008, there were 8 years where US inflation was high (defined as CPI inflation exceeding 5%.) There were 21 years where US inflation was moderate (between 2% and 4.9%.) There were 6 years where inflation was low (below 2%). During the low and moderate inflation years gold posted only mildly positive real returns. In the high inflation years gold rose by an average of 14.9% in real terms.
Keep in mind that ten years ago $1,000 bought nearly four ounces of gold. Today $1,000 won't even get you a single ounce. That works out of a 78 percent fall in the value of the dollar in the past decade.
Another way of illustrating the point of gold's constant value throughout time is through the following analogy: It is said that throughout history an ounce of gold could always buy a reasonable (not luxurious) outfit of clothes. This held true in the fourteenth century, when an ounce of gold was about £1.33. It maintained its value in the late 18th century when an ounce of gold was around £4.25 or $19. Nowadays, an ounce of gold hovering at $1,220 can certainly buy a very decent men's suit, (even a designer suit on sale.) In contrast, neither £1.33 nor £4.25 would go very far in your local shopping mall. At best you could hope for a cup of coffee and a doughnut.
Yet another way to look at it is to compare an ounce of gold to one share of Google (NASDAQ: GOOG). On November 30, 2005, Rick Munarriz of The Motley Fool newsletter asked the question, which represented a better 10-year investment: a share of Google, the leading search engine, or an ounce of good-old-fashioned gold. The comparison between these two divergent investments captured the imagination of many in the investment community and every once in a while you hear it mentioned. Munarriz bet that Google would trounce gold.
At the time he wrote the column, a share of Google's stock was $405 and an ounce of gold was one day from breaking the $500 barrier, which it did December 1. Three years later, on January 4, 2008, an ounce of gold outpaced the share price of Google by 30.77%, with gold closing at $859.19 per ounce and a share of Google closing at $657 on U.S. market exchanges. Twenty days later the gold price broke the $900 mark per ounce for the first time. The price of gold topped $1,000 an ounce for the first time ever on March 13, 2008 amid U.S. recession fears. Google closed 2008 at $307.65 while gold closed the year at $866. In 2009 Munarriz had to eat his words. On September 23, he noted that Google traded above the $500 mark, for the first time in 13 months but that the search engine company wasn't the only one to revisit a significant mile marker. An ounce of gold topped the $1,000 mark for the first time in 18 months-double the price of a share of Google.
"The dueling milestones brought me back to one of my more regrettable remarks. When both Google and gold were barreling toward the $500 mark four years ago, I chose paid search over precious metal," he admitted.
To be fair, Munarriz made the wager a ten-year race and he still has five years to go. At the time this Premium Update was prepared, the price of a share of Google stock was $487 and an ounce of gold $1,220.
Investors in gold can point to a growing body of research supporting gold's reputation as a protector of wealth against the ravages of inflation. Market cycles come and go, but extensive research from a range of economists has demonstrated that, over the long term, through both inflationary and deflationary periods, gold has consistently maintained its purchasing power.
This point was perhaps best brought home by Roy Jastram in his seminal book The Golden Constant, originally published in 1977. Jastram, then professor of Business Administration at the University of California at Berkeley, found that over the centuries and in different countries gold's purchasing power, while fluctuating, had returned to a broadly constant level. A new, updated edition of the book was published in June 2009.
According to the book, experience since the price of gold was freed in 1971 when it was de-linked from the dollar, supports the notion of gold as a hedge against inflation. During the 1970s, a time of high inflation and two oil price shocks, gold price rose rapidly, outstripping the rate of inflation.
During a time of "great moderation" in the 1980s and 1990s - with no inflation in sight and a generally improving economy, mostly strong stock markets and the fall of communism - gold's purchasing power fell.
In the current decade, in which government spending and various bail out plans have awakened fears of inflation and growing concern over global imbalances, the purchasing power of gold has risen again.
Gold's enduring ability to hold its real value over time and throughout all sorts of circumstances is the main conclusion of the book. It proved itself a safe haven through some of the darkest times of the 20th century. Its ability to hold its value, or even to appreciate in times of stress, was not just true of the extreme crises - invasion, occupation, extreme hyperinflation - but also during "lesser" crises.
The truth is that as long as paper currencies around the world continue to show instability, gold will continue to be a preferred choice for a safe haven. Nations all over the world are looking for ways to diversify their very large foreign exchange reserves. For example, China now has approximately $2 trillion in foreign exchange reserves and has wanted to reduce its position in U.S. dollars for quite some time now.
But where can these investors and nations park their money?
Euro is said to be coming apart and there is a very real fear that Greece is only the first domino to fall (we believe this is as exaggeration at this point and the popularity of this view is one of the things that makes us believe that a bottom in euro is relatively close.)
What about the British pound? The U.K. is facing a massive government debt crisis as well.
How about the Japanese yen? Ironically, there has been a move towards the Japanese yen in recent days, but the truth is that the Japanese debt situation is one of the worst in the world. Japan's gross public debt has reached 201 percent of GDP and Japan's battle with deflation dragged into its 13th straight month in March. Its attraction might therefore be only temporary.
What about the U.S. dollar? The United States has piled up the biggest mountain of debt in the history of the world.
So, what is a safe haven?
How about gold? How about silver?
A German family who held a certain quantity of gold in the closing years of the 19th century would find that that gold would still buy a broadly similar quantity of goods and services today despite hyperinflation in the 1920s and the cataclysm of two World Wars. In contrast a quantity of German currency held at the end of the 19th century would today be completely worthless.
In the short run, experience has shown that gold can deviate from its long-run inflation-hedge price. But when enjoying a sustained buoyant period, as is currently the case, gold can offer opportunities for impressive returns.
To see if impressive returns are in store for us, let's begin this week's technical part with the analysis of the U.S. Dollar. Let's start with the long-term USD Index chart (charts courtesy by http://stockcharts.com.)
USD Index
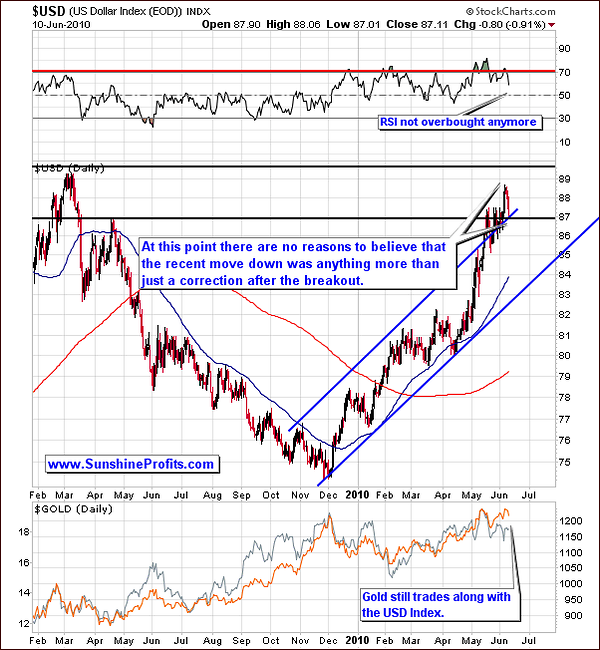
The USD index this week has seen some slight downward movement. Although there is much uncertainly worldwide, we feel this is simply a temporary move for the USD Index and our previous bullish sentiment remains intact. We have seen slightly lower prices for the past 2-3 days; however, the close each day has remained above the previous resistance level. Although the decline has approached the support level of 87, we feel that this is simply a short-term correction. The RSI is not in an overbought range and we feel that a further rise is possible for this index.
As has been the case for some time, gold continues to trade along with the USD Index. The past couple of days have seen slight declines for each and they remain positively correlated. Again, we feel this is simply a short term correction and does not create any bearish sentiment for gold in the short term. We are watching this situation closely and will, as always, issue a Market Alert should major developments occur before our next Premium Update.
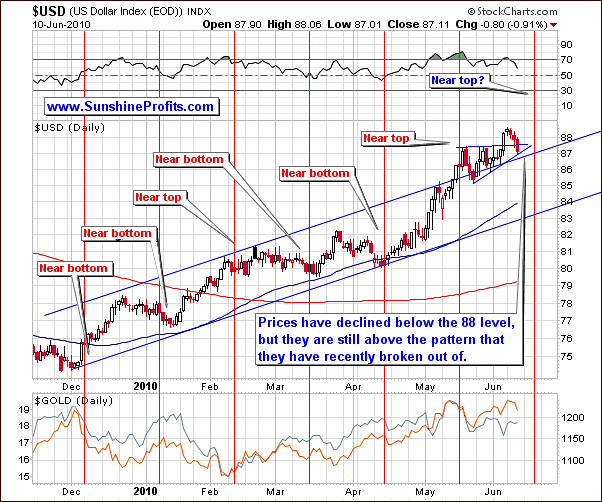
This week's short term chart confirms the points made earlier from the long-term chart. We see closing prices above the previous resistance level after the breakout from the rising wedge pattern (to the upside, which - as a quick reminder - is something that we see rarely). With three consecutive days closing above this level, the breakout has been verified, and we see further verification of the resistance support level. This verification of the breakout is an important factor which heavily influences our sentiment and further clarifies what we can expect in the near-term.
At this point, the slight decline in the USD Index seen in recent days does not appear to be anything to worry about. Multiple signs in this chart indicate that a near-top could be reached within the next week or two, but that it was not reached yet. The recent decline of about 2% is miniscule compared to gains seen previously for the USD Index since the beginning of 2010.
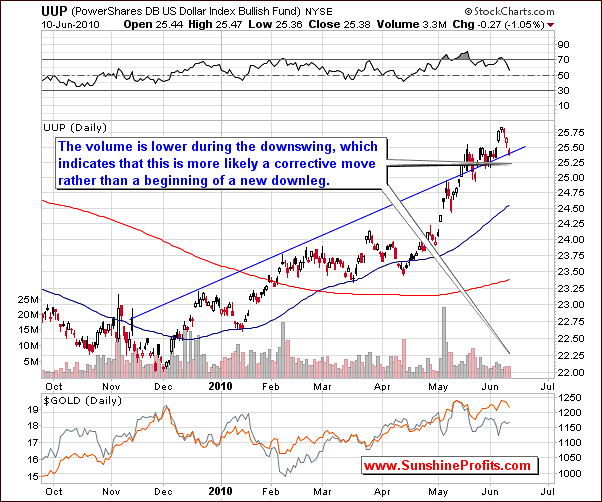
The UUP ETF chart confirms the points we have made earlier by clearly showing volume levels to be quite low. Remember, the implication here is that the recent downward moves are not confirmed. Low volume is an indication of insignificant wavering in the market, bounces and slight contra-trend moves which are short-lived. That is especially significant during upswings, where it signals the lack of buying power rather than any lower price sentiment in the market. Still low volume during a downswing can also be viewed as a non-confirmation. Trends of this type are routinely seen early in consolidation periods and are mostly not an indication of a severe downturn or a prolonged period of decline.
Summing up, the USD index has shown a slight correction following its recent, confirmed breakout. Indications are that we will continue to see higher prices in the near-term. This is bullish news for gold; however, the situation remains mixed for silver and mining stocks at this time. This topic will be discussed in greater detail later in this update.
Euro Index
As we have discussed in recent Premium Updates and Market Alerts, the price of gold has been driven primarily by European demand in recent weeks. For this reason, we feel it is appropriate to have a separate section in our weekly update dedicated to the Euro index.
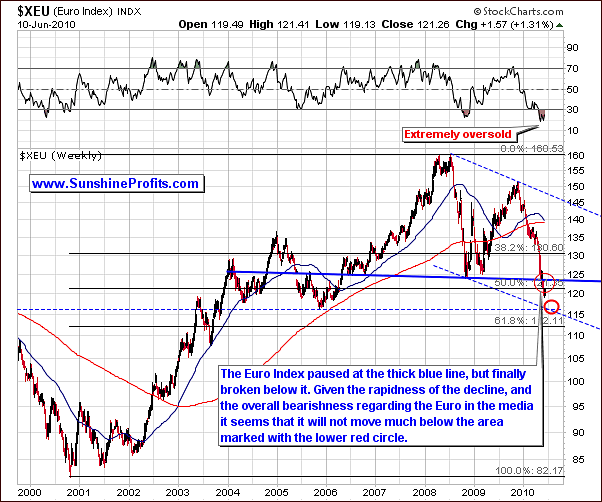
The long-term chart above is unchanged from our June 8 update. Indications continue to point towards the euro moving slightly lower in the next few days before an eventual rally which we believe will begin soon thereafter. This short-term decline will continue to have positive influence on the USD Index as well as maintain upward pressure on the price of gold.
With several news stories a day involving the euro and China, Spain, Greece, etc. it is clear to see how the euro is central to nearly all market movements world-wide. For this reason and many others, Sunshine Profits is always poised and ready to update our Subscribers when the situation warrants.
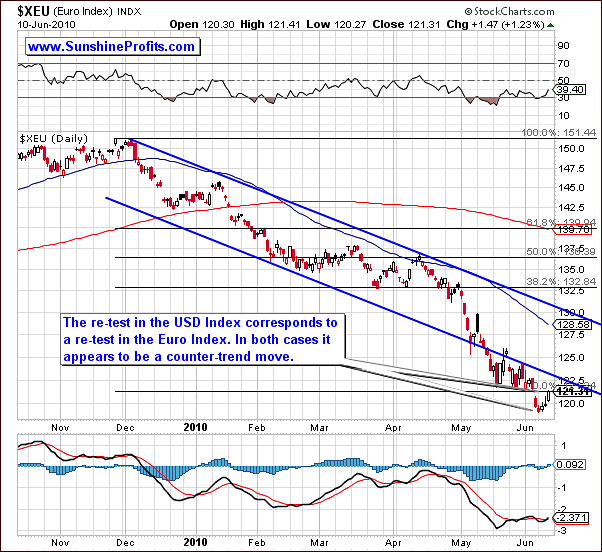
The short-term chart clearly shows how the Euro did move lower and bounce back in the last few days. The fact is that so far the value of the Euro Index did not manage to move above its previous support level, which has not turned into resistance. For this reason, recent upward moves are not viewed as bullish at this time - there are no reasons to believe that this very recent move higher was anything more than just a short-term correction.
Summing up, the Euro Index has had a strong impact on gold recently and we remain bullish for the yellow metal. This is due to the fact that gold's price has recently been driven by European demand. In short, the weaker euro has and will continue to impact gold prices in a positive manner.
We do expect this to change within the next few weeks but are unable to narrow down a more specific timetable at this time. World events and seemingly small steps by any one of a number of countries can delay or expedite events related to the euro without any prior warnings. Such is the case throughout the world financial markets today, all inter-twined and all subject to rapid change. As a Subscriber to our Premium Updates, you can rest assured that we will always have our ear to the news and our fingers to the keys to keep you fully informed in as timely a manner as possible.
General Stock Market
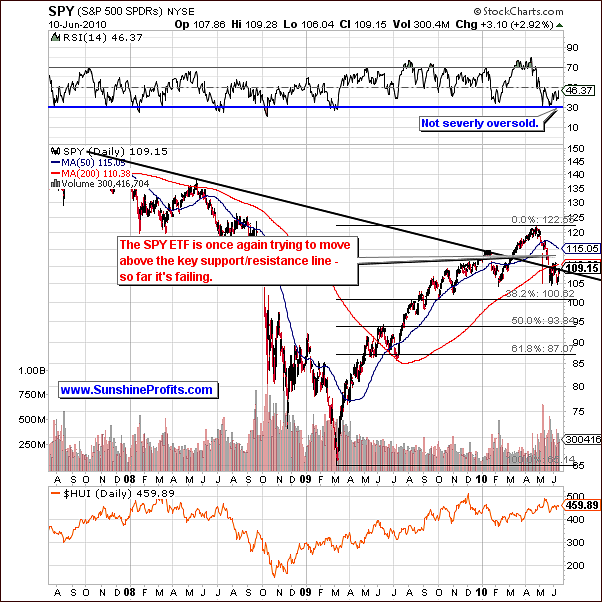
In the general stock market this week, we see little change as measured by the above SPY chart. We see the market moved back to the multi-year resistance level, which is the black line on the above chart. The line has not been breached however, and this leads us to believe the trend is still down. Also, the RSI is not severely oversold at this time, thus making further declines more probable.
We look for some sideways movement or consolidating in the coming days with downward moves more likely than upswings for the near-term.
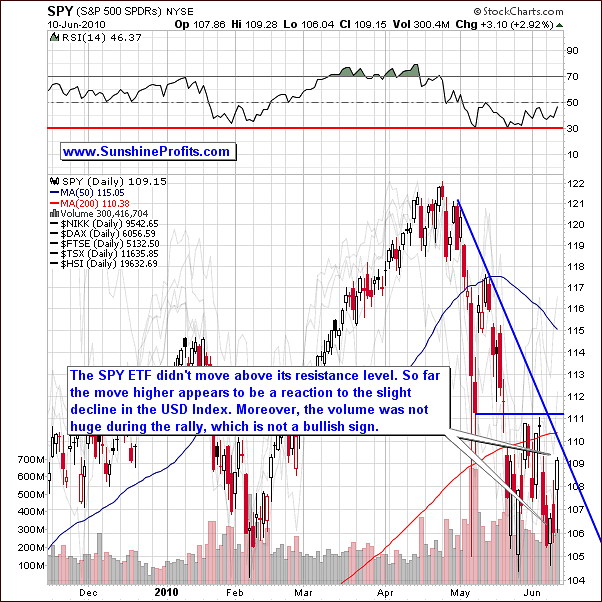
The short-term chart further indicates the weakness of the recent move upward. We have seen this happen before (in the past few weeks) and do not expect any type of rally to take shape as indicated by the absence of any high volume levels and/or without a breakout above the resistance levels: declining blue resistance line, horizontal resistance line at the $111 level, and the 200-day moving average.
Again, so far there is no evidence that we are seeing anything more than a contra-trend correction at this time.
The likely cause for this weak move is the slight decline in the USD Index (weak USD -> lower prices of U.S. goods for non-U.S. consumers -> increased demand for U.S. goods -> increased profits of U.S. companies -> increased share prices -> increased stocks index value). As one would expect, a weak rally normally will not have significant impact potential and this is consistent with our belief that that the result here is simply the onset of a consolidation period.
This may also be due to the uncertainty in the Euro Index, which has yet to begin any sort of rally (probably within the next few weeks). The presence of uncertainty on such a major issue as the euro will surely hold other markets in check, preventing many rallies from even beginning.
This situation may remain in its present holding pattern or decline for a few more weeks.
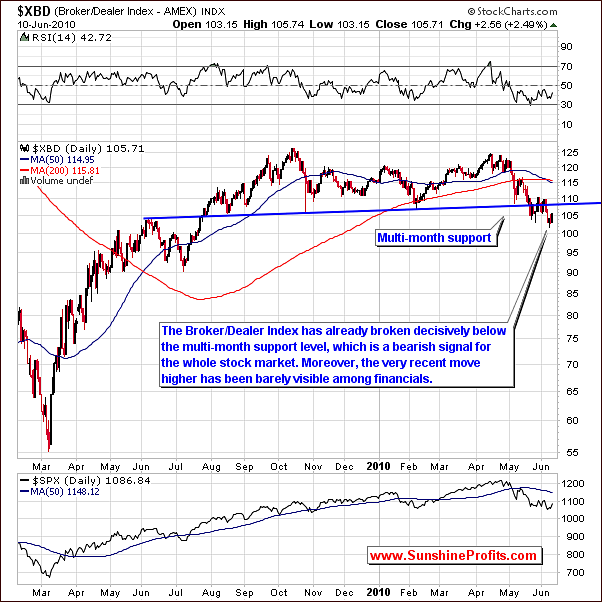
In the financial sector, represented by the Broker-Dealer Index, we see further evidence of weakness in the rally over the last few days. The move higher can barely be seen in the above XBD chart, whereas the decline below the month-to-month support line is clearly visible. In short, we have seen strong declines followed by very small upswings. These are nothing more than routine market bounces which are quite commonly seen throughout the year. There is no suggestion that higher prices are forthcoming. Conversely, small upswings and big declines suggest that sellers are dominating.
Summing up, we expect the general stock market level to continue to move downward based on indicators from the stock market, and also based on the situation in the U.S. Dollar and euro. The true economic situation in the U.S. seems to be a subject for argument in the press by numerous pundits with varying opinions and theories. Should there be any surprise when the world financial markets frequently react with uncertainty? Our analysis shows that there are numerous signals and factors supporting a continued downturn in the short-run.
The strength shown recently by gold will likely keep it from being adversely affected by the downtrend is the general stock market. However, there may be negative impacts on silver and mining stocks. Speaking of the influences on various parts of the precious metals market, let's turn to our correlation matrix for more details.
Correlations
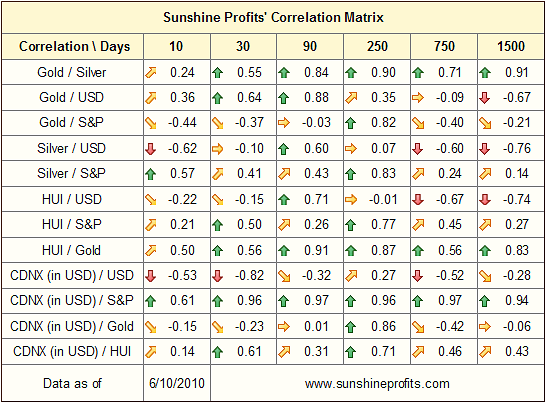
The correlation matrix this week is generally unchanged from our June 8th update. Gold is still highly correlated with the USD, confirming that its price is driven higher by weakness in the euro. We also continue to see a negative correlation between gold and the general stock market, suggesting that gold may hold well, or even rally if stocks decline.
In our previous update, we stated that when the value of the USD increases, then the goods produced in the U.S. are becoming too expensive for foreign buyers and therefore sales of the U.S. companies decrease. Consequently, their share prices decline as well. This is reprinted here to clarify, in a straightforward manner, the relationship between the general stock market and the USD Index.
Silver and mining stocks continue to be rather positively correlated with the general stock market and trade rather independent from the U.S. Dollar.
Summing up, we continue to suggest extreme caution for trades in silver or mining stocks. It does not appear that these markets are the place for speculative capital at this time. Holding gold continues to be preferred over all other precious metals and the mining stocks at this time. However, as will be discussed in later sections of this update, gold may be seeing a local top in the coming weeks, so it is important to watch the movement and volume levels consistently to maximize profits.
Gold
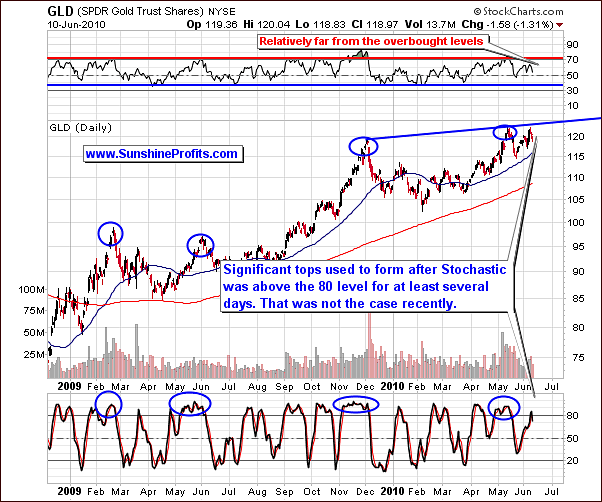
Before speaking specifically about this week's long-term chart, note how the recent local tops for gold coincide with the stochastic indicator above the 80 level. In other words, in the previous 18 months there was no significant top that was not heralded by Stochastic trading visibly above the 80 level. Today we do not see an extended (more than a few days) above the 80 level, which indicates an additional rally period is likely before the top is reached. It seems that the first thing to take place is the Stochastic indicator moving visibly above 80 and the rally then runs out of steam.
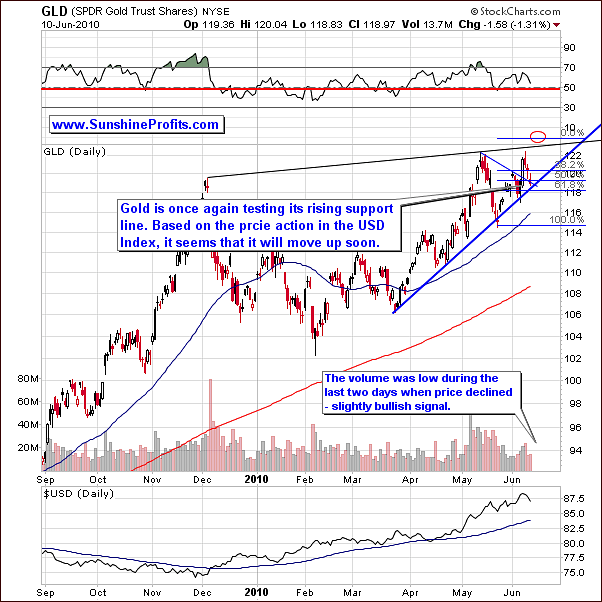
In the short term chart, we see that the RSI is quite close to the buy level. Also, the recent small decline in gold's price has not been confirmed by high volume. As we have frequently informed our Subscribers, take little stock in moves accompanied by low volume levels. When there is a meaningful move in any market, volume levels will support its strength.
For these reasons, we do not have bearish sentiment nor do we expect to see consistent declines in the near term - precisely as it is the case with the USD Index (and also for the same reason - the decline in the USD appears to be just a slight correction at this point). Slight corrections and possible sideways moves may be seen occasionally, but it appears that gold will rally further from where we are today.
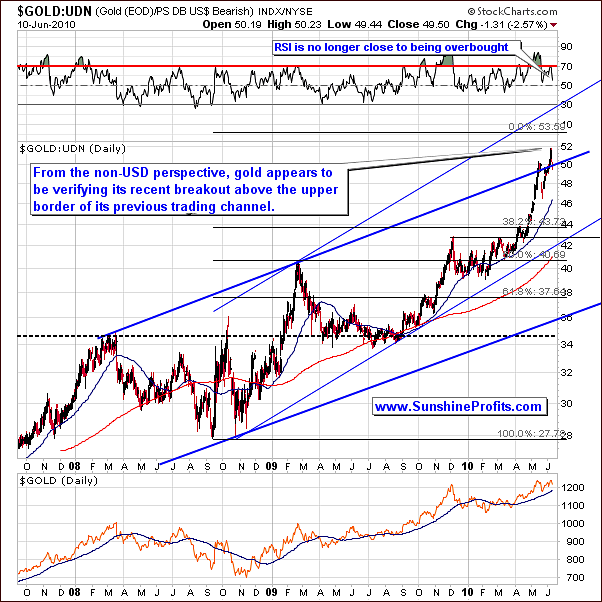
The rising price of gold continues to be driven primarily by European investors and the recent small decline was simply a normal market correction. From the non-USD perspective, the price declines tested the upper border of the previous trading channel, but since this provided resistance it indicates that further declines or any type of significant downturn should not be of concern. Quite simply, the evidence does not give rise to bearish sentiment at this time.
Summing up, when taking into consideration all the primary technical analysis tools, the recent gold rally appears to have some life remaining. The stochastic indictor points to a local top perhaps being imminent, but it is not yet in place. Also, we see that recent small declines have been accompanied by low volume. The continued weakness of the euro (from the medium-term perspective) further validates our bullish sentiment for gold in the near term. For our Subscribers long on gold we recommend holding your positions for further profits. Should the situation change, we will send out a Market Alert.
Silver
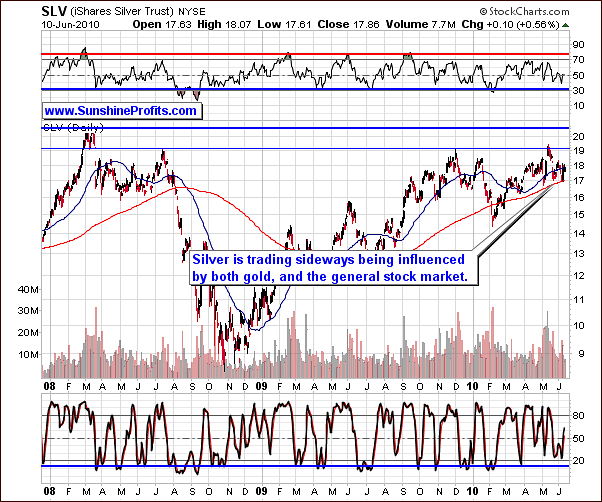
This week's long-term chart for silver shows basic sideways movements in recent days. For this reason, there is little to report other than to remind our Subscribers of points made in recent updates and alerts.
The sideways movement for silver is a result of it being drawn upwards to follow gold and downwards with the trend of the general stock market. This tendency is expected to hold for the near term. In addition, the historical seasonal patterns will continue to influence market sentiment and, consequently, the price of silver. Normally, the white metal declines during the first two weeks of June each year and the low volume seen recently is at least in part due to investor skepticism during this historical poor month for this sector. The same effect can be seen on the gold market but its strength is limited in that case.
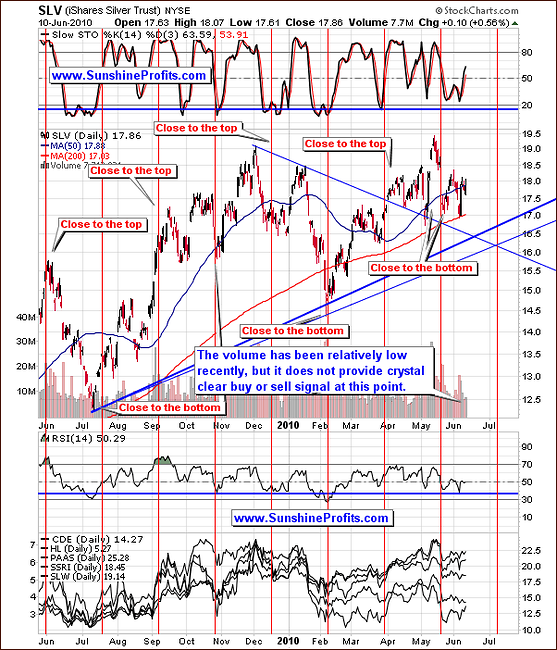
On the short term chart for silver this week, we notice a slight move upward, but all-in-all, the trend has generally been sideways since our last update. The outlook for silver was mixed at that time, and we continue to have a lack of clarity as to where the price of silver will go in the short and medium-term. The low volume seen recently is slightly bearish and is the primary factor contributing to the lack of any real news in this sector.
The buy and sell signals are not clear, but we continue to recommend holding speculative positions in gold as opposed to silver for the near-term. The risk/reward ratio has been and continues to be much more favorable for gold than silver.
Summing up, silver continues to be less exciting as it is being influenced positively and negatively by various markets, causing the overall situation to be unclear. All-in-all, the speculative investor should focus on gold and those long on silver should consider moving to gold to improve their risk/reward ratio.
Precious Metals Stocks
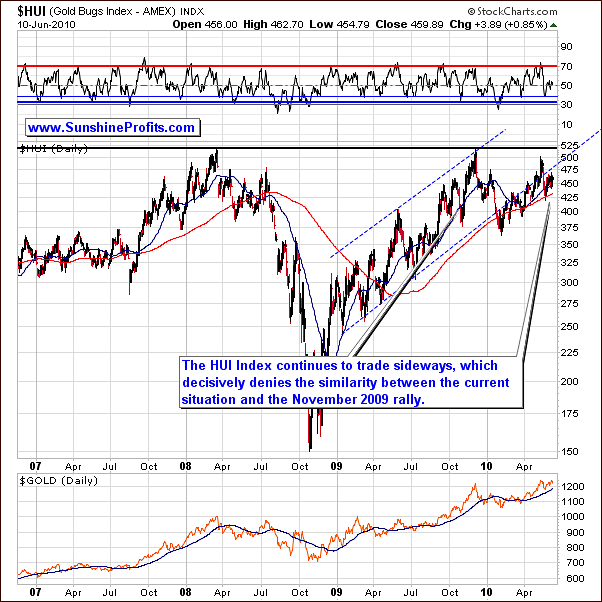
This week's HUI mining stocks chart is basically the same as what we've seen for silver. There has been further sideways movement, visible in the long-term chart above. There are virtually no similarities with recent trends and that which was seen in November 2009 when a strong rally took hold and lasted for several weeks.
For many reasons, which we have repeatedly mentioned in this update as well as in prior weeks, trading in mining stocks is not advised at this time. There is very little clarity as to near term trends and the risk/reward ratio, though difficult to calculate, seems quite unfavorable at this time. Gold continues to be much preferred over the other precious metals today.
There's one more thing that we would like to comment on this week before moving on to the short-term chart analysis. One of the messages that we've received recently included a question about the possibility of existence of the cup-and-handle formation with the cup being formed between Dec 2009 and May 2010. The implications of this would be bullish, because it would mean that we are right now in the "handle" stage, which - when completed - marks a beginning of a strong rally. This situation is even more visible on the short-term GDX ETF chart below.
Generally, we don't consider this to be the cup-and-handle pattern because of two important reasons. First of them is the shape of what would be perceived as "cup". It should be almost ideally U-shaped, and as we see the bottom was quite sharp. The second - and the key one here - is the non-confirmation form the volume. The corresponding volume should also be U-shaped, which means that the bottom of the cup should have been formed on the lowest volume in the Dec 2009 - May 2010 time-frame. The reality is that the bottom took place on huge volume, which is exactly the opposite of what one would expect from the "cup" pattern.
So, the HUI Index chart does not provide us with clear medium-term bullish signals at this point.
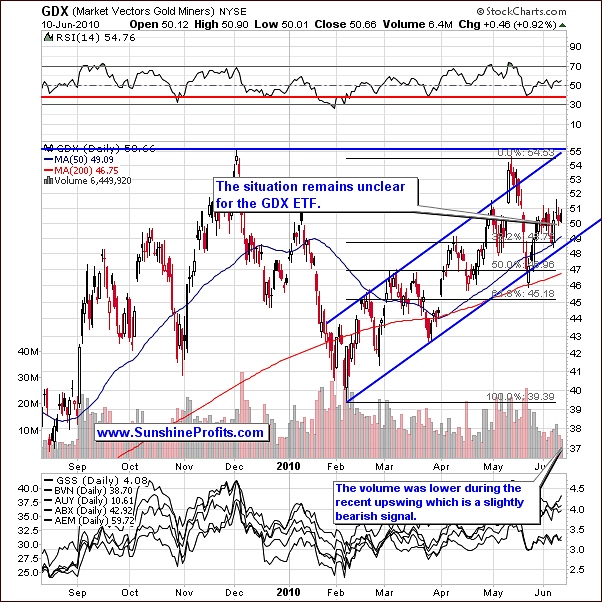
A closer inspection of the above chart shows a slightly higher volume daily decline followed by a lower volume rise on a recent trading day. This is normally a bearish sign but may also simply be attributed to consolidation.
Although a slight increase may be seen for the precious metal sector soon, this will likely be offset by any downward movement in the general stock market. This negative influence could more than negate any minor rally for precious metals. However, when the general stock market bottoms out, the negative correlation of the PM sectors could possibly result in a huge catch up rally for silver and mining stocks. This may mean a smaller decline instead of a bigger rally, but it's too early to say at this point.
At this writing, gold and silver stocks continue to be slightly positively correlated with the general stock market. The situation on the latter is slightly bearish, and at the same time we have bullish signals from gold.
Summing up, due to numerous unclear signals and lack of clarity with respect to the general stock market (slightly bearish sentiment), we must remind our Subscribers that the risk/reward ratio here is far less favorable than it is the case with the gold market. We do not expect this disadvantage to dissipate in the next several days. For this reason, we continue to be bullish on gold and neutral on silver and the precious metals stocks.
Other Charts
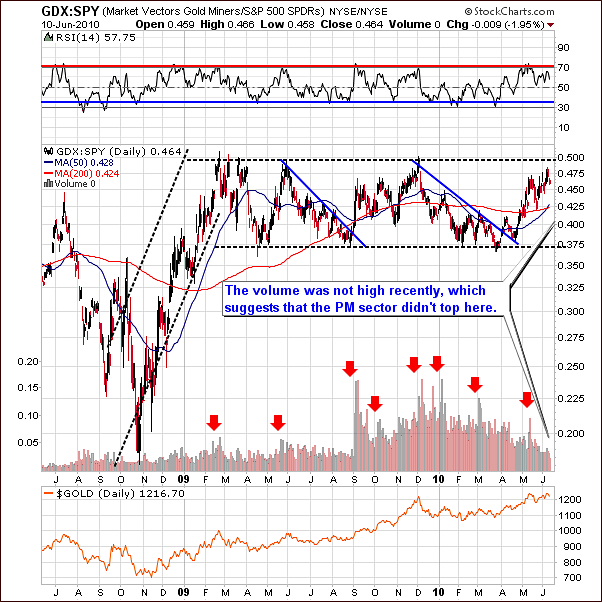
The GDX:SPY helps us to analyze the precious metals stocks relative to the general stock market. The ratio in the above chart actually provides us with top calls, which is another word for sell signals for the whole precious metals market.
Ideally, the volume would reach exceptionally high levels and some kind of resistance would be encountered, thus forming the top also in this particular ratio. Recently, however, neither is yet the case. We have not seen high volume levels and we are presently close to the month-to-month 0.5 support level. This means that when this level is reached one share of the SPY ETF is equal to two shares GDX. When gold and silver stocks are this high - relative to other stocks, it used to be advisable to get out of the market as the top was very close.
Still, we have not seen the ratio reach the 0.5 level yet, and it did not provide us with a sell signal in the form of very high volume.
Summing up, the analysis of the GDX:SPY ratio suggests that the final top has not yet been reached for the precious metals sector. Still, the risk is higher for silver and mining stocks than it is for gold.
Juniors
As stated in the Key Principles section, the list of top juniors will be updated approximately every 4 weeks, so this is the Update that should contain the revised version of the list. However, before providing you with details, we would like to comment on this sector's performance in general.
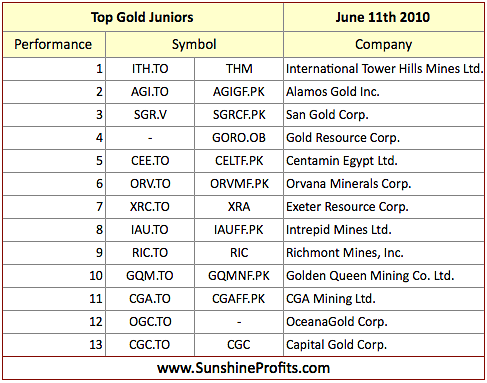
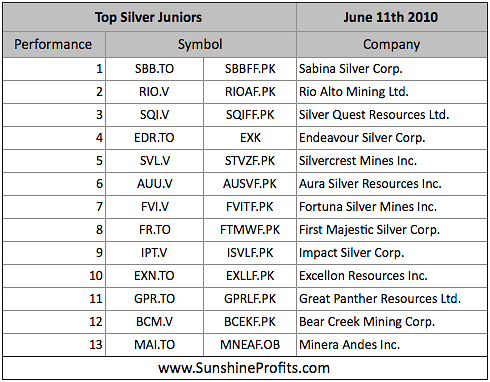
Once again, there are virtually no changes since the last month, meaning that the stocks that were strong (on a comparative basis) last month are still holding relatively well. Therefore, if you've been taking our rankings into account when selecting junior stocks to your portfolio, it seems that you will not need to make significant adjustments this month.
Other Information
Another question that we've receive this week was about the possible non-confirmation between gold at new highs and both silver and stocks lagging well beneath their old highs. The question is if such a non-confirmation becomes a source of worry at some point, since these three sectors traditionally move together.
The answer is the one that every economist likes to give when being asked just about any question - it depends. In the long run fundamentals drive prices of assets and the precious metal market is not an exception from this rule. As long as fundamentals are in place, the bull market in the precious metals will continue. There are several signs that will tell us that this is indeed the ultimate top - we don't see them yet.
The declining general stock market may continue to put a negative pressure for mining stocks and (especially) silver until we get to the final stage of the bull market (actually, we expect high rates of return even from stocks that don't mine gold nor silver, but that are just named "golden something" or "silver something".) In case of silver, we might also see sharply higher values in case of a problem with delivery of silver on COMEX. However, until either of them takes place, we might continue too see underperformance of these two parts of the precious metals market if the world stock indices move lower.
In case of silver, we don't think it would invalidate its final rally or make it anything less than breathtaking, but it could certainly delay it. In a way, lower values of the main stock indices are good for long term silver investors, because they would allow to buy as much silver as possible at relatively low prices before the silver market takes off.
As for the mining stocks, the situation is quite different, as they are not that likely to outperform metals during the final stage of the rally. However, in case of gold and silver stocks, the history suggests that the positive correlation with the general stock market is likely to wear off sooner or later. Please note that from 2001 to 2003 gold stocks managed not only to rise, but also to outperform gold along with declining stock market.
Therefore, the disproportion between gold's performance and the one of silver and mining stocks does not change the fundamental situation for the whole precious metals market, and consequently, does not make us concerned, as there is a good explanation behind it in the form of declining stock market.
There's one more thing that we would like to comment on here, as we've been also asked about the final stage of the rally, and what would be the use of the having massive gains on one's mining stocks, if they would be priced in the U.S. Dollar that could be worthless at that time. That is true that the final stage of the bull market in the precious metals market could correspond to a financial instability to say politely, but fortunately we are in this market to maximize our chances of even increasing our wealth during these difficult times.
Let's split the above question into two separate matters. The first one is "how do I know that I won't lose everything I have if the U.S. Dollar collapses overnight" and the second one would be about the gains in mining stocks when the U.S. Dollar is worthless.
The first question is all about owning physical metals. If you own physical metals, keep them in a safe place, or even better it is spread among several "safe places", it seems that you could sleep well at night. If the USD collapsed overnight, the increase in the value of the precious metals holdings would be so massive that just a 10% in gold/silver should more than make up for the losses in your "paper wealth." So, by following the rules listed in the Key Principles section you would have about 20%-25% of your portfolio in physical metals and an overnight dollar collapse could in fact massively increase your wealth. Therefore, you're protected at all times.
The second question is about protecting one's profits in mining stocks or from other speculative vehicles. Generally, it does not need to overly concern you either, because - as mentioned above - mining stocks are not likely to outperform metals during the final stage of the bull market. Therefore, we will strive to detect when it is not likely that mining stocks' outperformance will not return soon, and we will suggest switching directly to metals, just like we are now suggesting owning gold instead of silver and mining stocks (of course this is because of the short-term uncertainty regarding the last two markets, not because we believe that the bull market is close to being over.)
This is not recommended for most Investors, because could decrease one's profitability, but if you are particularly afraid that you could lose your speculative capital because of the death of the U.S. Dollar, you might want to put 10-90% of your profits from each trade (depend on how afraid you are) in mining stocks directly to physical gold or silver. In this way you will be sure that the relative amount of physical metals in your possession is constantly rising, and at the same time the amount of "paper wealth" at risk (here: stocks) decreases. Again, the price here is limiting your exposure to profits from speculation on mining stocks, so it's a trade-off.
Summary
This week saw a slight decline in the USD Index, but we must stress that we remain bullish for the short term. Concerning the Euro Index, we remain bearish in the short run and expect this to change in the coming weeks as the euro bottoms out and eventually rallies. These sentiments are likely to change within a month or so. Consequently, our bullish sentiment on gold will likely change as well, as we are looking for gold to top out, perhaps within the next few weeks. This would give investors a chance to take a breath after cashing out and have an opportunity to re-evaluate new potential markets to enter. Additionally, the summer months are generally likely to provide opportunities for short-term trades instead of the one big rally or decline.
Once again, gold is heavily favored over silver and mining stocks, whose outlook is mixed in the short-term. The points made in our recent updates still hold today, but we expect there could be significant changes beginning in 10-20 trading days. As always, we will continue to monitor this situation closely and issue Market Alerts whenever anything significant develops. We will continue to keep our Subscribers fully informed in a timely manner.
This completes this week's Premium Update.
Thank you for using the Premium Service. Have a great weekend and profitable week!
Sincerely,
Przemyslaw Radomski

