
Subscribers who had opened long speculative positions on March 17th, as per our suggestion, were up over 8% based on closing prices on Thursday March 24th– taking gold stocks (HUI Index) into account. Last week, the price of gold got to a record of $1,447.40 per ounce and those who took profits by closing those positions on Friday, March 25th, as per our suggestion, made an 8% profit in 8 days. Actually, one could call that “Gr-8”.
As we expected, gold prices moved down this week supposedly in the expectation of rising interest rates in industrialized countries. But in the long run, weakness of the dollar, the uncertainty in the Middle East and concerns over a looming debt crisis in the euro zone, provide support to the price of the yellow metal.
Rising interest rates and inflation
Rising interest rates traditionally are bearish for gold since gold does not pay any interest and it actually costs money to store it. Although interest rates are rising in some places in the world, it doesn’t make sense that they will rise much in the industrial world.
Government debt is too massive and the mountain of debt must be serviced by very low interest rates. Just imagine what will happen if interest rates go up. The federal debt service costs will skyrocket and the Fed will have to monetize more as a result of higher rates. It will cripple the economy’s ability to climb out of this debt burden. For debt service costs to skyrocket, interest rates need only rise marginally. For weaker nations it can mean default, hyperinflation and a doomed currency.
So, Western governments do not have an incentive to raise interest rates. But what about inflation? If rising interest rates spell trouble for gold, inflation historically does the opposite.
You don’t have to read about inflation in the headlines to know it’s there. Just go to your local supermarket, or go to the gas station to fill up your tank. With inflation consumers have less purchasing power. The government wants inflation. It believes that inflation will boost the economy and, not coincidentally, reduce the real value of the debt in the system. Consumer prices are rising at 0.5% per month --multiply by 12 it comes to 6% per year. Producer prices are going up even faster – at a 20% annual rate, extrapolated from last month (taking the official – “adjusted” inflation into account – the real inflation is likely considerably higher than that).
Someone said that the trouble with exporting inflation is that it always comes back to bite you, and usually sooner than later. Other countries are already experiencing the pain of inflation. China’s core consumer prices increased 2.6% year-over-year in the last month, after posting a 2.1% rise the month before. And China's broader consumer price index increased 4.9% year-over-year last month, exceeding the official government inflation ceiling of 4% for the fourth month in a row.
Last Friday China's central bank said in its official report that it sees a risk of "competitive devaluations" by developed countries with high unemployment rates in 2011, while emerging economies will face risks of inflation and asset bubbles.
The PBOC also said it expects global commodity prices to remain high this year, especially oil and grain prices, while gold prices are also likely to remain high, although the downside risks of gold prices can't be ignored.
The Chinese don’t need encouragement from the Bank of China to buy gold. They are already buying up as much gold as they can as a hedge against inflation.
Congressional Testimony on Gold
A couple of weeks ago Lewis Lehrman's, an investment banker who writes about economic issues, gave testimony before the Subcommittee on Domestic Monetary Policy and Technology. He spoke about inflation but it is especially his thoughts on gold that were interesting.
He pointed out that since the Federal Reserve program of quantitative easing began in late 2008, oil prices have almost tripled; gasoline prices have almost doubled. Basic world food prices such as sugar, corn, soybean, and wheat have almost doubled.
He notes that commodity and equity inflation, financed in part by the Fed's flood of excess dollars going abroad, has profound effects on the emerging markets. In many emerging markets, where food and fuel make up 25-50 per cent of the family’s disposable income, a boost in prices can mean the difference between subsistence and starvation.
The Fed credit expansion, from late 2008 through March 2011, which created almost 2 trillion new dollars — triggered the commodity and stock boom. Some of these excess dollars found their way to foreign markets, causing a fall in the dollar on foreign exchanges. Here is what Lehrman had to say about gold.
If the defect is inflation and an unstable dollar, what is the remedy?
A dollar convertible to gold would provide the necessary Federal Reserve discipline to secure the long-term value of middle income savings and to backstop the drive for a balanced budget. The gold standard would terminate the world dollar standard by prohibiting official dollar reserves and the special access of the government and the financial class to limitless cheap Fed and foreign credit.
The world trading community would benefit from such a common currency — a non-national, neutral, monetary standard — that cannot be manipulated and created at will by the government of any one country. Thus, dollar convertibility to gold must be restored. But dollar convertibility to gold must also become a cooperative project of the major powers.
Gold, the historic common currency of civilization, was during the Industrial Revolution and until recent times the indispensable guarantor of stable purchasing power, necessary for both long-term savings and long-term investment, not to mention its utility for preserving the long-term purchasing power of working people and pensioners. The gold standard puts control of the supply of money into the hands of the American people, as it should in a constitutional republic.
Because excess creation of credit and paper money can be redeemed by the people for gold at the fixed statutory price, the monetary authorities are thus required to limit the creation of new credit in order to preserve the legally guaranteed value of the currency. As President Reagan said, "Trust the people."
To accomplish this monetary reform, the United States can lead, first, by announcing future convertibility, on a certain date, of the US dollar, the dollar itself to be defined in statute as a weight unit of gold, as the Constitution suggests; second, by convening a new Bretton Woods conference to establish mutual gold convertibility of the currencies of the major powers — at a level that would not pressure nominal wages; third, to prohibit by treaty the use of any currency but gold as official reserves.
A dollar as good as gold is the way out. It is the way to restore American savings and competitiveness. It is the way to restore economic growth and full employment without inflation. Gold convertibility is the way to restore America's financial self-respect, and to regain its needful role as the equitable leader of the world.
A Dictator and his Pot of Gold
Here is a gold story we wanted to share with you. If you are a tyrant fighting your own people to save your entrenched dictatorial rule, it is nice to have a lot of gold. We are talking, of course, about Libyan lunatic dictator Muammar Qaddafi. It seems that he can tap gold reserves worth $7 billion, equivalent to a 10th of the size of his country’s economy, as he fights a war against his own people and resists air strikes from the western-led. Libya holds 143.8 metric tons of gold, the fourth- biggest holder of gold in the Middle East and Africa.
We hope for the sake of his people that he is ousted soon and that the country’s gold reserves are not used against its own people. To see how our own (more modest) stash of gold is doing, let’s turn to the technical portion with analysis of the Euro Index. We will start with the long-term chart (charts courtesy by http://stockcharts.com.)
Euro - USD Indices
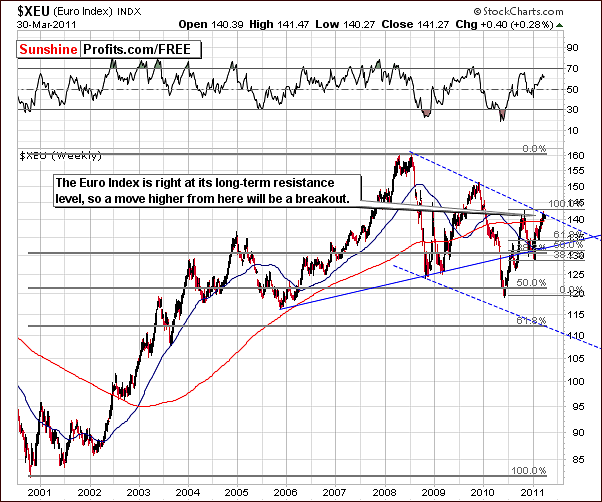
We open this week’s currency section with a look at the very long-term Euro Index chart. Little has changed since last week as we have seen several small moves in index levels but no move above the upper border of the declining trend channel. We also did not see any significant downswing this week either, and the Euro Index remains at a crossroads presently.
A move higher from here would constitute a breakout. Whichever way index levels move from here will likely determine the direction of the next significant move.
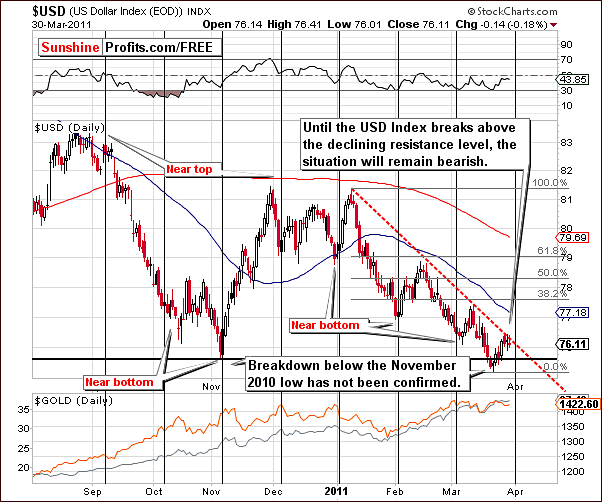
In this week's long-term USD Index chart, as usual, the opposite of what was seen in the Euro Index chart is true. The euro and the dollar normally reflect each other, that is to say, move in opposite directions. The dollar is right at its short-term resistance line which is the red, dotted, downward sloping line in our chart. Once this is taken out, a rally up to possibly the 78 level is possible. This – as we will explain later in this report - would likely result in a decline in prices across the precious metals sector.
If the USD Index declines from here, gold and silver would likely show continued strength. The downtrend however, appears a bit too perfect with a short-term trend line so very obvious. It appears that many people may already be betting on this trend line and it simply may not work.
Many Traders and Investors may have already taken the trend line into account and it’s already discounted in the price. If this is the case, no one will be selling since sellers have already sold. Conversely, the only option would be to buy and this would cause index levels to rise. This is purely speculation however on our part. The USD could rally from here based simply on the non-confirmation of the recent breakdown.
Since both USD and Euro indices are at the crossroads, there is not much that we can add based on the fact that we are approaching the cyclical turning point in the USD. In other cases, this tools would suggest that a bigger move in either direction is likely to begin soon, but this time, we already realize that.
Summing up, the situation in the currency markets this week is mixed.
General Stock Market
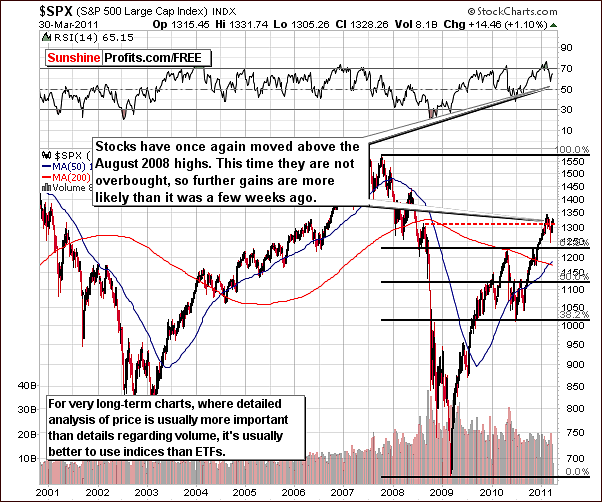
In the very long-term S&P Index chart this week, we once again see a move above the August 2008 highs. The difference now as compared to prior moves of this type is that we are no longer in a short term, overbought situation. RSI levels are in the mid-60’s. This makes a continuation of the recent rally more likely. However, not all is rosy for the stock market.
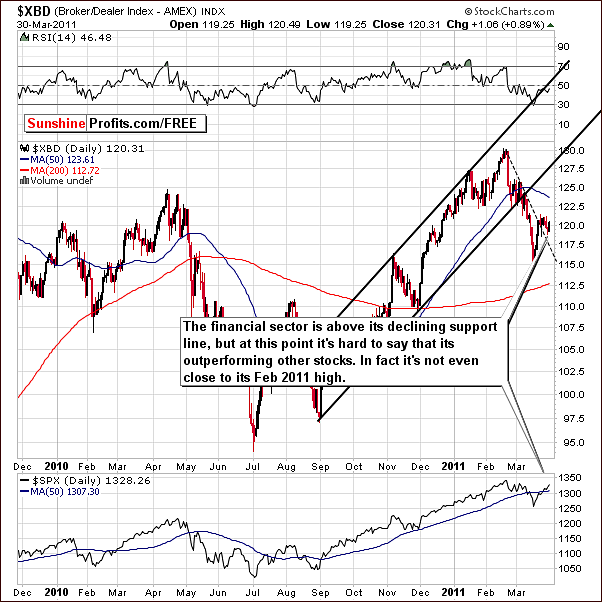
In the Broker-Dealer Index chart this week, we see some bearish signals which appear to be quite important. Index levels are above the short-term declining support line but are nowhere near the February-March tops. This is quite different from what is taking place in the general stock market.
Since the financials here are normally a leading indicator and they are lagging stocks in general, this is a bearish sign. With the general stock market above its August 2008 highs and bearish signs here, the overall situation for stocks is mixed.
Summing up, we realize that it’s not the most pleasant thing for Traders to hear the words mixed, wait and stay out but based on our years of experience at times it’s simply the best approach. We feel it is our responsibility to call it like we see it based on our interpretation of today’s market signals.
Correlation Matrix
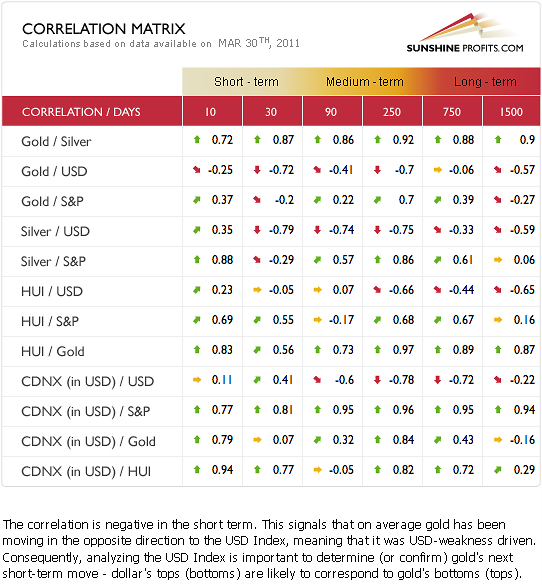
In this week’s Correlation Matrix, we see that the strength of the correlation between the general stock market and the precious metals has weakened quite a bit. The currency markets now appear to have a much bigger influence upon gold and silver. The gold and silver mining stocks continue to move somewhat on their own.
Emotions appear to be very much in play now and stocks are more volatile in the short term than are the precious metals. The US dollar is the key to monitor for determining the likely next direction for gold and silver. Earlier in this update, we mentioned the currency markets being at a crossroads. We should wait for a breakdown (or a decisive move lower) in the USD Index and see how the precious metals respond before opening any speculative positions. We will keep an eye on this and report to you accordingly.
Gold
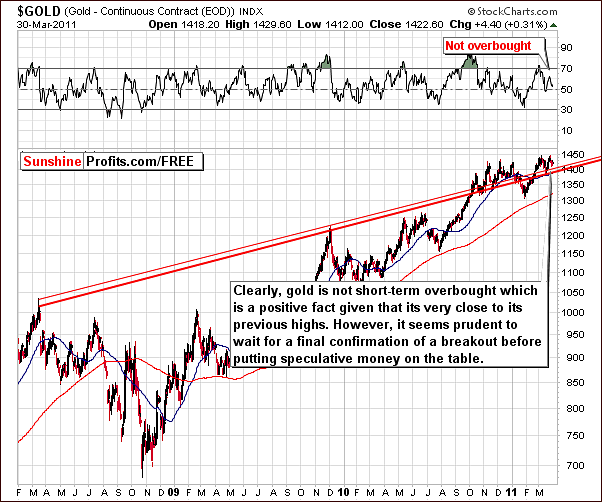
In this week’s long-term gold chart, we see that the situation is no longer overbought based on RSI levels. The breakout above the rising long-term resistance/support line has been confirmed.
Until the move above the level of previous highs is confirmed, however, we do not view the situation as one that can be described as bullish enough to justify opening long positions. It simply appears to be mixed at best right now.
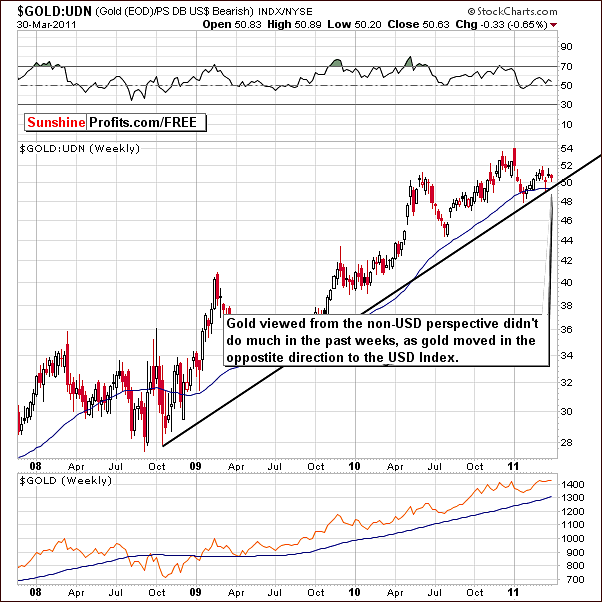
In this week’s non-USD chart, we have seen a move to the rising support line followed by a bounce. Index levels are now equal to where they were several weeks ago. Very little has happened as we have seen a period of consolidation recently.
This could be the silence before storm – markets gather strength for a bigger move. Perhaps we will see a new rally begin soon, but then again, we could also see a breakdown. The latter would have an obvious negative effect on USD Gold Investors as well. There is little more to say at this time. This situation is mixed and we will continue to monitor developments and keep you up to date on anything important.
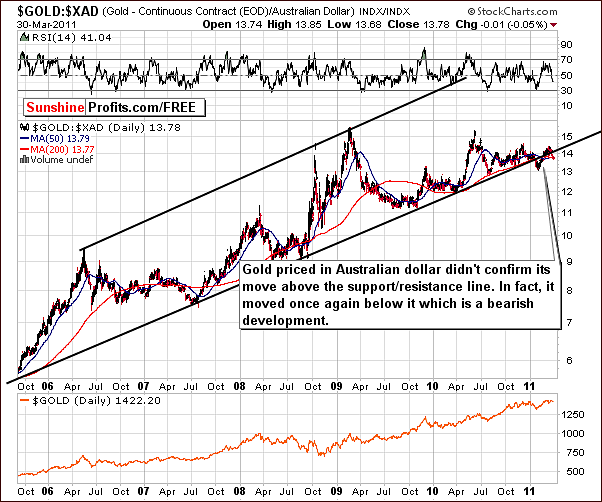
Our previous gold charts have given both bullish and mixed signals so far. In this week’s gold chart from the perspective of the Australian dollar, we can once again see a move below the rising support/resistance line. Index levels were above this line a few weeks ago but the situation did not appear overly bullish since the move was not confirmed.
We now have a bearish development with the recent move below this support line. Overall, the situation for gold can be termed mixed based on information in all this week’s long-term charts.
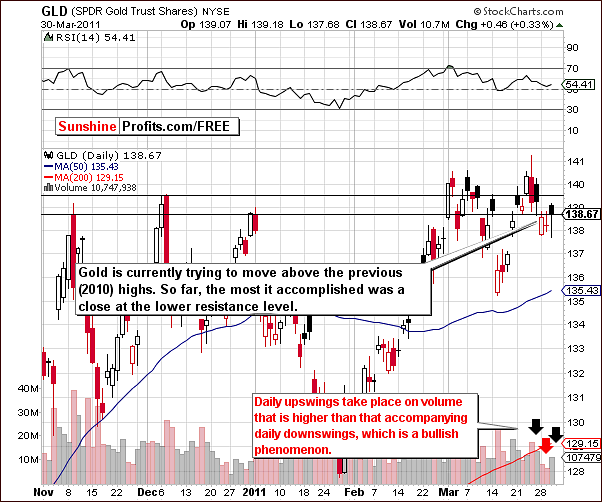
In this week’s short-term GLD ETF chart, we have more mixed news as we see gold trying to hold above an important support lines created from the highs in late 2010. Given that the gold price is currently at the lower support level, this is a slightly bearish development. [Based on early trading on Thursday we’ve seen a move to $140 level, which is still not above previous highs.]
Analysis of volume levels points to a somewhat bullish situation. Daily volume levels have been higher when prices rise and declines have been accompanied by lower volume.
Consequently, in the short-term chart, we have bullish indicators when analyzing volume and neutral signs when analyzing price. The situation is once again mixed, however with a slight bullish bias.
Summing up, the situation is clearly mixed in this week’s short-term and long-term charts for gold. It seems best to wait for additional confirmations before opening any new speculative positions. We believe long-term capital should remain invested. Meanwhile Traders and Speculators may wish to simply wait for the next train and follow the adage, “when in doubt, stay out!”
Silver
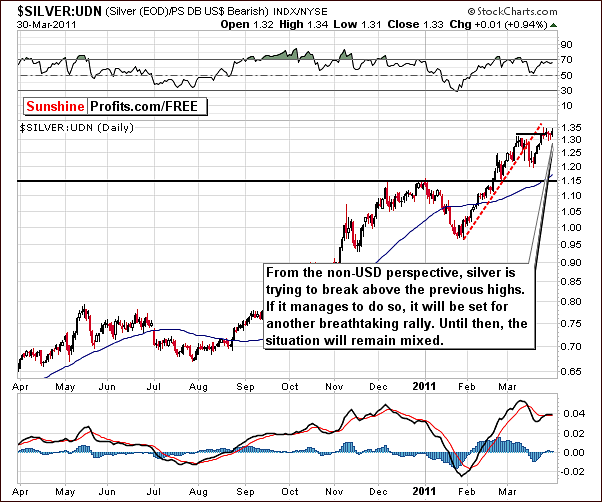
The long-term charts for silver on the USD side this week did not appear to provide any new information worth commenting upon. We therefore open our silver section of this week’s update with the view from the non-USD perspective.
Silver has been consolidating and trading sideways for the past several days from a non-USD point of view. Index levels here are close to the level of the early March highs and the situation is somewhat tense. In the gold section we commented on the gold:UDN ratio in the following way: this could be the silence before storm – markets gather strength for a bigger move. This is even more visible in case of the white metal, as the trading range has been even narrower.
A move down from here below the important tops which were seen recently would likely make a bigger decline quite possible. On the other hand, a small from here, could very well signal the beginning of another big rally.
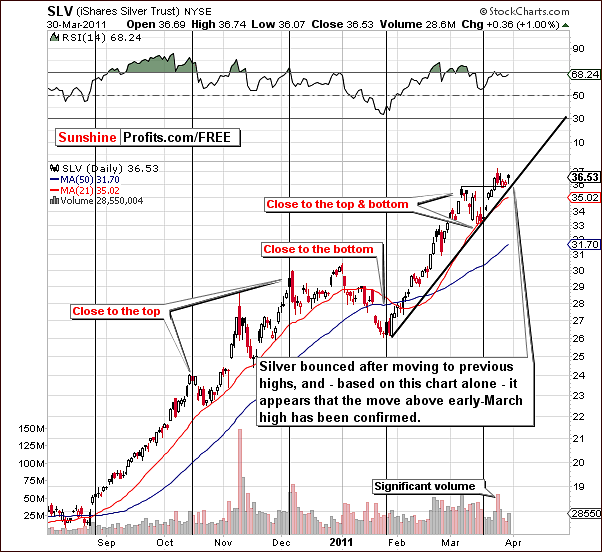
In this week’s short-term chart, we can see that silver moved to the level of early March highs and then bounced. This is a bullish development. Further bullish implication come from the fact that the rising support line was not broken.
So we have bullish implications here with mixed signals from previous charts and also to be seen in later sections of this update. We do not view the situation as a strong buy for the speculative Investor in silver at this time.
Summing up, the signals are once again mixed for the white metal this week, a situation similar to that seen for gold. Please note that this does not mean that we have absolutely no information. We do – we can infer that further consolidation is unlikely. It does appear slightly more bullish here but the “when in doubt, stay out” mantra appears to be valid for Traders and Speculators. The only exception would be Straddle/Strangle speculative option play – which would allow one to bet on increased volatility in the coming days/weeks. Again, we believe that long-term holdings should remain intact.
Mining Stocks
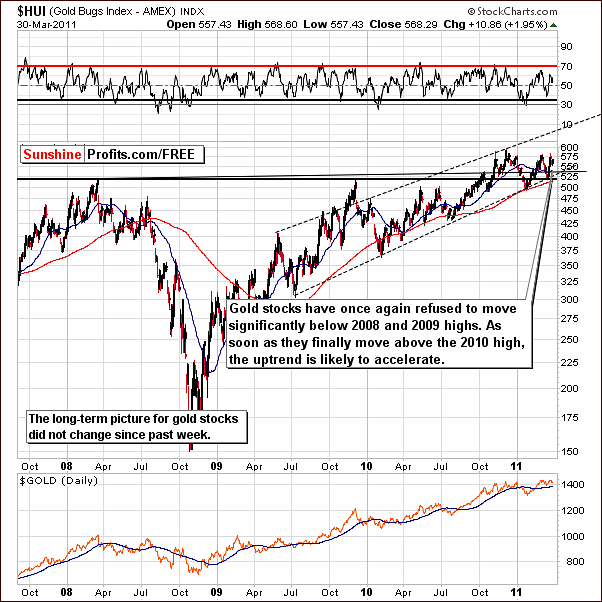
In this week’s HUI Index (gold stocks) chart, we see some consolidation after a bounce off the support level created by the 2009 and 2010 lows. It seems that higher index levels may be seen from here once the final resistance breaks.
Until the late 2010 highs are taken out, it does not appear that the situation should be described as very bullish. This is also in line with what we stated for gold itself.
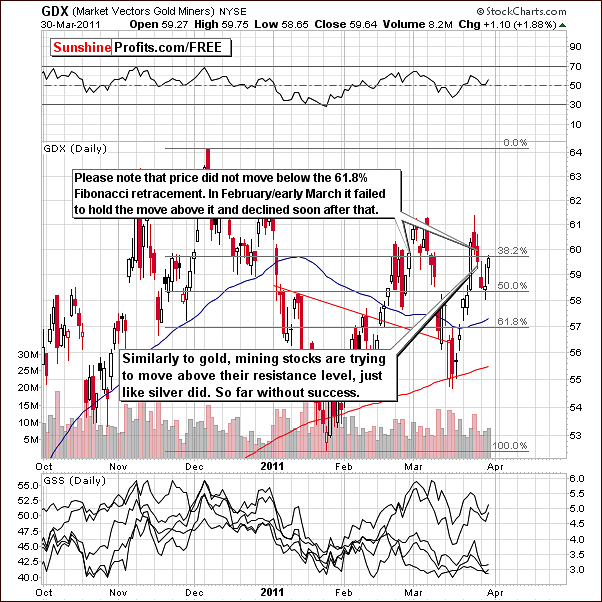
The situation in the short-term GDX ETF chart this week is somewhat analogous to that of gold itself. Gold is at the resistance level created from previous highs and here the gold mining stocks are at a resistance level based on the 61.8% Fibonacci retracement level.
In last week’s Premium Update, we commented that this [61.8% Fibonacci retracement level] played an important role in late February and early March as prices dropped only after stocks failed to break above this level. Actually a few moves above the 61.8% line were followed immediately by moves back below it. Back then, we did not see three consecutive days without price moving below this level and mining stocks have declined.
At this time, a significant price decline could be seen if the current Fibonacci retracement levels are not held. Recent price action has been seen between the 50% and 38.2% Fibonacci retracement levels. [Based on Thursday’s early trading we see GDX moving slightly above this level.] The situation is mixed and where prices go from here with respect to these levels will likely determine the trend for the near term.
Summing up, the situation for gold mining stocks this week is mixed as was the case for gold and silver. It appears best at this time to wait for other signals especially with respect to speculative capital. Better trading opportunities will likely be seen ahead.
Silver’s True Seasonals
In response to popular demand we are providing the April seasonal chart for silver.
As you might remember from previous Premium Updates, this analysis is based on our forthcoming tool – True Seasonals. This tool encompasses both the seasonality of metals and the impact the expiration of derivatives has on metals. As the precision of True Seasonals has proved to be high in March, True Seasonals remain particularly interesting on the brink of the month of April.
Now, let’s move to the proper analysis. Please take look at the below chart.
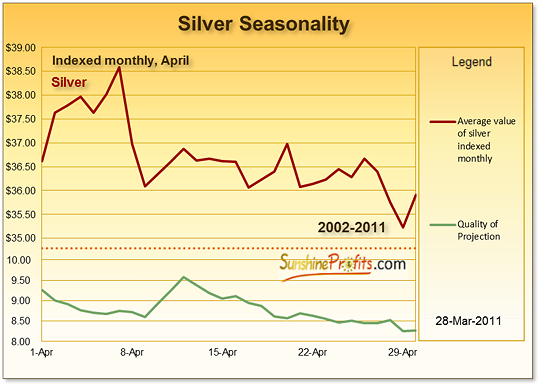
The price for April 1st is yet to be known – we assumed that it would be equal to the price of silver on March 28th, which was $36.62. True Seasonals suggest that a short-lived rally might occur in the first week of April to be followed by a decline of similar magnitude. This marks the end of predicted significant price moves for April. Our tool suggests that silver might follow a sideways trend throughout the rest of the month. Quality of Projection suggests that the reliability of the predictions remain high – at no point does it go below 8 (10 is the maximum) and reaches its peak point at the beginning of the predicted sideways trend. This implies that you should include True Seasonals in your analysis of the market and that the prediction of a sideways trend might be especially accurate.
To keep it simple – an upward trend might occur in the first days of April after which we should be particularly cautious and look for signals of a possible slump. In the second half of the month prices of silver might drift sideways.
We urge our Subscribers to keep track of the developments in the precious metals market as factors other than seasonality and the expiration of derivatives may impact prices of silver. As always, we will keep you updated with our Premium Updates and Market Alerts.
Letters from Subscribers
Now we would like to move to a particularly interesting question that we have received this week.
You are using the Stockcharts system for your articles and analysis. The vertical axis is logarithmic. Based on this, I can see your logic for setting the $38 target from the continuation of the highs from 2006 and 2008.
The interesting thing is if you plot the y-axis using a linear scale, the 2004 peak, the 2006 peak, the 2008 peak and the Dec 2010 peals all line up really well, and the move off the Feb 2011 lows would be seen as an upward breakout of the trend line. (breaking out last wk Feb.)
Stockcharts themselves have a link which outlines the benefits of linear/arithmetic charts against logarithmic:
I would be very interested in your comments on this aspect and its implications for the Silver market.
Generally, the log scale (to be precise - the semi-logarithmic scale) is much more useful than the linear one, which is precisely why we use it. The logic behind that is also the root of technical analysis --emotionality. Which will cause the same emotional swing as an increase in the value of something from $1 to $1.50? Will it be an increase from $50 to $50.50, or an increase from $50 to $75? Naturally, the latter, because in both cases the move is substantial and offers a possibility of a 50% gain on invested capital.
Why do people invest/speculate? Naturally, because they want to improve their financial situation and the way to do that is by making profits. Profits are calculated by dividing a gain on a given position by the capital that was invested in the first place, so they are important in relative terms. Consequently, people care about a given asset’s performance relative to its previous price, not in absolute terms. In other words, 50-cent move is irrelevant for a $500 stock, but it is groundbreaking for a 20-cent junior.
Moving back to scales - semi-logarithmic scale lets you know about stocks’ relative performance, which is in tune with what people are interested in and what influences their trading decisions. So, if technical analysis’ job is to reflect people's emotionality and to then position ourselves accordingly, then we should use tools that enable us to reach this goal. In this case it's the semi-log scale.
There's one more point we would like to make. On the Stockcharts page there are also two points that suggest that in some cases arithmetic scale is better.
Arithmetic scales are useful when the price range is confined within a relatively tight range,
Arithmetic scales are useful for short-term charts and trading. Price movements (particularly for stocks) are shown in absolute dollar terms and reflect movements dollar for dollar.
We disagree that it's better in these cases. Arithmetic scale is almost as good as the semi-log one (in case of long-term charts the semi-log scale wins decisively), but it’s not better. The first reason is that people's emotionality doesn't change for short-term moves, so points made earlier still hold. The second reason is that the difference between semi-log scale and an arithmetic one is barely visible for the very-short-term charts, so the difference in usefulness is also barely seen. In other words, arithmetic scale works quite well in the short term, because in short term it's almost the same as the semi-log one.
Why? Actually, you've already read the explanation - because people perceive prices in relative terms, not the absolute ones. The point is that in the very-short-term chart you generally have very small moves in percentage terms - say +0.1% or so. In this case, it makes little difference if the stock moves by $0.01 or 0.1% - it's still almost nothing. Of course the situation is different in the case of a stock that's worth $0.01, but that's an extreme and rare case and we would like to explain the general concept.
Since taking relative and absolute overview on prices don't provide different emotional responses, both scales are ok - and in fact, they will look alike. Still, based on the way technical analysis works, the arithmetic scale cannot be better than the semi-log one - it can only be very close. If you studied physics, then this explanation might be useful - only at the quant level would these two be identical. In all other cases the semi-log scale wins, and the greater the distance from the quant level, the bigger the difference in usefulness of both scales.
For those of you who want to know more about applying adequate trend lines, we have dedicated an essay "Dangers of Linearity" available in our Research section.
Summary
Throughout this week’s update, the situation across nearly all markets has been described as mixed. This is due, in part to the close relationship seen between markets as a mixed situation in one often carries over to some or many of the other markets. It seems that such is the case today.
In the currency markets, the euro and the dollar are both close to resistance and support lines and a strong move in either direction will likely be the beginning of an eventual big move. The situation is quite tense today.
In the general stock market, we again see a mixed situation, although this does not appear to be impacting the precious metals as strongly as are the currency markets. The financials are somewhat bearish which is contrary to the bullish signs seen in the general stock market.
Gold has been trying to move above its previous highs but has not yet succeeded. Silver is the most bullish of the precious metals at this time but since all precious metals move together, we hesitate to call the situation very bullish for the white metal.
Gold and silver mining stocks are trying to take out their own resistance levels and with mixed signals present, it seems best to wait for a more favorable risk/reward ratio in order to open new speculative positions. We will watch the situation closely in the coming days/weeks and keep you up to date with all important developments.
Our next Premium Update will be published on Friday, April 8, 2011.
This completes this week's Premium Update.
Thank you for using the Premium Service. Have a great weekend and profitable week!
Sincerely,
Przemyslaw Radomski

