
There are all kinds of methods to measure the value of gold. Believe it or not, one is to compare it to the price of a good men's suit. Apparently, that method hails from ancient Rome where an ounce of gold could purchase a really good quality toga.
Certainly a $1,000 can buy a decent suit nowadays, even for the Wall Street types who probably used to spend a lot more than that before the economic crises.
Another interesting comparison has been recently raised in an interview on Yahoo Finance with Peter Schiff, president of Euro Pacific Capital, and a well-known bear guru. His rise to fame came in late 2008 when a video collage of his media appearances predicting the U.S. housing bubble, the subprime mortgage crisis and ensuing economic meltdown appeared on YouTube. It was entitled, "Peter Schiff was Right."
Let's see if he's right about his latest predictions. Schiff said some things that are pure music to the ear of any gold bug, including his expectation that gold will hit $5,000. Schiff compared the price of the Dow when measured by the price of gold. Schiff noted that in the year 2000 the Dow was worth 43 ounces of gold. During the market's low point this March, the Dow was worth only about 8 ounces of gold, a significant decline. Schiff believes that gold is now "climbing a wall of worry" and when it breaks out it will eventually become as hot as tech stocks were in 1999 and start moving up at a clip of $100-a-day. Eventually, he says, the Dow and Gold will trade on a one to one ratio, versus the current level of around 9.7-to-1.
The ratio analysis does not clarify at what price of gold would that take place, but should DJIA decline the same amount (percentage-wise) that gold would gain, the balance would be achieved at $1,813, with gold increasing about 81%, and the DJIA decreasing by 81%. However, taking a relative approach, which seems more appropriate, the Dow would need to go about 3.08 times lower to offset the increase of the gold price by the same multiplier. This means both gold and DJIA at $3,084. In other words, depending on how one wants to slice the numbers, you get gold between $1,800 and $3,100 - definitely much higher than today's price. This type of analysis does not have much to do with timing the most favorable entry points, but it does help to put even a $100 correction (which I don't expect to take place) into proper perspective, as long as investors want to hold a part of their precious metals for a few years (which I strongly recommend).
Schiff's forecast is based on his view the U.S. dollar is going to collapse under the bulky weight of America's deficit, which he compares to the massive spending programs of the 1960's which financed the Viet Nam War, the race to the moon and the Great Society. As you may recall, two weeks ago I compared the cost of the bailout to the combined total of the abovementioned events plus several others, including the Marshall Plan.
I definitely agree with Schiff that gold is now climbing a wall of worry, as does virtually every bull market. The dollar, on the other hand, is sailing down a river of hope into choppy waters. In another interview last week, this time on CNBC, Schiff said the U.S. dollar will continue weakening, attracting investors to borrow it in order to invest in higher-yielding assets. That sort of transaction is called the "carry trade." It's when you borrow money in a weak currency paying very low interest, and invest it elsewhere for a higher yield. For many years the yen played that role.
Schiff said that not only can you borrow dollars for very cheap and earn to carry by investing in higher yielding assets, but that the dollar is going to fall sharply. So, anyone who puts on the carry trade is going to make a ton of money, he said.
Schiff got some confirmation last week from World Bank President Robert Zoellick, who said that United States should not take the dollar's status as the world's key reserve currency for granted because other options are emerging.
Do I recommend that you follow Schiff's advice and borrow dollars at a low interest rate to invest in gold? I must admit that although the idea is tempting, I generally do not recommend it. While it does make sense, as far as the pure logic is concerned, we should take other factors into consideration - namely emotions.
By borrowing money and investing it in an asset that does not provide income, such as a dividend, you also generate a negative revenue stream. In other words, you need to make payments on a monthly basis for the loan, which is not a big deal as long as price of gold goes up. However, it could become a big problem during consolidations. When it costs you to hold certain amounts of gold/silver, you naturally want metals to shoot to the moon instantly. All owners of PMs (including your editor) would like to see the price of metals explode, but with leveraged positions (such as buying gold on margin or with borrowed money) the pressure is much bigger.
During consolidations, when we need to wait a little longer, it is easy to get irritated just because prices don't go where we want them to go. However, if it costs you and you're watching your holdings go lower in value, you are MUCH more likely to close your positions, just to stop "losing" your money. Consolidations are a temporary phenomenon, needed in every bull market. But with the pressure involved in buying anything on margin, it makes it easy to lose focus and close out positions much too early, possibly at lower prices than when you got in.
Therefore, taking the realistic approach towards investing, I cannot recommend purchasing PMs for borrowed money for most investors. Yes, it might prove worthwhile for extremely disciplined and risk-loving investors, but I believe that for most people, this approach is dangerous. Of course, the final choice is always up to you. If you decide to purchase PMs with borrowed money be sure to take the "emotion" factor into account.
Speaking of consolidations, let's turn to the gold chart (charts courtesy of http://stockcharts.com) and see what it did this week.
Gold
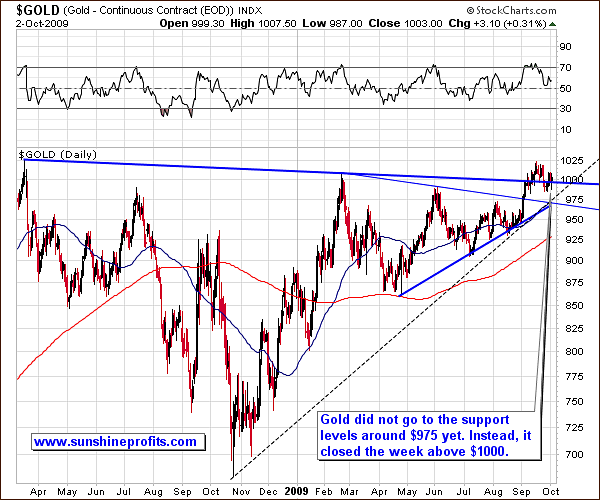
This week gold moved a little higher, and managed to close above the $1,000 level on Friday. This is positive in the medium term, since more and more people get used to seeing gold in four digits. Once this level stops being perceived as "extreme", gold will move much above it. Every close north of $1,000 helps to achieve this goal, and a weekly close is even more meaningful.
The rising support lines drawn from previous bottoms have not been reached, so gold still has room to correct safely should we see any negative shocks (for instance, a brief rally in the USD). By "safely" I mean that a relatively small (from the long-term point of view) decline would not cause the avalanche effect. This happens when price drops below a critical support level where investors have placed lots of stop-loss orders. Triggering such sell orders could mean even lower prices, which would trigger more orders placed at even lower prices, and so on. This is partly what causes the price of a given asset to plunge once price gets below certain level. Anyway, this does not need to concern us, as gold is relatively far from the support lines.
As far as the Relative Strength Indicator on the above chart is concerned, it is currently not overbought, so anyone adding to their gold positions, should not worry too much about buying at the top.
As mentioned a few paragraphs above, gold is currently hovering at the $1,000 level. Since this is such important number from a long-term point of view, I believe a weekly chart would be useful here:
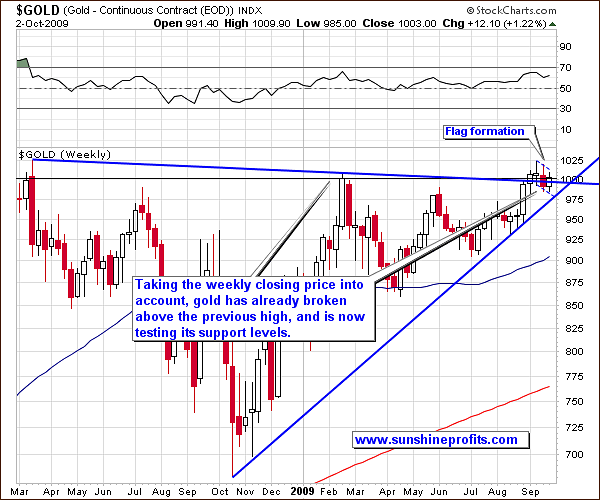
Once we take a look at gold from this perspective, it becomes noticeable that in terms of weekly closes gold has already broken above the previous highs, and is now verifying this breakout. So far it has been successful, as the price closed below the $1,000 level only last week, but bounced higher this week.
In this chart you can see the flag formation marked with thin, dashed lines. This pattern suggests continuation of the previous trend, and that the following rally will be at least as large as the preceding move. This would imply gold above $1,050 - high enough to convince many people that $1,000 has been taken out for good.
Yes, I know that much of the gold's rally has been attributed to the decline in the value of USD. This is not encouraging for investors who use other currencies to pay their bills. So, let's take a look at the gold chart in non-USD terms, to check if gold is an attractive investment also from the non-USD point of view.
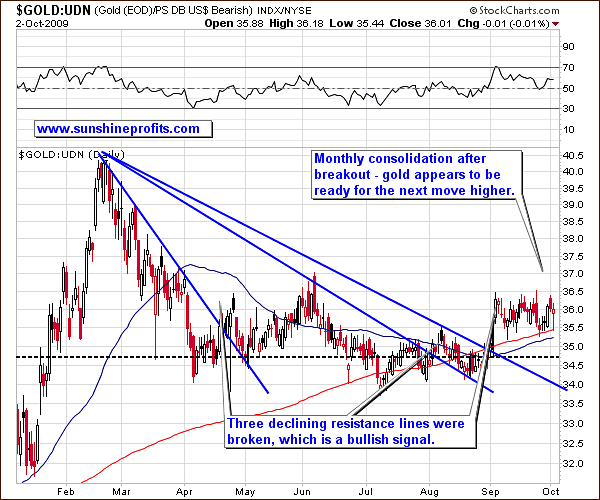
I mentioned this type of chart several weeks ago, when I emphasized that gold is poised to rise in all currencies, not only in the U.S. Dollar. Not much changed since then - I still consider gold to be a great buy no matter what fiat currency one uses. The ratio has been trading sideways in September, but it had done so above the support levels, thus confirming the breakout.
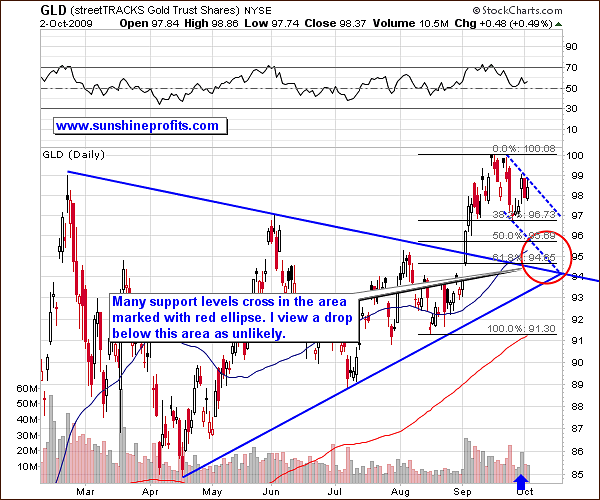
From a short-term point of view, it seems that the price of gold may correct a bit before a big rally materializes. As always, the Fibonacci retracement levels provide us with valuable support areas, which are strengthened by several other support lines. Most of the support levels cross at the area marked with red ellipse, so it is very likely to stop the decline.
This would more or less correspond to the ABC correction pattern, which is often seen in the metals market - a move lower would be the C part. Taking the long-term charts into account, it seems that the upper part of the ellipse, and the 50% Fibonacci retracement level (at 95.69 in the GLD ETF) are most likely to stop the decline, as they also correspond to the rising long-term support line (visible on the weekly chart.)
Silver
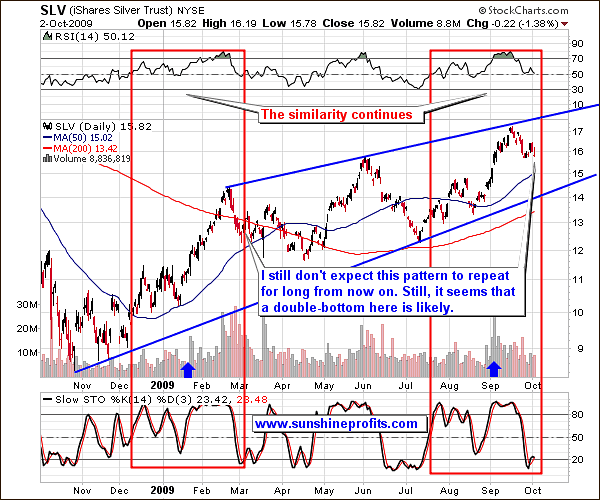
As far as silver is concerned, I can’t resist showing you once again the chart featuring the twin pattern in this particular market, as it still appears to be intact. Please note that the RSI and Stochastic indicators behave almost identically, as was the case several months earlier. Additionally, the volume has been decreasing along with lower prices in the last few weeks - as was also the case during the February-to- March downswing.
This time the pattern suggests that a double-bottom is about to emerge. This would not surprise me, especially given the situation in the gold market. A double bottom would be likely even if we didn't have this massive self-similar pattern. Please note that as far as local bottoms in silver are concerned, the Stochastic Indicator provides quite accurate entry points. Namely, a bottom in silver was accompanied by a double-bottom in the Stochastic indicator, especially if its value was below 20. This was the case very recently when the first bottom was formed, and it seems that we are about to see a second one. Since another bottom in this indicator would be accompanied by slightly lower silver prices, it is probable that both of them are currently in the works.
Gold Stocks
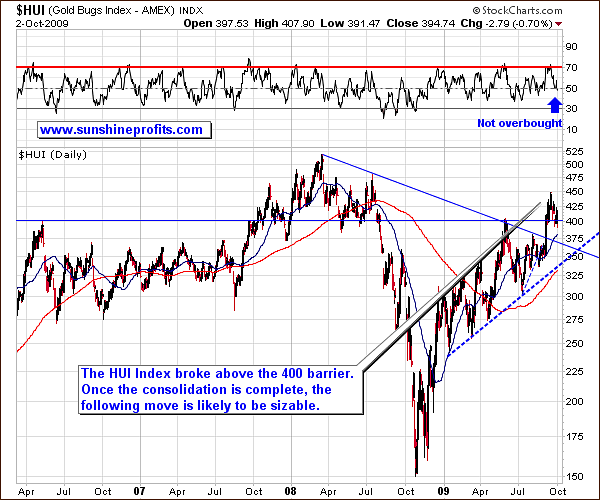
Moving on to the mining stocks, it appears that the breakout above the critical $400 level has been verified by several days when HUI closed above it. Since that was the case, we don't need to worry too much about Friday's close below $394.74, slightly lower than $400. Whether or not we will see HUI even lower on a short-term basis is based on the action in other markets. Since I mentioned earlier that a move higher is likely to follow after another small drop in gold and silver, it suggests a similar action in the mining equities. Let's take a look at the short-term chart for more details.
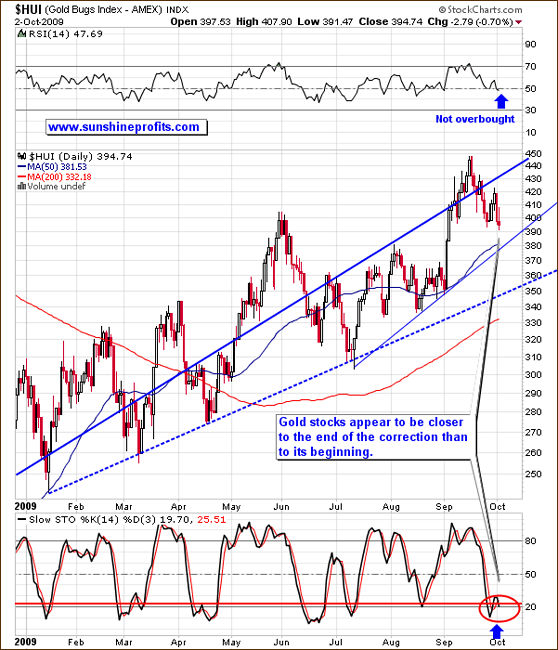
Short-term chart suggests that a downswing is close to being completed, as HUI Index is relatively close to the rising support line (currently at the $380 level). This would correspond also to the zigzag (ABC) pattern. As mentioned in the past, precious metals tend to correct in a zigzag fashion, and this time we could see another example of this tendency, meaning that the bottom is rather near, as the A, B and about half of the C part are behind us.
The Stochastic Indicator provides us with additional signal, as it was just below levels that meant temporarily oversold condition in the past, and it appears to move into this area once again. This type of behavior characterized local bottoms in the past so we may infer that one will emerge soon.
Not every important mechanism is directly visible on the above charts featured above, so let's turn to our indicators for more clues.
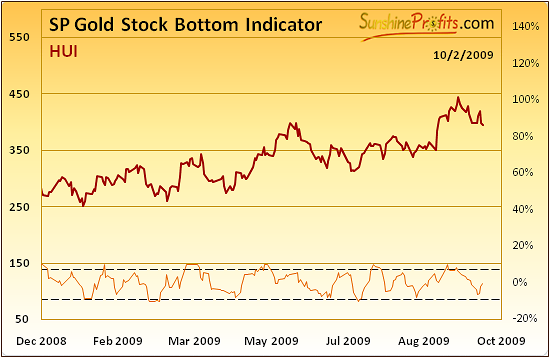
The SP Gold Stock Bottom Indicator recently moved near the lower dashed line. Generally, touching, or breaking through it means a buy signal. This did not take place yet, but please note that in the past bottoms materialized also when the orange line was just about to generate a buy signal, but finally didn't do so. In other words, when this indicator goes very near the dashed line, the probability that the bottom is in increases significantly. Again, it was usually the initial downswing that took this indicator to the 'buy' level, so it does not invalidate the above analysis - another small move down is not out of the question. Should it take this indicator below the dashed line, it would signals another favorable entry point.
Another tool that used to indicate extremes in the past has been recently flashing signals once again.
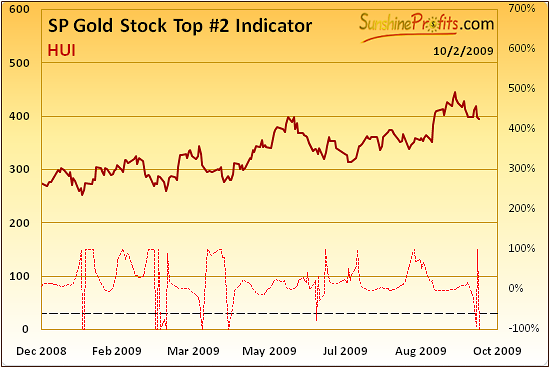
Putting things into proper context is always useful. This time it means checking what happened in the past when we have seen several consecutive signals from this particular indicator. That was the case in the mid-February, when we have seen a double bottom, with the second bottom being slightly lower than the first one. Please note that this is exactly what I suggested earlier, so the above indictor serves as a confirmation.
Naturally, given the level of globalization in today's economy it is best to take many markets into account, even if one invests in only one of them. Analyzing the general stock market helps to broaden our perspective.
The General Stock Market
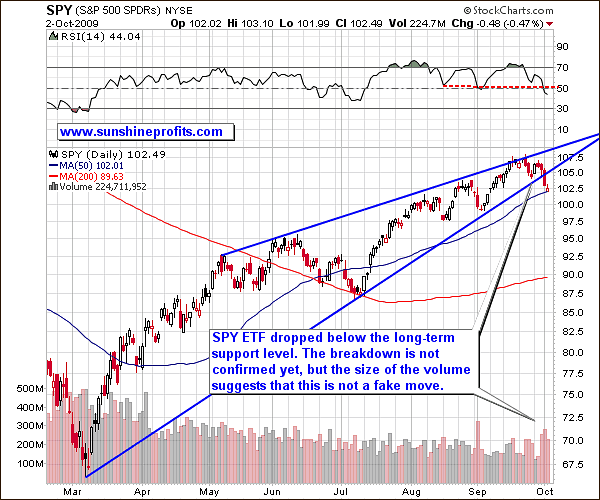
The general stock market made a decisive move this week. Although it closed below the rising long-term support line for two days, and the conservative approach suggests waiting for a three-day confirmation before making any calls, the size of the volume during the move has been visibly higher than it was the case in the past several weeks. The implication here is that a move lower from here has become likely.
The formation that we see today is a rising wedge, which is often followed by a sharp move lower, once price breaks down below the rising support line. This is what happened on Thursday, so unless main stock indices move sharply higher, thus invalidating the breakdown, a sizable downswing may follow. Again, this is not confirmed by the three-day rule, so I am not suggesting opening short positions in the popular stocks just yet. However, this would seem like a good idea, if we move higher on Monday, but the rise does not take main stock indices above the recently broken support line (now turned into resistance), and it is accompanied by weak volume.
With such a negative influence from the general stock market, it will be particularly interesting to analyze the situation on the second key market for PMs - the USD Index.
USD Index
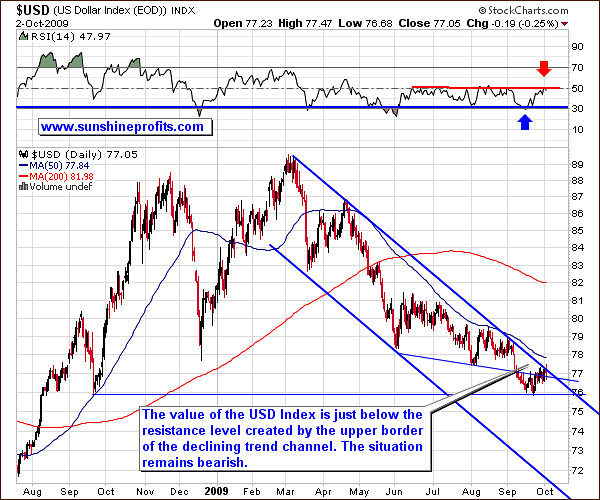
The buck moved higher, but not past the declining trend line (thick blue line), as I indicated last week. The old saying suggests that "the trend is your friend", which means that unless a trend is clearly broken, one should expect it to continue and take action accordingly. Not only are we just below this critical multi-month resistance level, but also the RSI Indicator is just reaching levels that meant that the top is in during the past few months.
The situation remains bearish for the USD, which is positive news for the whole precious metals sector, as they are generally negatively correlated with the value of dollar, virtually no matter which time frame one takes into account. Speaking of correlations, let's take a look at the correlations table to check which of the key markets is currently more strongly connected with PMs.
Correlations
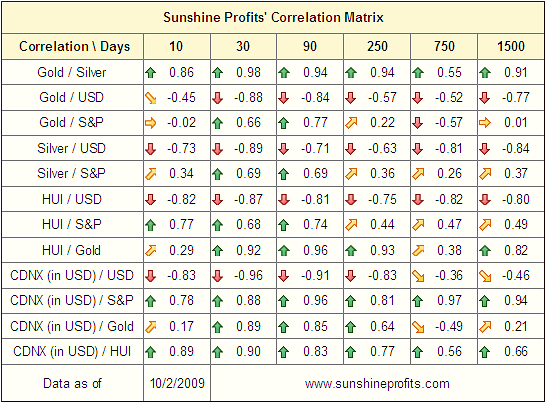
The 30-day column does not provide us with decisive data yet, but please note that the values of correlation coefficients are visibly lower between gold, silver, HUI and S&P 500 than it is the case with USD Index. Why is this the case? Because recently (10-day column), the influence that the general stock market had on the metals, became visibly weaker. Please note that the value of the 10-day coefficient for gold and S&P is equals mere 0.02, which means that they were trading independently from each other.
The implication for PM Investors is that PMs are more likely to follow the USD's positive signals, than to move much lower if the general stock market plunges. Naturally, they may move together every now and then, but for now it seems that the next big move is likely to be determined i.a. by the move in the USD Index, and that it will take metals higher.
Junior Mining Stocks
As stated in the Key Principles section, the list of top juniors will be updated approximately every 4 weeks, so this is the Update that should contain the revised version of the list.
The tables below feature our favorite junior stocks at the moment of writing these words. For more information on how you can use these lists please refer to the Key Principles section, especially to the part dedicated to juniors.
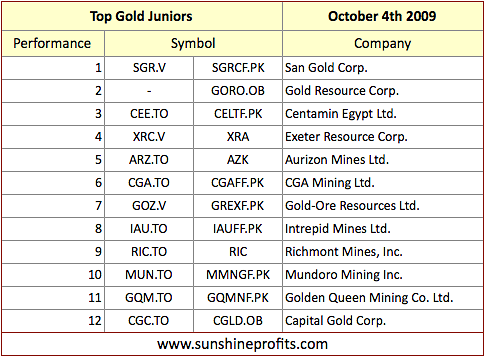
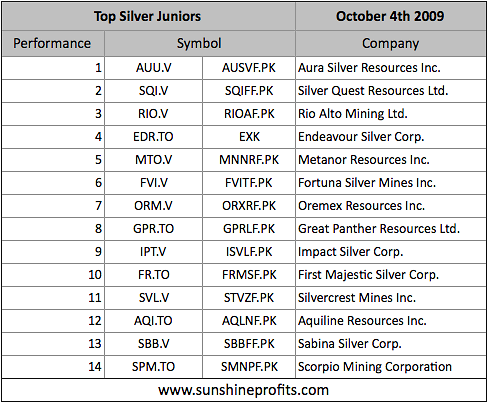
There are not many changes this month, and almost all companies featured last month are still in our top lists. Please take a look at the performance of Silver Quest Resources Ltd. (SQI.V) - one of the companies that were included in the previous rankings of our top silver juniors. We have added it to our top list a month ago, and it has more than doubled since that time.
Summary
The next few days/weeks will be critical to determine if the breakdown in the main stock indices was really a true one, or not. The same can be said about the USD Index - it currently seems that it will resume its main trend and head south once again, which would serve as a catalyst for a rally in PMs. Should we see a simultaneous drop in the value of both: USD Index, and S&P, gold and silver are likely to initially follow stocks, thus moving a little lower (as featured on the charts above), but finally to rally much higher along with dollar's decline.
This completes this week's Premium Update.
Thank you for using the Premium Service. Have a great and a profitable week!
Sincerely,
Przemyslaw Radomski

