
Back in early 2000, during the euphoria of what later became known as the Dot.Com Bubble, one well-known professional investor stuck his neck out and predicted the bursting of that bubble. Jeremy Grantham was a bit early and was willing to give up millions in fees from customers who fled his fund transferring their money to managers who promised the party would never end. In 2000 Grantham predicted stocks would lose 3.9% per year annualized for the next 10 years and he was proven right.
Given his prescient calls, we like to pay attention when Grantham publishes his famous quarterly newsletters, which have appeared since 1999. The publications represent his personal views on the stock market. Although he doesn't write specifically about gold, concentrating more on equities, the various asset classes are all inter-related and as gold investors it behooves us to consider all aspects of the economy. Grantham, co-founder and chief investment strategist of Boston-based GMO has recently published the spring edition of his quarterly newsletter entitled "Playing with Fire (A Possible Race to the Old Highs)".
Grantham is predicting the opposite of what he said in 2000. When the NASDAQ was at 5,000 he said sell. Now with the NASDAQ at about 2,307 he's saying buy.
Grantham is far from euphoric-don't forget that in the title of his missive are the words "playing with fire.' He says the massive bailout program stopped the meltdown of the financial system and engineered at least a temporary economic recovery. The obvious cost of this bailout is well known-- deterioration of the Federal balance sheet.
Grantham explains why he believes the rally will run through next fall.
"In October we enter the third year of the Presidential Cycle, the year every Fed except, of course, Volcker's, helped the incumbent administrations get re-elected. Since 1932, there has never been a serious decline in Year 3. Never! Even the unexpected Korean War caused only a 2% decline. Even when Greenspan ran amok and over-stimulated the first two years instead of cooling the system down - which he did twice, having not suffered enough the first time - he stimulated Year 3 as well. The result was that we entered Year 3 in October 1998 and Year 3 in October 2006 with horribly overpriced markets, and still the market went up, and by a lot."
So far since 1932 the market has had 19 tries to go down in the third year and has never pulled it off, he says.
Grantham believes that the market will move in the next 18 months or so back to the old highs, say, 1500 to 1600 on the S&P, accompanied by an equivalent gain in most risk measures, followed once again by a very dangerous break. If the break comes rates will still be low and thus difficult to use as a way to jump-start the economy. The financial system will still be fragile, and the country's piggybank will be more or less empty.
"We are definitely playing with fire and need some luck."
Another veteran global investor, Mohamed El-Erian, who runs Pimco and has lived through several financial crises, also recently issued a report to his investors. He described the new, dangerous state of today's global economy like this: "The world is on a journey to an unstable destination, through unfamiliar territory, on an uneven road and, critically, having already used its spare tire."
The U.S. used its spare tire to prevent a collapse of the banking system and to stimulate the economy after the subprime market crash. The European Union used its spare tire to help save the euro due to the meltdown in Greece. Having used up its spare tires, it seems to us that the world could probably not cope well with any new crisis.
Another financial heavyweight and famed contrarian, Marc Faber, gave a talk recently at the leading Austrian economic think tank, the Ludwig von Mises Institute. The publisher of the "Gloom, Boom and Doom Report" gave his perspective on the financial crisis and his bleak outlook for the future.
Faber said that contrary to what the "talking heads" are saying, markets are not out of control. It is the central banks that are out of control printing money. As a result, Americans must re-think what constitutes a safe asset. Traditionally ranked from most to least safe are the following assets: cash, Treasuries, corporate bonds, equities, commodities. However, since the Federal Reserve will keep interest rates at zero, cash and long term bonds will be a bad place to hold one's money and equities will also be a risky proposition given the effects of rampant currency depreciation, he says. According to Faber, precious metals are the best place for wealth preservation. In an environment of money-printing and high volatility physical gold is the best thing to own.
Faber says the fiscal situation is much worse than it is made out to be. U.S. government leaders will try to postpone the hour of truth, pushing the problems off for future Presidents and Congressmen.
David Einhorn, president of Greenlight Capital, a hedge fund, and the author of "Fooling Some of the People All of the Time" doesn't think it will take that long for the hour of truth to arrive. In a recent New York Times opinion piece "Easy Money Hard Truths" Einhorn wrote:
Before this recession it appeared that absent action, the government's long-term commitments would become a problem in a few decades. I believe the government response to the recession has created budgetary stress sufficient to bring about the crisis much sooner. Our generation - not our grandchildren's - will have to deal with the consequences.
Einhorn points out that it was once unthinkable that triple A, "risk-free" institutions could fail.
Our government leaders are faced with the same risk today. At what level of government debt and future commitments does government default go from being unthinkable to inevitable, and how does our government think about that risk?
The current European sovereign debt turmoil is a prequel to what might happen in the U.S., he says.
I don't believe a United States debt default is inevitable. On the other hand, I don't see the political will to steer the country away from crisis. If we wait until the markets force action, as they have in Greece, we might find ourselves negotiating austerity programs with foreign creditors...Though we don't know what's going to happen next, the good news for our grandchildren is that we will have to face our own debts. If we realize that our own future is at risk, we might be more serious about changing course.
Before moving on to the technical part of this week's update, we would like to comment on one the questions that we've received this week:
The question is if with existing homes sales number looking like a decline does this generally make the price of gold go down or up.
Generally, the average real estate prices don't change quickly - the price line is rather smooth (please take a look at the real-estate-related charts in the Gold Fundamentals essay for details.) Therefore, whatever the influence of this tendency would be on the gold market, it is very likely that this effect is already discounted in the price. Consequently, if gold market was able to rally significantly during the past years along with declining real estate values, we expect this trend to continue.
To see if our own future as precious metals investors is at risk, let's begin this week's technical part with the analysis of the euro. We will start with the long-term Euro Index chart (charts courtesy by http://stockcharts.com.)
Euro Index
This week, we have decided to begin with the Euro Index for several reasons. First, the resistance level is quite visible this week on the euro chart. As we have frequently stated recently, during the past few months euro has been the real key to what happens in the USD Index each week. This in turn has a direct effect on the precious metals sector, especially gold. For these reasons, the euro is certainly entitled to top billing in this weekly update.
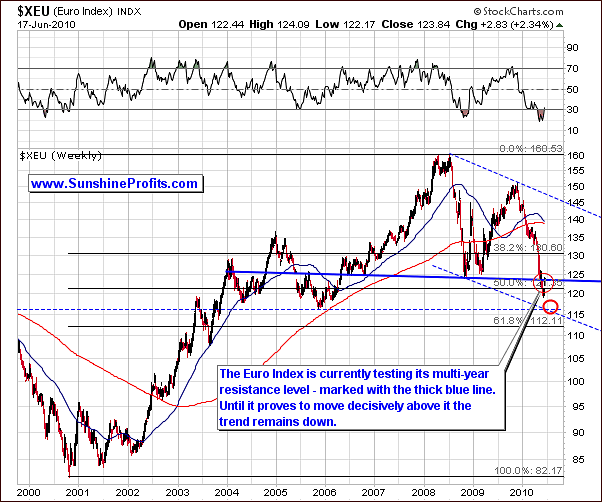
Looking at the long-term chart this week, we see that the euro has begun testing its previous multi-year support level - as marked with the thin red ellipse and the thick blue line. This will result in one of two possible outcomes: either it will break above this line and be back in the medium-term trading channel (visible on the next chart), a bullish sign, or it will fail to break through and decline further. It is possible that we will see a decline to the area indicated by the thick red circle near the 116 level. It seems, at this point, that the latter is more likely and the bottom of this cycle is yet to be seen. There's an old, wise saying "trend is your friend" meaning that it is profitable to bet on trend's continuation until one sees clear signs that the trend has been invalidated.
The reason we feel that the euro will likely decline further is mainly due to the lack of signs indicating an end to the downtrend. Although the euro has shown some strength of late, it is minimal at best (from the long-term perspective) and certainly unlikely to change the direction of this trend. It is very possible, however, that the bottom is relatively near and much depends on what signs develop in the days and weeks ahead. Numerous indices and currencies are approaching critical points in their cycles, and we will continue to watch for the signs which indicate what will come next. At this point the above chart suggests further weakness in the euro. Let's take a look at the short-term chart for more details.
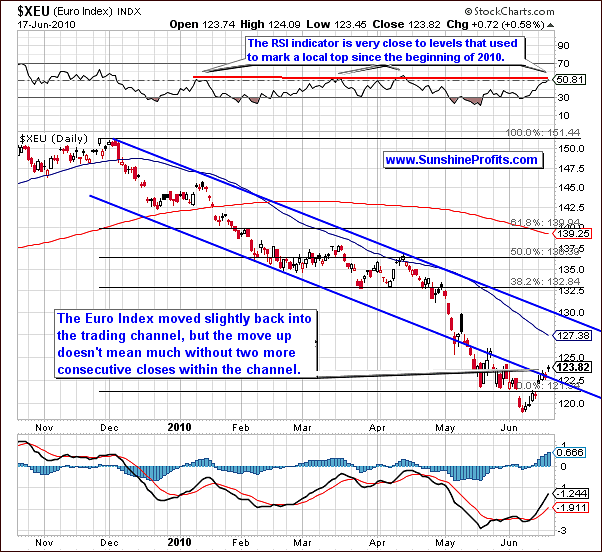
This week's short-term euro chart shows that for one day the euro has broken back into the trading channel. This action is not significant until it is confirmed, normally by three consecutive closes within the trading channel. It is quite possible that this will not happen and therefore the move will not be confirmed. Even if that was the case, but it is done by euro trading sideways within the thing trading range, it will still not provide a buy signal, because of the heavy horizontal resistance level visible on the long-term chart. There seems to be little evidence at this time that the downtrend has been reversed.
The RSI is an important piece to the equation as well. Note that in the short-term chart above, the 50 level has been reached. During 2010, this has normally aligned with local tops in the Euro Index, so there is a possibility that we are at or near a local top today. This would further indicate a probable downward movement in the weeks ahead. Once again, there is not much evidence supporting a move up. Conversely, the move towards the 116 level is still likely, as stated in the previous section.
Summing up, the Euro Index has begun to show some strength in recent days. There is little evidence, however, that this is of any real importance. The strength shown has been minimal and the RSI indicates that a downtrend is likely from here. For these reasons, we remain bearish on the euro in the short-run.
USD Index
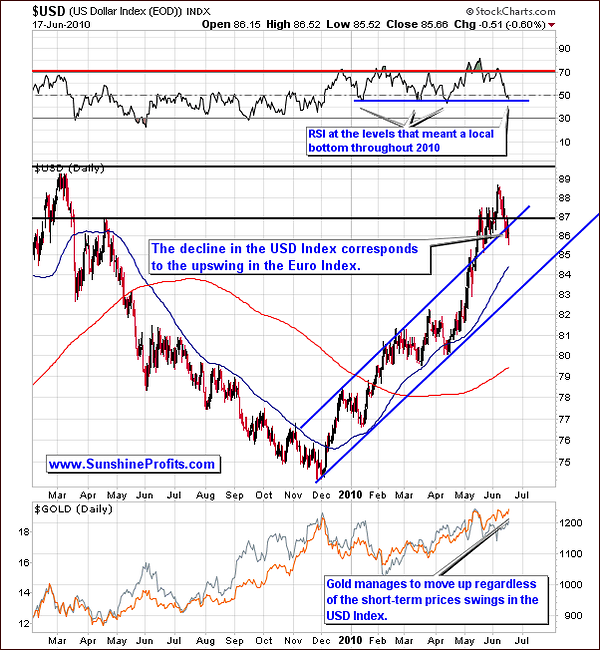
Quite the opposite is true for the USD Index. First, the RSI level indicates that there is a strong possibility based on recent history that a local bottom has been reached. Remember that euro is responsible for more than 50% of the movement in the USD Index, a fact we have frequently discussed in previous updates. So a move upwards here along with a downturn in the Euro Index would be two compatible events.
Although we did see the USD decline slightly this week as the euro trended slightly upwards, gold did not follow suit. This could mean that European investors were not selling their gold based on a stronger euro or they were, but this supply was more than absorbed by increased demand from U.S. investors. Either way, further implications are, therefore, a continued rally for gold.
As unlikely as all this may seem, it is quite normal for abnormal behavior to be seen; that is, the probable effects upon one sector or market are not always what transpires. The pattern which can be clearly seen from a previous cycle will not necessarily be duplicated in the present. Additionally, the interaction of many world markets and former small influence countries on all world economic activity is a constantly changing and innovative development. The future is frequently a function of unseen and heretofore unexpected, unpredictable developments.
This week's downturn in the USD Index did not stop the recent uptrend of gold. This is truly a bullish phenomenon for the yellow metal, and this is in fact the most important technical development this week. Furthermore, the USD moved back into the trading channel has not yet been confirmed by a similar action in the euro. This means that we may, in fact, see higher values of the dollar rather than a continuation of the decline in the upcoming week.
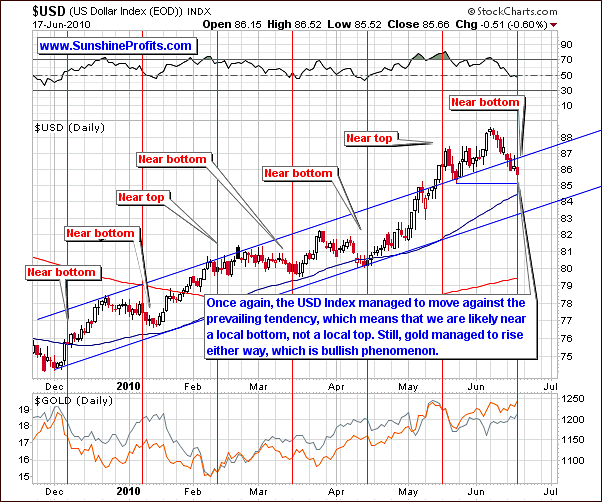
In this week's short-term chart, we can clearly see how precious metals moved higher along with the dollar's decline. The RSI also is at a level, which has previously coincided with local bottoms. This can be seen most recently in mid-April. Although the timing of this trend reversal could take several days or even a week to play out, the point is that we have multiple signs indicating that an upturn may possibly be seen very soon. Additional confirmation comes from the cyclical tendencies present on the USD market marked on the chart with red vertical lines.
In last week's update, we indicated that there was evidence supporting a probable local top for the USD Index. Obviously, the week did not follow this expected trend as the show of strength by the euro, though minimal, did indeed result in slight declines here. Truthfully, all this is really not that important. The real matter at hand and what is most important is the resulting effect upon gold and all the precious metals. The main focus of our weekly updates and Market Alerts is increasing our Subscribers' profits on their precious metals investments/trades.
Gold did indeed rise further this week is spite of the influences between the euro and the dollar. It seems that the investors dealing with whichever monetary unit is declining are reacting by demanding gold. Therefore, there has been constant demand from one side of the Atlantic or the other. This causes us to remain bullish for gold in the near-term. Naturally, we will provide you with more details in the Gold section.
Summing up, the decline in the USD Index appears to have made a local bottom probable in the near-term. This phenomenon simply delayed what we expected and we continue to look ahead to a continuation of the USD's recent rally. Further strength is expected in this index and gold appears to be ready to move higher regardless of the short-term upswings in the dollar and euro.
General Stock Market
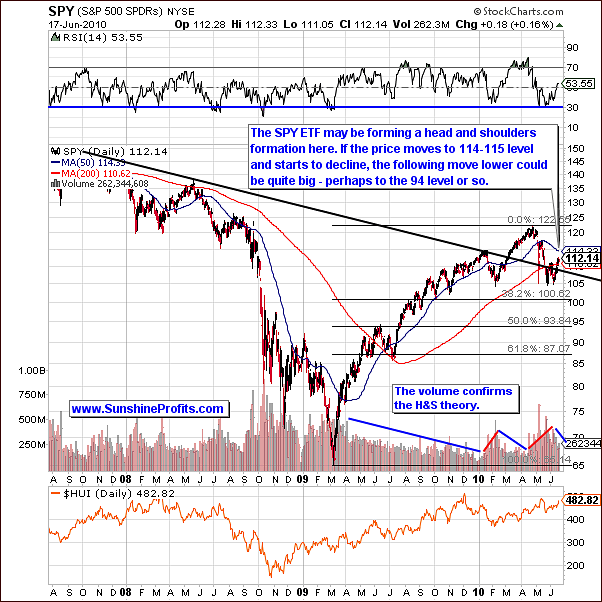
In this week's long-term general stock market chart we see that the lower resistance line has been surpassed with an upward move. The shape of the current chart and the volume patterns as well seem to indicate that we could be seeing the formation of the familiar head-and-shoulders pattern. This is a crucial development if it comes to pass. This would be a strong, bearish indicator for the general stock market and for silver and mining stocks as well. We will continue to monitor this daily and advise our Subscribers accordingly as this becomes more clear in the days ahead.
Here is a brief synopsis of what we will be looking for. If the main stock indices move to levels seen early in 2010, in the range of 114-115 and then decline, this will confirm the formation of the pattern and declining volume along with higher prices will indeed spell trouble. The next confirmation would be to see the volume increase along with lower prices after they reach the 114-115 area.
The range of the future downturn can be estimated by the size of the head or top of the pattern, which also corresponds to the 50% retracement of the 2009-2010 rally - around the 94 level in the SPY ETF. So although at first glance some may be inclined towards bullish sentiment in reaction to recent moves, this is not really warranted at this point in time.
Taking into account the comments made in the first part of this week's update - that the general stock market is very likely to rally in the third year of the Presidential Cycle we end up with the conclusion that the main stock indices may begin to decline in the next few weeks, and move lower throughout the summer only to move up again in the final part of the year.
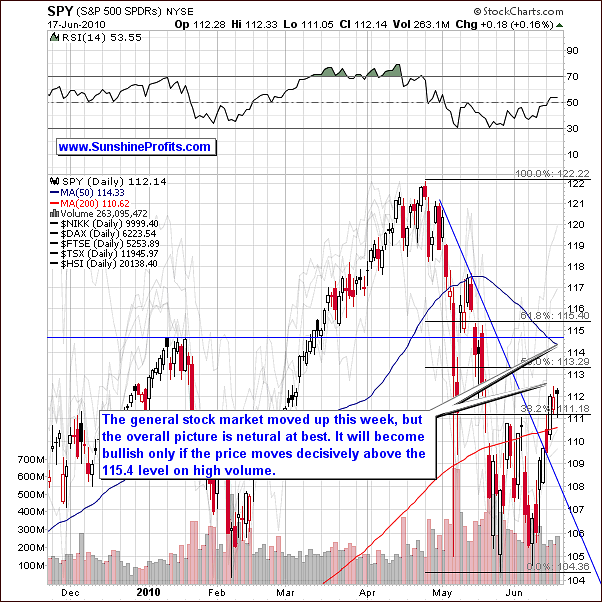
In this week's short-term chart, we see a close approximation to the 61.8% Fibonacci retracement level as a resistance close to the January high, thus making this resistance level stronger. Although we may see slight increases in the coming days, it does not appear that this will be the likely case in the month ahead. Further confirmation of this can be seen on the next chart.
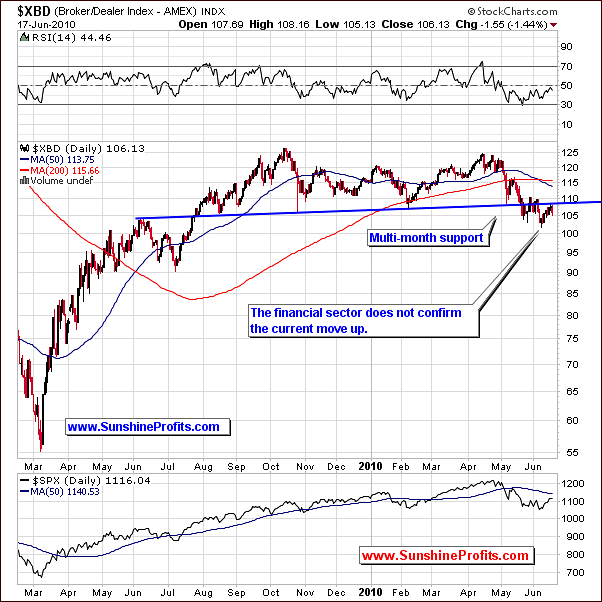
On the Broker-Dealer Index chart, note that the upward move today in the general stock market did not keep the financial sector from declining. Conversely, it moved to its previous support level, and decline afterwards thus further verifying it as a resistance. This is a bearish sign indicating that declines in the general stock market are quite likely from here, but not necessarily right away.
Summing up, the situation in the general stock market may look bullish at first glance. Taking a broad perspective into account and analyzing multiple factors, it appears that the formation of a head-and-shoulders pattern may be in progress. This is not imminent at this point, but since it would have a severe, negative impact on stocks, silver, and mining stocks as well we will certainly monitor it and report to you if we see the strong possibility that any part of the precious metals market will be affected.
Correlations
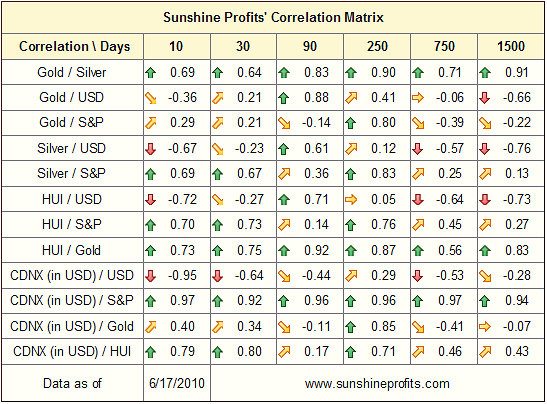
Two factors are worthy of notation in the correlation matrix this week. First, there has been a significant decline in the coefficient for Gold and USD. Previously, both were rallying and there was a relatively high correlation between them. In the past two weeks or so, this has changed. Whereas gold has continued its upward movement, the USD has declined slightly. At this point, this number further supports the strength of gold and the validity of its rally. The yellow metal has strong momentum and is likely to maintain its rally in spite of where stocks and currencies go.
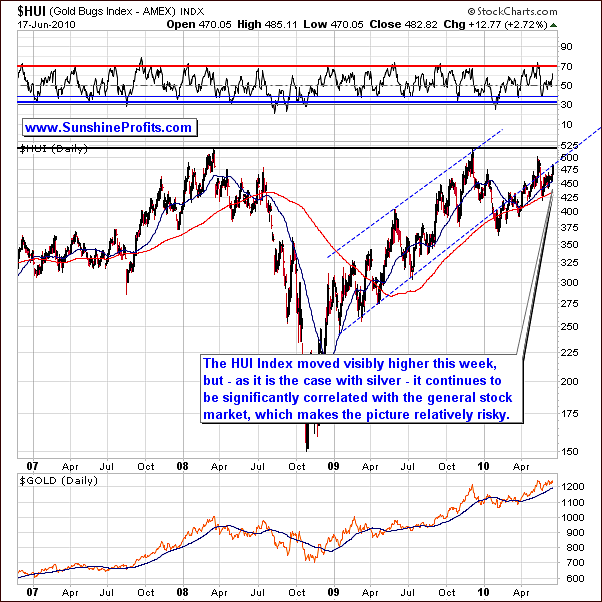
The second observation we wish to make this week with respect to our correlation matrix is the positive relationship seen between the general stock market and silver and mining stocks. The 10- and 30-day coefficients are both close to 0.7, which means that the correlation is strong.
Mining stocks are currently driven, to a comparable extent, by the general stock market and gold. It follows that trouble for the general stock market, a distinct possibility as we have previously discussed, will clearly spell trouble for the mining stocks. At the same time the value of the correlation coefficient between gold and stocks is low - about 0.2, which suggests that any trouble on the general stock market are likely to hit gold in a much smaller way than it would be the case with silver and mining stocks.
We have been steering our Subscribers away from mining stocks and silver for some time now. Gold emerged as the clear choice a couple of weeks ago when considering risk and reward ratios and this is still the case today. If the head-and-shoulders pattern does indeed complete, there may be an inclination to sell long-term investments in silver and mining stocks. This is not yet the case, nor is it advised at this time. However, this is a possible development over the next few weeks.
Summing up, as stated last week, we continue to suggest extreme caution for trades in silver or mining stocks. It does not appear that these markets are the place for speculative capital at this time. Holding gold continues to be preferred over all other precious metals and the mining stocks at this time.
Gold
The recent strength gold has shown allows us to have a very clear picture of the near-term expectations for the yellow metal. The signals gleaned from our charts this week are much clearer than they have been recently. Generally, we are more bullish and will support this sentiment with four charts this week.
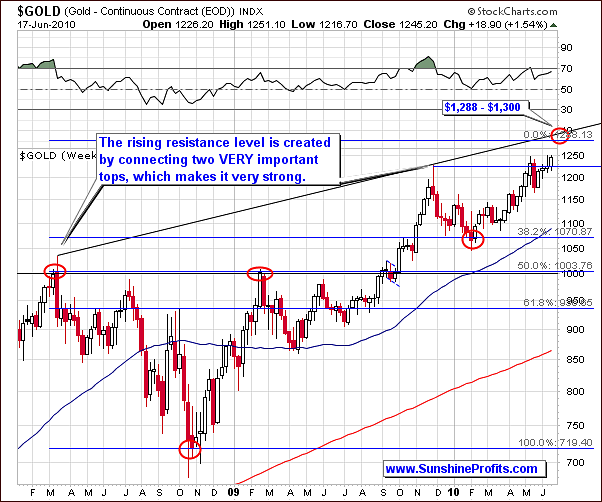
On the very long-term chart above, the multi-year resistance line drawn between the tops in 2008 and 2009 is indicated with the dark line. Applying the 1.618 factor (the Phi number, which is very useful in the technical analysis) yields a target level of $1288 for spot gold. The long-term rising support level would be approximately $1300. This could be our next target area.
The weekly gold prices right now are above the previous high weekly close. This means that if gold does not decline on Friday (and we don't expect it to decline), the weekly close this week would be the highest ever in nominal terms.
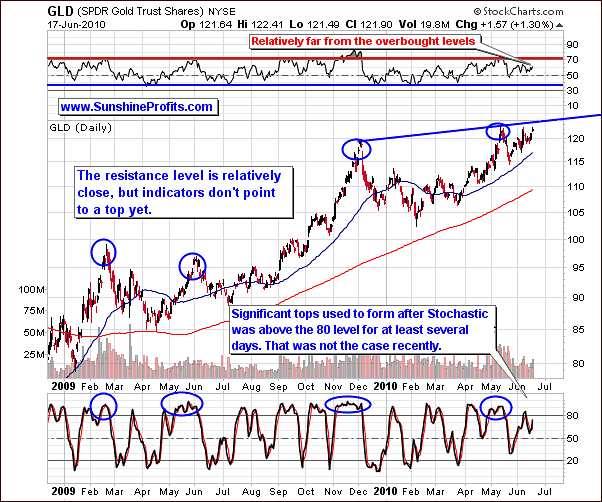
There is a short-term resistance line slightly above were we are today. This is the only negative factor that can be seen at this time, so its impact is limited. The RSI and stochastic indicators both point toward gold moving higher before its next top is in. The stochastic indicator level is not yet above 80, which is typical for a local high. The RSI is not close to its normal market top levels either.
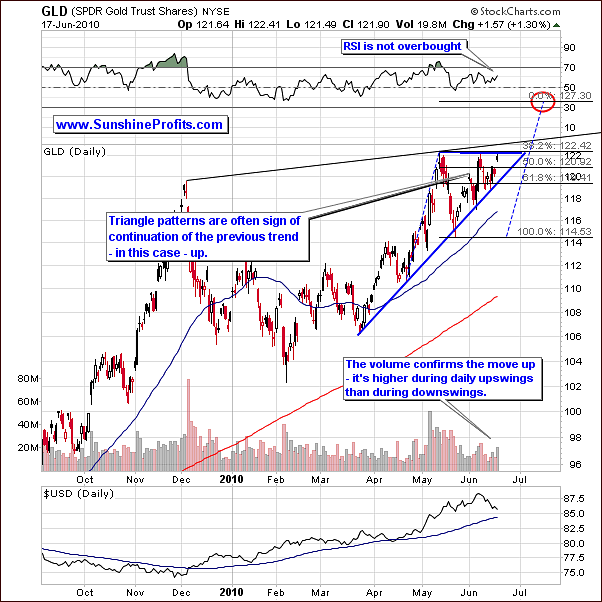
The short-term GLD ETF chart provides us with particularly important details. Volume levels can be seen as quite strong during Thursday's relatively big daily rally. Also, note that higher volume levels are occurring on upswings as compared to downswings. This is a bullish confirmation of gold's rally.
In the past several weeks, we have seen a triangle pattern emerge. Each subsequent low within the triangle formation is higher than the preceding one, and each high is not higher than the previous one. Also, the trading range is narrowing. This is exactly what we have seen recently, and historically, in most cases rallies occur after the price breaks out of the triangle pattern. Moreover, the size of the rally after the breakout is similar to the size of the rally preceding the formation. The mid-April rally projections indicate a $127 level as a target for the GLD ETF, with a $1300 level for spot gold. Additionally, applying the Fibonacci ratios in taking the triangle pattern size into account, we get the same target range.
We, therefore, have several confirmations that gold prices seem to be headed higher. The Fibonacci ratios, triangle pattern definition, the long-term weekly chart, RSI, and Stochastic indicators all give reason to bullish sentiment. Moreover, seasonal tendencies for gold point towards a bottom in mid-June and this is already behind us.
Please take a look at the following charts for details (please note that we've assumed gold beginning the July slightly above $1,255 - this is not our official prediction for this date, we've put this number there to provide you with "real" size of the upswing instead of the percentage one):
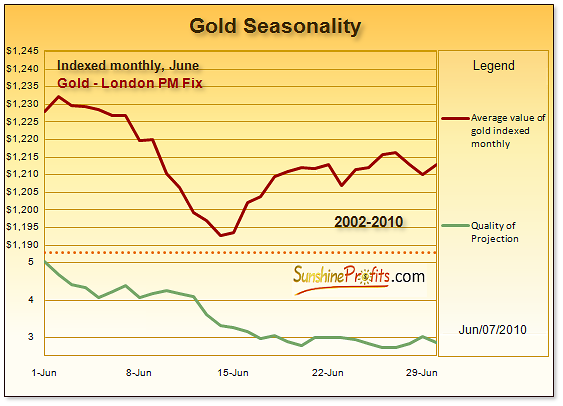
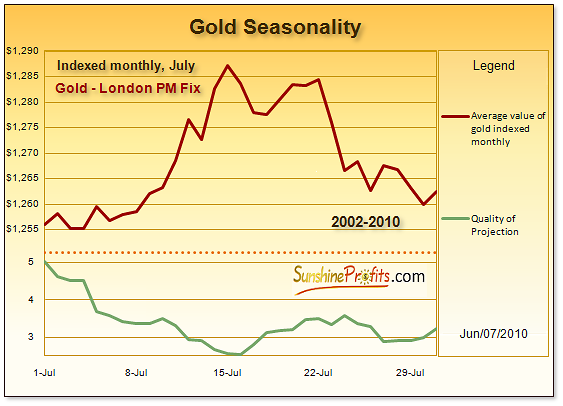
Based on the seasonal tendency patterns, the expected trend is to rally to the end of the month, consolidate at the very end of the month and in early July, and rally around the second week of July with the possible top forming in mid-July or so. This would perfectly fit into our target forecast. We would see gold move to or above the rising support level formed with December and May tops, take a breather, and then move higher to the area indicated by red circle in the above chart. The top could form in mid-July and it could be followed by a regular summer consolidation. This is the most probable scenario based on the signs we have available today.
The reaction shown by gold in relation to movement in the USD index has changed our outlook for the better. There is a huge possibility for a breakout from the triangle pattern to the upside, but this is speculation at present. We do expect to see this soon; if gold rallies strongly today (Friday) - and it is likely to be the case based on today's pre-open action in the overseas markets (markets in the US are still closed at the moment of writing these words) the breakout would be a fact.
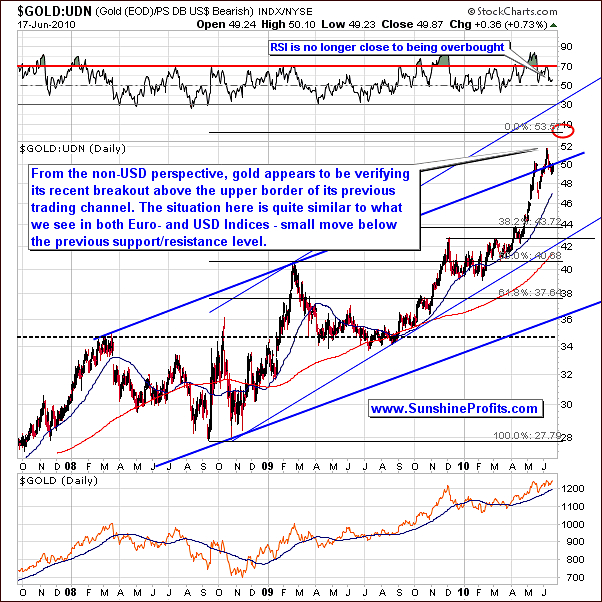
In the non-USD gold chart, which involves the euro, sterling, yen, and which is important virtually from every currency's perspective other than the USD, we're also likely to higher gold prices. This stems from two facts: gold rising in USD, and USD rising against other currencies. The first factor has been covered above, and the latter was covered in the USD- and Euro Index sections. In short, the next target for this rally has been marked on the above chart with the red ellipse.
Yes, non-USD gold moved slightly lower in the past several days, but this corresponds to the similar move in the USD Index, which - as mentioned earlier - at this point seems to be a counter-trend move.
Summing up, last week we were slightly bullish on gold. Since that time, more strength has been shown in spite of the USD decline. This causes us to be even more bullish today. Therefore, our targets for gold are higher, clearer, and point go gold reaching about $1,300 in the next few weeks. Should the implications for gold investors change before the next Premium Update is posted, we will naturally send out a Market Alert.
Silver
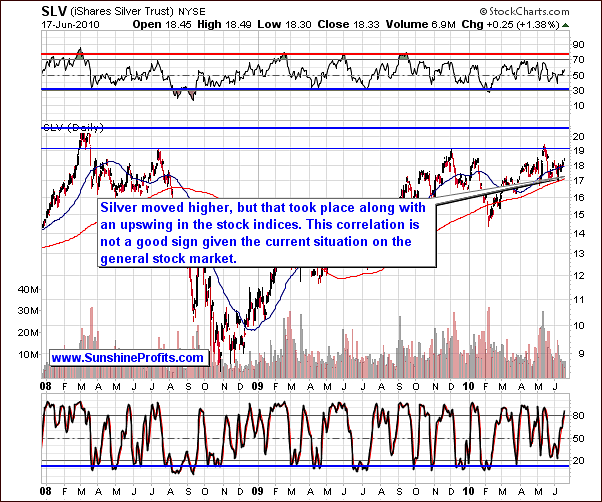
This week, we saw silver move higher but caution against any excitement is still suggested. In short, this move appears to be driven by a general stock market rally. Consequently, the risks previously mentioned for a downturn, if the head and shoulders pattern emerges, would be quite bearish for silver. Although, the white metal did move higher this week, there is still much greater risk here than with gold.
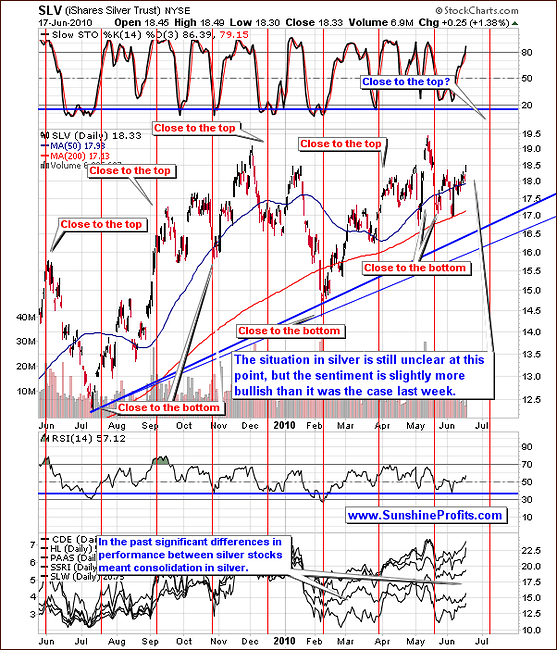
The short-term chart this week provides several details. In the past, when there were significant differences between various silver stocks, we've seen a consolidation. Perhaps we will see this for the next several days.
The next cyclical tendency for silver suggests a local top or bottom in early July. Based on the analysis of the gold market, and the general stock market, it seems that this will be a local top, not bottom. Please keep in mind that silver's cyclical tendencies work on a "near to" basis, meaning that they could easily mean a top in mid-July, as mentioned in the gold section.
One thing, which should be noted here, silver outperforms during the final stage of a rally. This phenomenon is very visible in most rallies and may be attributed to the fractal structure of the market (it's visible in both big and small upswings, but the size of the effect is much bigger in the former). This phenomenon corresponds to what we see in silver on average in July. Generally, gold picks up faster after the early-June decline, and silver doesn't do much until early July. This means that if gold does move higher from here and consolidates at the end of June / early July, it might be a good idea for short-term Traders to switch partly to the white metal for the final-stage catch-up.
At this point there too many "ifs" for us to suggest getting back to silver (in speculative terms), but we may get back to this topic in a week or two. It's a tough call to say where silver could top out if everything goes as outlined above, but our best guess would be to look at gold for a sell signal (around $1,290 -$1,300 in gold). This could correspond to silver around $19.5 or slightly above $20, at its 2008 and 2010 highs respectively.
We will know more once gold breaks out of its triangle pattern. As stated previously, gold is likely to move higher. We will revisit the issue of silver's top at that time and comment on possible speculative moves. The general stock market may keep all of this from happening.
Summing up, silver's direction in the short term is unclear at this time. It does remain more risky due to its correlation with the general stock market. Therefore, gold is much preferred over silver for speculative investors. This may change temporarily if gold breaks out of its triangle pattern. We will revisit this topic should that occur and we see a consolidation after that.
Precious Metals Stocks
The situation here is similar to what we previously discussed for silver. The rally seen for mining stocks recently was largely due to the main stock indices. Betting on much higher prices here is still quite risky. The RSI is slightly above the middle of its trading range today, indicating the possibility of a rally. However, the utmost caution is advised for any speculative trades in mining stocks today.
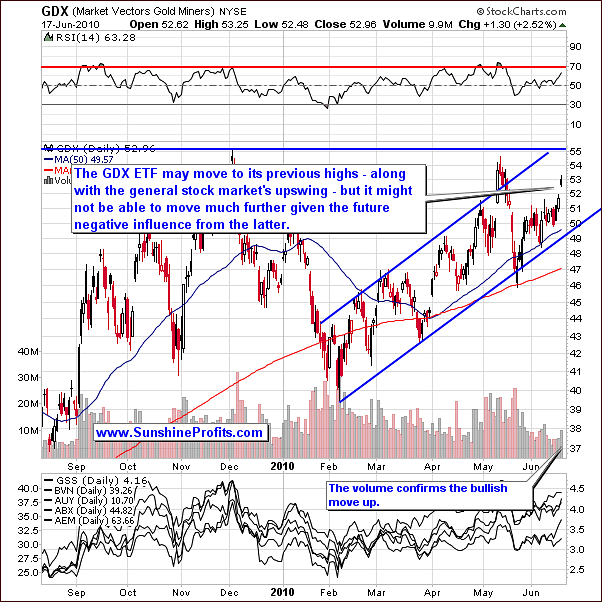
On the short-term chart, we see that we are relatively close to a resistance level. Furthermore, the RSI is not in the overbought territory. Remember, there is a high correlation with the general stock market and the SPY ETF is also close to a resistance level. Both markets could cease to rally relatively soon. Naturally, gold and silver stocks are driven by metals' prices as well, so if stocks decline and gold rallies, we could see mining stocks move higher, but the gains would be much smaller than those made on gold.
The final chart this week will be the one featuring the GDX:SPY ratio, because of its usefulness in timing tops. Since we have seen a strong rally to previous highs the question is if this is the top or not?
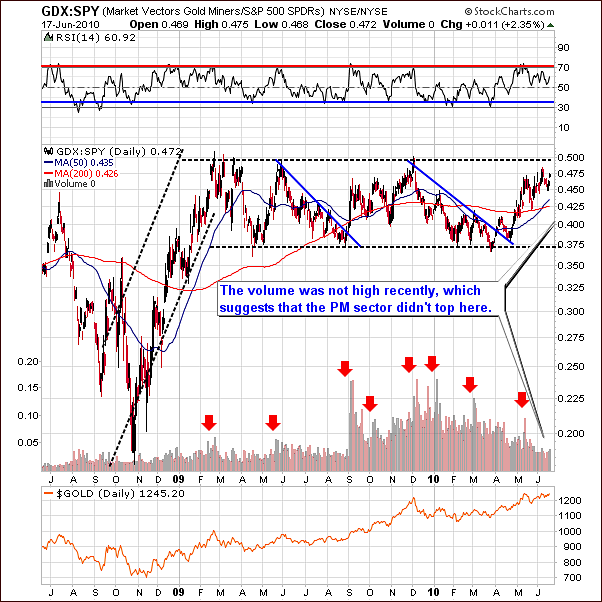
Based on the analysis of other charts we inferred that gold is likely to move even higher before topping out, but a confirmation is always useful, and the GDX:SPY ratio provides us with one. It flashes a "sell" signal when it moves on a huge volume, especially when the ratio encounters a resistance level. None of the above has been the case recently.
Therefore, the above chart does not suggest that any tops are imminent. This means that further rallies are possible for gold, silver, and mining stocks. Again, we caution our Subscribers about the increase risk in betting on higher silver or mining stocks at this time. Gold is much preferred from a risk/reward standpoint.
Summing up, gold is preferred over gold stocks as a trading vehicle at this time. Traders, who wish to speculate in mining stocks - as they don't have the possibility of switching into gold - should consider limiting their investments (perhaps to 50% of what would be purchased if the situation on the general stock market was clearly bullish.)
Summary
The situation in the USD index appears to be euro driven, and the recent move down could possibly be a simple contra-trend movement. The USD seems to be headed upward and euro downward. Regardless, gold, silver and mining stocks rose this week, especially gold, which reacted positively in spite of mixed currency market trends. This shows strength for gold and consequently we revisited our short-term price targets and raised them.
The general stock market short-term appears to more positive then the medium-term, for which the outlook is bearish. This is due to a possible head and shoulders pattern, which, if completed, is very likely to result in a significant decline. Also, silver and mining stocks could be hit hard should the pattern materialize, gold to a much lesser extent. We are, however, bullish for precious metals in the short run (to mid-July), especially gold. After that we could see lower values of gold, silver, mining stocks and main stocks indices during the summer months. Of course we will be monitoring the situation, and report to you if our view on the precious metals market changes.
This completes this week's Premium Update.
Thank you for using the Premium Service. Have a great weekend and profitable week!
Sincerely,
Przemyslaw Radomski

