Welcome to the Premium Update!
There are so many news items affecting gold this week that it is difficult to know where to begin. Well…with the obvious.
Investors clamoring for safe places to stash their money sent gold futures to a record high and silver to a fresh 31-year peak Wednesday. Thursday prices turbocharged as gold futures overcame a weak start to soar past $1,440 an ounce, well on their way to setting a settlement record high…
The precious metals glittered in their roles as havens as euro-zone debt worries resurfaced increasing the anxiety among market participants already jittery about $106 oil, the fighting in Libya, protestors killed in Syria and the nuclear crisis in Japan.
Due to these developments we received several letters asking for a quick comment on whether or not this is a good time to close the speculative long positions that we recommended opening on March 17th, or alternatively, should the size of the position be increased. We sent out a Market Alert saying that although the situation looks bullish we prefer to wait for the breakout before suggesting adding to speculative long positions. At this moment it appears more likely than not that we will finally see the breakout very soon.
Those who opened long speculative positions on March 17th, as per our suggestions, are up over 8% based on Thursday’s closing prices – taking gold stocks (HUI Index) into account.
Now, as to what is making markets so jittery?
José Sócrates, Portugal’s prime minister, offered his resignation on Wednesday night after losing a crucial vote on austerity measures, potentially pushing the country towards early elections and an international bail-out. This lets the Eurozone genie out of the bottle again. Last year's Eurozone debt crises gave us a sampling of the sharp spikes in physical demand we could see in the future as the single-fiat currency experiment in Europe unravels. Portugal’s five-year borrowing costs jumped to new euro-era high of 8.05 per cent ahead of the vote amid investor fears that a political crisis would delay fiscal consolidation and force Portugal to turn to the EU’s bail-out fund. Wider Eurozone debt markets are already showing signs of renewed strains, with Irish benchmark bond yields jumping above 10 per cent for the first time in the Eurozone’s history.
Then we have continued unrest in the Middle East and North Africa which drove up the price of oil.
Also, the ripple effect of Japan’s cascading disasters has caused economic loss in many corners of the globe; from container ships that sit at docks in Japan to luxury goods purveyor Louis Vuitton, shutting down more than 50 of its stores in Tokyo and northern Japan. There are numerous disruptions affecting supply chains all over the world.
Nassim Taleb, author of the best-selling book about the Black Swan Theory, has been avoiding the phone ever since the earthquake and tsunami struck Japan. He had received close to 600 requests for interviews and had refused all but one. Why is he so in demand? Taleb, a former successful options trader, became a celebrity due to his best-selling book about the Black Swan theory, a metaphor for a high-impact, rare, unexpected event that seem obvious in hindsight. According to Taleb, a Black Swan event must answer to three criteria, it must be rare, must have enormous impact and human nature leads us to find hindsight explanations for it and to claim that we could have seen it coming.
There are endless examples in recent history of Black Swan events: the 1963 assassination of President John F. Kennedy, the terrorist attack on the Twin Towers in 2001, or the collapse of Lehman Brothers in 2008, which made Taleb famous because he predicted the subprime fiasco before it happened.
Taleb publish a statement about the Japan tsunami on his website. According to him,
Japanese Nuclear Commission had the following goals set in 2003: The mean value of acute fatality risk by radiation exposure resultant from an accident of a nuclear installation to individuals of the public, who live in the vicinity of the site boundary of the nuclear installation, should not exceed the probability of about 1×10^6 per year
In other words, they predicted no more than one such incident per one million years.
That policy was designed only 8 years ago. Their one in a million-year accident occurred about 8 year later, Taleb wrote.
Taleb continues with various mathematical computations but the upshot of what he says is as follows: Due to globalization of the world economy, the costs of natural catastrophes are increasing in a nonlinear way.
All in all, uncertainty hangs like a cloud over the future of the global and American economy with tsunamis, radioactive plumes, Middle East revolutions, and a new round of the European debt crisis. All these events are bullish indications for precious metals.
Speaking of gold, here’s an interesting item we found in The Financial Times. Iran has bought large amounts of gold in the international market in an attempt to reduce its exposure to the US dollar, according to a senior Bank of England official.
The Financial Times reported significant moves by Iran to purchase gold. It is believed that Tehran has been one of the biggest buyers of bullion over the past decade after China, Russia and India, and is among the 20 largest holders of gold reserves. According to data from the International Monetary Fund, it is estimated that Iran holds more than 300 tons of gold, up from 168.4 tons in 1996. Trades by central banks are often kept secret and there are reports that other Middle Eastern countries had also been adding to their gold holdings.
On another topic related to gold, when the Forty Niners mined for gold in California during the Gold Rush they overlooked at least one good nugget. The biggest gold nugget left over from the area where the California Gold Rush happened sold for $460,000 at auction last week. It was found a year ago in the Nevada County nearby a mining camp that was renowned during the gold rush in Washington, California. The owner of the land discovered the gold nugget in an area that was not mined during the gold rush. It weighs 8.2 pounds.
Since we can’t count on finding an 8.2 pound gold nugget in our backyard, we must be prudent investors. To do that, let’s turn to the technical portion with analysis of the USD Index. We will start with the long-term chart (charts courtesy by http://stockcharts.com.)
USD - Euro Indices
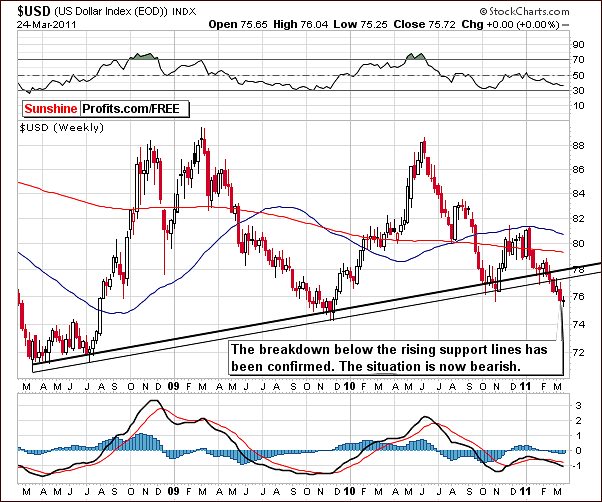
We open this week’s technical part of the report with the long-term USD Index chart. We can see a recent breakdown below the rising support line which is clearly in play. Its support has been invalidated and this level has now in fact become a resistance line. Based on this chart, the trend from here appears to be down, but let’s look at a couple of more charts to further investigate the situation.
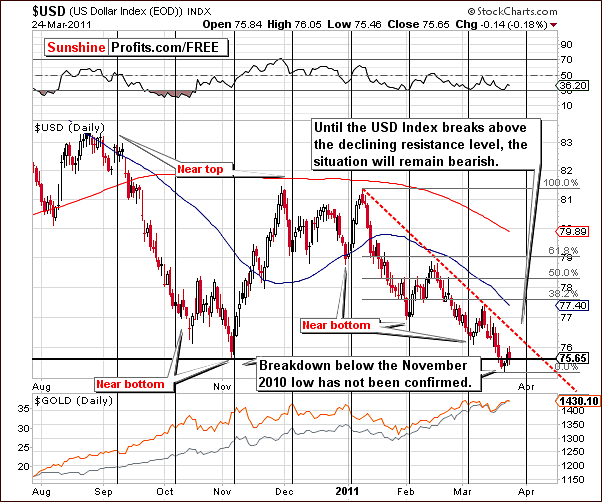
In this week's short-term USD Index chart, the index levels have temporarily moved below the support line created by the November 2010 low. We have not yet seen a confirmation of this move. Index levels are once again above the early November 2010 intra-day lows and this means that a contra-trend rally is likely.
On a speculative note, we may see a fairly substantial rally, possibly to the 78 level or so based on the rising resistance lines from the previous long-term chart, and the Fibonacci retracement levels on the short-term one. Such a move is not likely to materialize until the index moves above the dotted declining resistance line. It is not clear at this time when this can be expected.
Moreover, the RSI level, which is near 30, is in the range of past local bottoms. Although the breakdown below previous important index lows has not been confirmed, we will find further confirmation that the situation here is not all that bearish by looking next at the Euro Index chart.
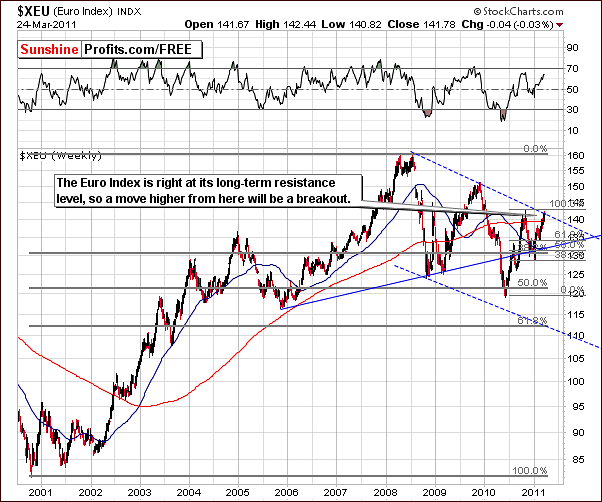
The Euro Index this week has rallied to the declining resistance line formed by the 2008 and 2009 tops. The question now is “Will a breakout be seen?” Furthermore, “Will the index level move above this resistance line and then manage to stay there?” The answers to these questions will likely determine the direction of the next trend in both the USD and Euro Indices.
Summing up, no breakout has been seen yet in Euro Index and the trend seems to remain down. We will wait for a breakout to see if the USD Index declines as a result. With the previously-mentioned situation in Portugal, the European debt crisis is still a factor that could stop the current rally in the European currency.
General Stock Market
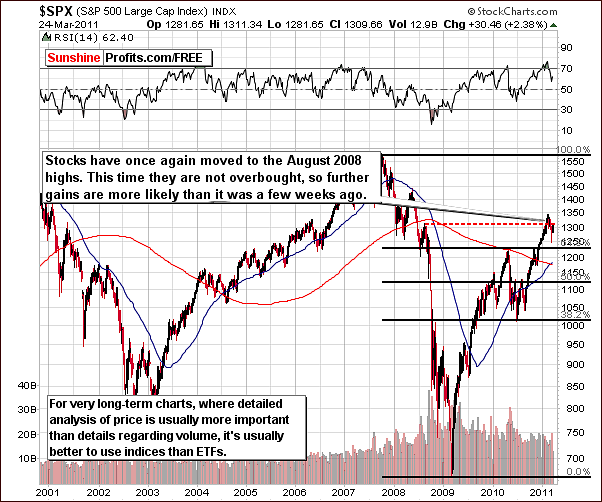
In the very long-term S&P Index chart this week, stocks are trying to move above their August 2008 highs. They have moved to this level but not above it. RSI levels are no longer short-term overbought; the implication is that stocks are now more likely to move higher from the current levels, than was the case just a few weeks ago. The situation overall is mixed with a slightly bullish bias.
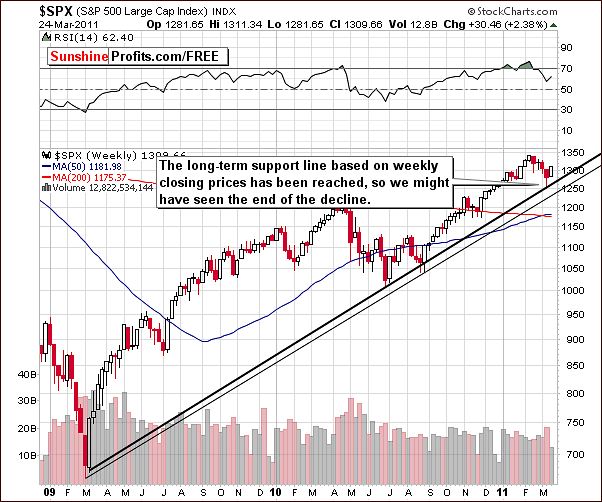
In the medium-term chart this week, we see a further confirmation of what appears to be an overall bullish situation. Stocks have recently bottomed around important support levels and may have, in fact, reached their final bottom.
The world situation, with the G7 pledging to help Japan, will likely lead to more money being created and an inflationary scenario. The situation in Japan now appears to be at least somewhat under control and this suggests that stocks could very well rally from here. It seems that the worst has already been discounted into the price of stocks and that the bottom is in.
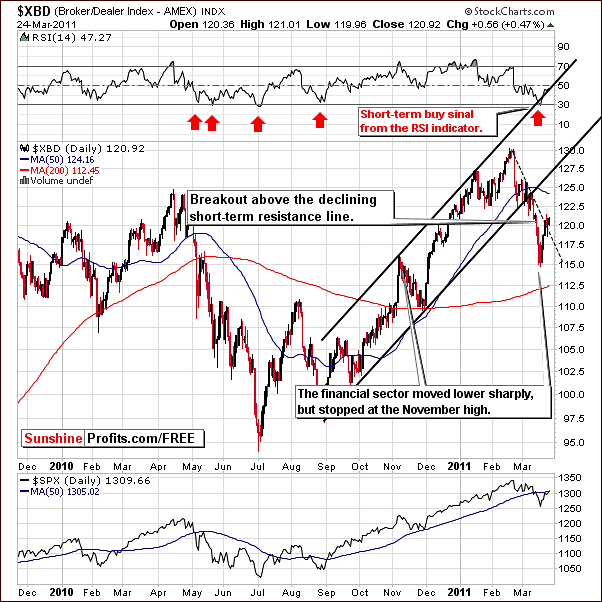
In the Broker-Dealer Index (proxy for the financial sector) chart this week, we also see that it appears to have bottomed. In this case, we’ve also seen a move above the declining short-term resistance line, which is a bullish phenomenon. Since financials are normally a leading indicator for the general stock market, this also bodes well for stocks.
Summing up, the general stock market appears to be set for a bullish period in the coming weeks. The Broker Dealer Index confirms this bullish sentiment.
Correlation Matrix
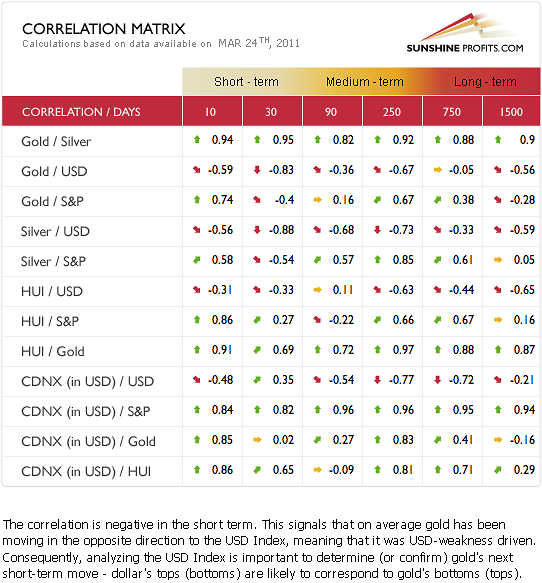
In this week’s Correlation Matrix, we will look at how markets are influencing the precious metals. The general stock market is somewhat positively correlated with silver in the medium term, but the strength of the influence has been weakening. In fact it is negative in the short term.
Gold and silver are currently negatively correlated to a great extent with the US dollar. As we discussed earlier, the breakdown below the rising support line has not been confirmed in the US Index. No breakout has been seen in the Euro Index. All this points to a slightly bullish situation for the dollar, which has slightly bearish implication for precious metals overall.
Gold
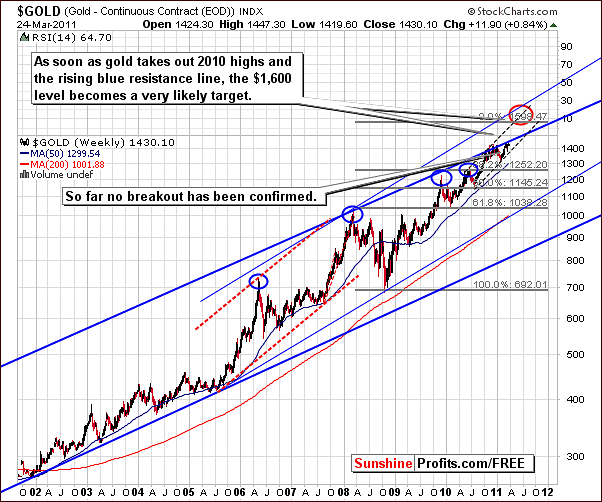
We begin this week’s gold section with a look at the very long-term chart. Gold has been struggling to move above the rising trend channel. No breakout has yet been confirmed above either the upper border of the trading channel or the 2010 highs. Only after these levels are taken out is a move towards the $1,600 target level likely to begin.
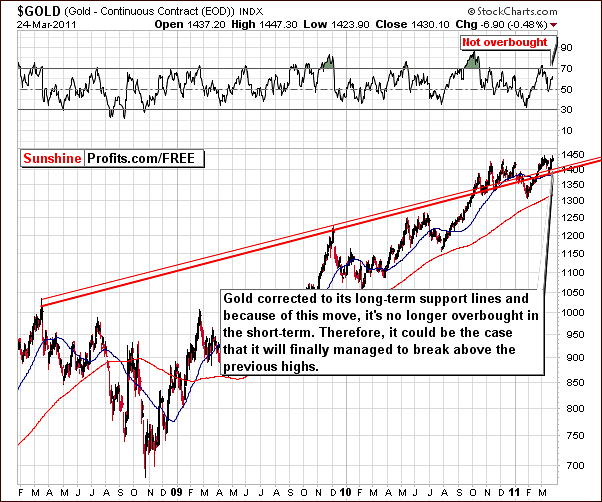
In this week’s long-term chart, we can see that gold has corrected to its previous support line and the move above it appears to have been verified. This is quite a bullish development. RSI levels are no longer overbought as had been the case several weeks ago.
What this means is that gold may finally succeed in breaking out to new highs. With the lack of recent price action excitement, it seems that there is plenty of capital still on the sidelines. This also makes an upcoming breakout quite possible. However, until we see more evidence of such a move, we will not discuss the subject of adding to long-term positions yet. We will cover more on this topic later in this week’s Premium Update.
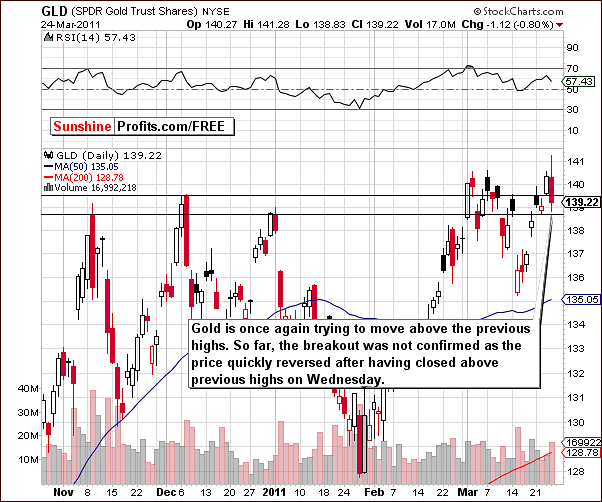
In this week’s short-term GLD ETF chart, it’s also clear that no breakout has been seen. Although Wednesday’s closing prices were higher than those of previous days and price closed above previous closing prices, Thursday saw a decline in price levels after some initial rally was seen early in the day.
A quick glance may lead some to believe that the breakout has been invalidated. What appears to be more likely is that the situation is rather unclear at this point in time. Even with the high volume levels seen in Thursday’s price decline, gold is still above or close to its 2010 highs with a price level above two of the three late 2010 highs. Thursday’s close was slightly above the high seen in December.
Summing up, the short-term sentiment is slightly bullish at this time. If a breakout is seen above previous highs and above the rising trend channel in the long-term chart, this will be a very bullish development. Since this has not been seen yet, caution seems to be required in the days ahead.
Silver
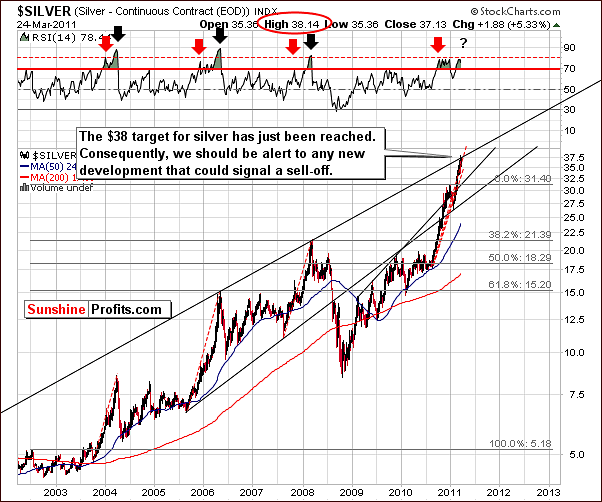
This week’s very long-term silver chart also suggests caution. As was seen in the short-term gold chart, a price move above previous highs recently took place. In silver’s case however, there is another important factor/level which must be considered and this is the $38 resistance level.
We’ve mentioned that the $38 level as a likely target and it will likely provide strong resistance. Please note that $38 is the price that is right at the long-term resistance line created based on the highs seen in 2006 and 2008. These are two of the three most important tops in this bull market, so the resistance level is very important.
Studying similar situations in the past leads us to realize that if a decline is to be seen soon, then it is likely to be sharp. The recent rally has been much in tune with previous rallies. Only the strong rally seen in 2005 to 2006 was bigger. Although an upside move is possible from here, it might be the case that the top is just around the corner. The very long-term chart point to this and these very long-term signals are more important than short-term ones.
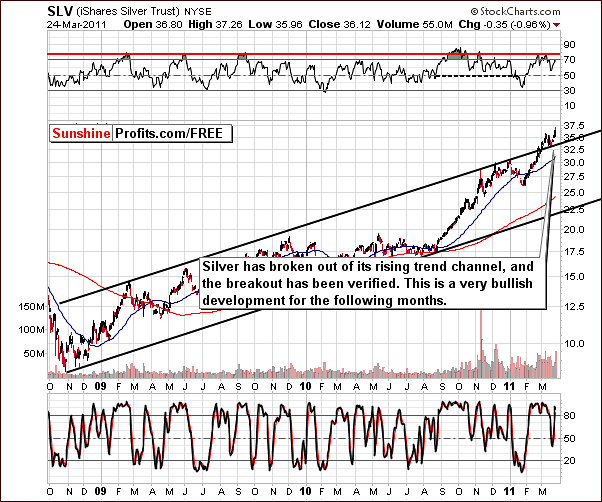
As we zoom in a bit closer and look at silver’s long-term chart, we can see that there are bullish indications as well. Namely, the breakout above the long-term rising trend channel has been confirmed. So, here we have obvious bullish implications. We must keep in mind however, that due to the shorter time frame, these signals carry less weight than those seen in the very-long term chart.
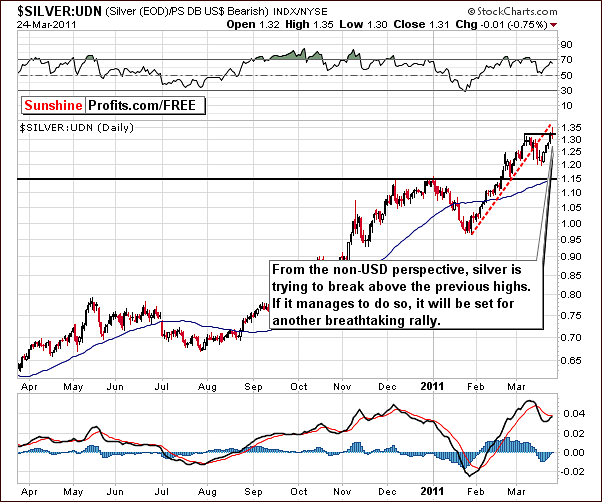
Looking at the white metal from a non-USD perspective, we can see an attempt to break out above the level of previous highs. At this moment the breakout is being verified. We can also see that the move did not go above the rising support line which is now providing resistance. It does not seem, however, that this is all that important. The non-USD silver price could still continue to move higher from here even without breaking above the rising dashed line, as this line is rising as well.
The process of verification is underway and since its outcome is not clear, caution should be exercised at this time. Additional commentary will be forthcoming if we get confirmation of this move in the following days.
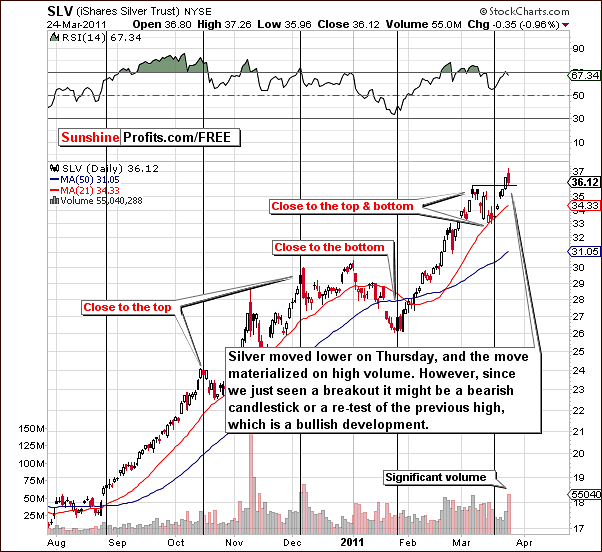
Our final silver chart for this week is the short-term SLV ETF and we have just seen a breakout here. Even though a decline was seen on Thursday with high volume, the fact that previous highs had just been reached and that the closing level was still above prior highs keeps this from being a bearish development. The breakout has not yet been confirmed.
Summing up, silver has recently seen new highs but a very important resistance level has been reached. The new highs, the recent breakout and a move above the long-term rising trend channel, all contribute to a situation of extreme caution on any speculative moves at this time. The long-term outlook is positive but the short term is unclear.
Platinum
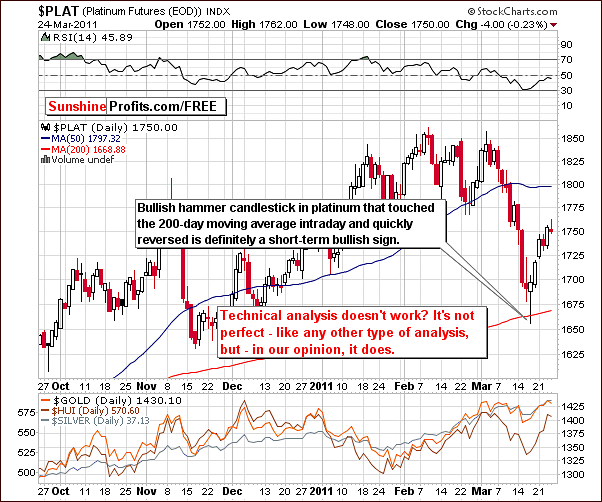
Let’s take a look at the short-term chart for platinum once again this week. While it does not have important implications for the following days, this chart is being included to clearly show the benefit that technical analysis can provide. Long–term readers of Sunshine Profit’s publications are confident in the validity of technical analysis but many opposing views are often seen in the financial pages.
This chart is a perfect example of an important and valuable technical signal (actually combination of two of them). The “bullish hammer candlestick” pattern touched the 200-day moving average and prices have immediately reversed. More importantly, other precious metals then followed. This clearly refutes the claims of those opposed to technical analysis as being useless. While it’s true that it is not perfect (no way to approach the market is), it works quite often and gives both positive and negative signals in advance of important market moves. Without it, Investors and Speculators simply cannot have the complete overview of the markets.
Gold and Silver Mining Stocks
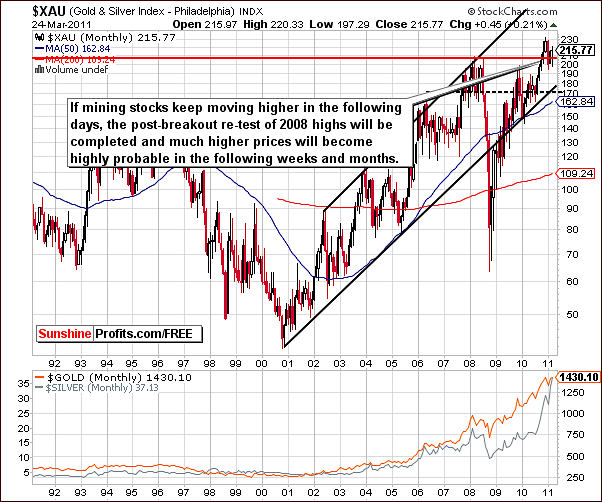
The very long-term XAU Index chart this week shows that the verification of the breakout above the 2008 highs may be completed. We can clearly see a decline back to this previous resistance line and then a move back above it. If the uptrend continues, then the breakout will be definitely in and much higher values will be likely for gold and silver mining stocks in the coming months.
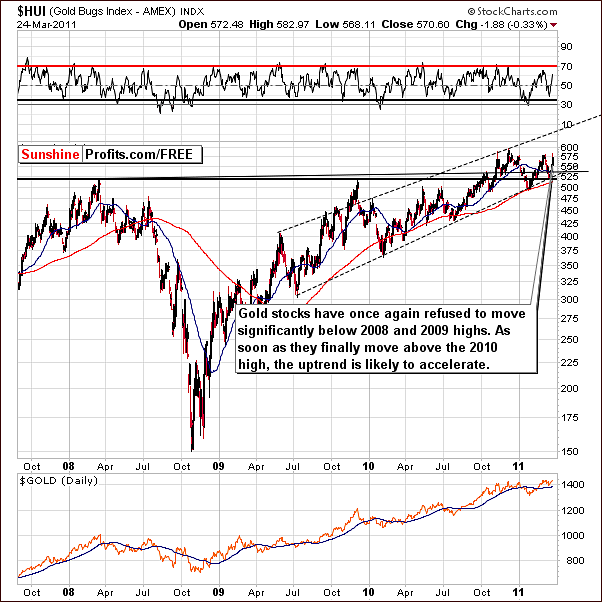
In this week’s HUI Index chart, we see similar signals. Gold stocks moved back to the level of 2008 and 2009 highs but have recently moved back up with vengeance. This is a bullish phenomenon. Once gold stocks move above previous highs, a much bigger rally could be seen.
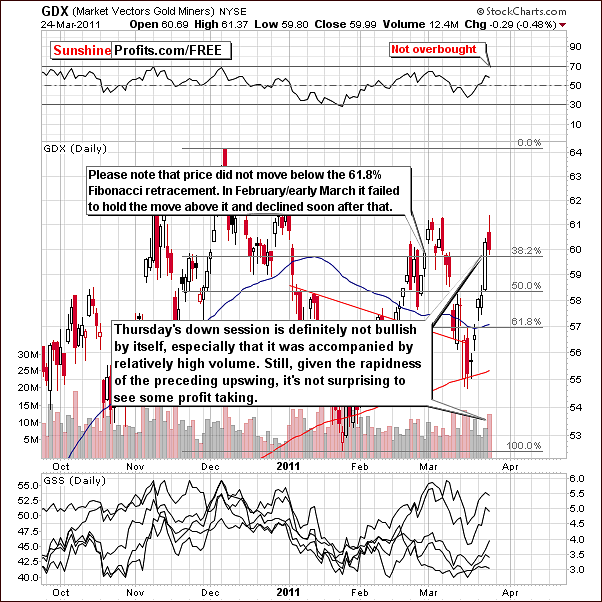
A look at the short-term GDX ETF chart shows a picture that’s not quite as rosy. As we saw in the SLV ETF, gold and silver mining stocks declined on Thursday on relatively strong volume. Taken alone this is a bearish signal.
As was the case with silver however, there is one more factor to consider. Here, it is the 61.8% Fibonacci retracement level. This played an important role in late February and early March as prices dropped only after stocks failed to break above this level. Actually a few moves above the 61.8% line were followed immediately by moves back below it. Back then, we did not see three consecutive days without price moving below this level and mining stocks have declined. Today, the situation could be similar, however so far we have seen the GDX ETF above this important level without a move below it, even taking Thursday’s decline into account.
This provides a bullish bias at this time and taking both above-mentioned factors into account, the situation is mixed at best. The bearish sideways shooting star candlestick and high volume levels are simply not a bullish combination.
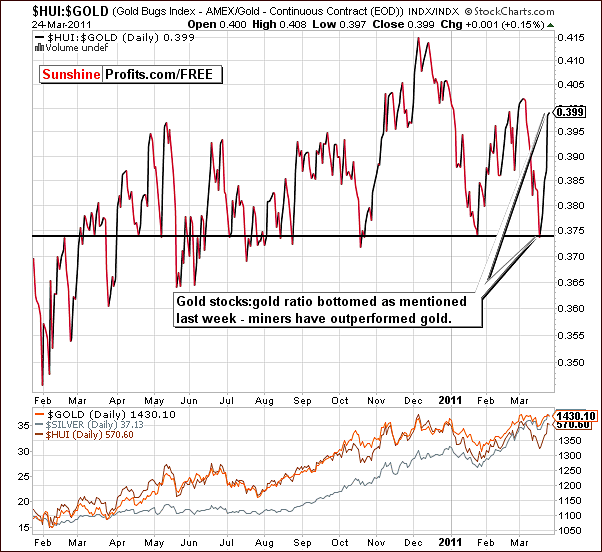
The HUI:GOLD ratio, which measures gold stocks vs. gold itself, recently had what appeared to be a head-and-shoulders pattern developing and we stated that it was not likely to be completed. In our previous Premium Update, we stated that it seems that the pattern between September 2010 and today could be viewed as a head-and-shoulders pattern, but we would take the bearish implications into account only if see a significant move below the current level (below 0.37 or so).
The bearish pattern has been clearly invalidated as gold stocks have outperformed the yellow metal.
Before summarizing we would like to feature one more ratio, as it provides us with particularly important indications.
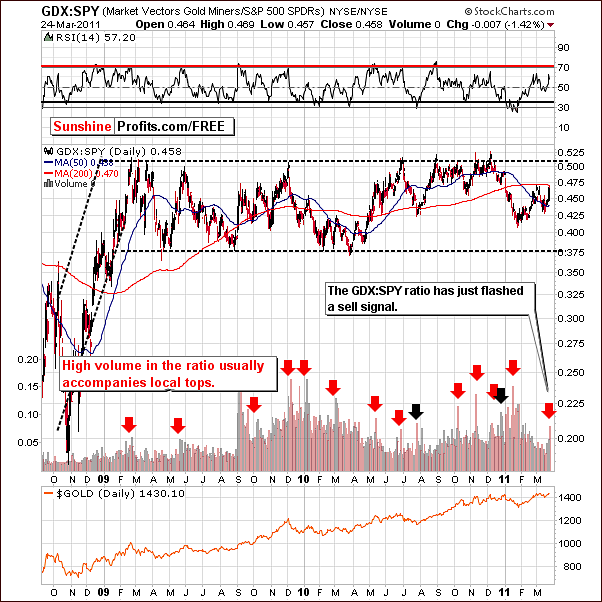
The GDX:SPY ratio measures gold stocks’ performance against the general stock market. The important news is that a sell signal has flashed for gold and silver mining stocks and this is a big deal because this ratio has been quite reliable in the past. Based on its previous performance we believe that it should not be ignored.
The sell signal is generally given when we see a single spike high in the volume levels, meaning that the volume in gold and silver mining stocks has been much bigger than that seen in the general stock market. The quality of this signal is enhanced if the ratio encounters a resistance level as well. Such is the case here, as the 200-day moving average and the early March highs are both in play.
While this is not an overly important resistance level, it has stopped rallies in the past. With the recent spike high volume and these resistance levels in play, the outlook is clearly bearish.
Summing up, taking all the signals we have discussed here into account, it may be a good idea at this time to close the speculative long positions opened on or right after March 17th. It seems to be a good idea to take profits now as the risk going forward appears to be quite high.
The risk/reward ratio no longer favors keeping an open speculative long position. If a breakout is seen in the weeks ahead, the risk will be lower and the time may come to re-enter this position. On the other hand, if the situation turns very bearish, entering short positions may become the option of choice. It does seem best to close these positions now. We will keep you informed as to the topic of reopening additional speculative positions or entering short ones.
True Seasonal Pattern for Gold
We would like to start this section by quoting the request that we have received this week. Would you please publish the true gold seasonality for April? The March one plays out fairly well. So, here we are.
In our Premium Update posted on February 18th, we argued based on our forthcoming tool – True Seasonals (which – unlike other similar tools available on the Internet - presents seasonal price patterns adjusted for the expiration of derivatives) that the price of gold might decline in the second week of March. True Seasonals indicated a possible decline on March 8th and pointed to March 17th as to a possible end of the bumpy period. As a matter of fact gold did decline on March 9th and regained its momentum precisely on March 17th.
However, on February 18th, we did not know what the price of gold would be on March 1st and we assumed that it would be $1379 (the latest available price at the moment – form February 17th). Today the situation is different – we know what the price was on March 1st. Below you will find a comparison of the prices predicted by True Seasonals on March 1st and the actual prices of gold in March (up to March 24th).
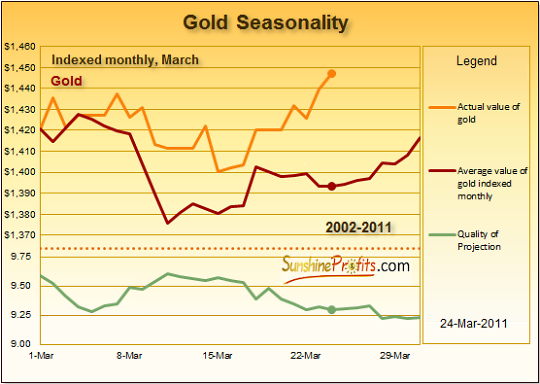
The red line shows prices of gold that True Seasonals had predicted. The orange line presents the actual prices of gold in March. As we can see the actual prices of gold followed closely these forecasts. What is most important is the fact that the actual direction of price changes remained in line with the direction predicted by True Seasonals. All of this makes the seasonal analysis even more interesting for you at the moment.
Having said what happened in the past, let’s shift our attention to the future and take a look at the seasonal chart of gold for April.
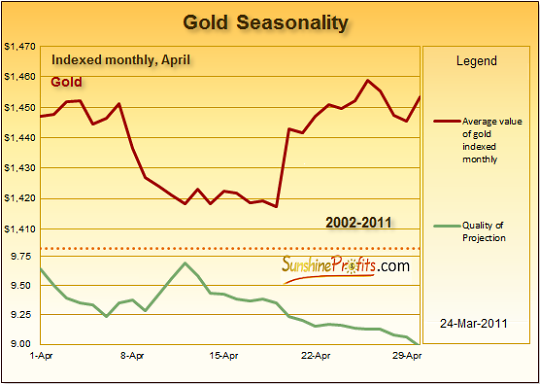
As the price of gold on April 1st is yet to be known, we assume that this price is equal to the last known price of gold ($1447, March 24th). The red line shows you the possible price path of gold in April. The green line (Quality of Projection) presents the quality of the predicted price path at a particular moment. Typically, Quality of Projection ranges from 10 to 0, where 10 indicates that the quality of predicted prices is particularly high (you should include the findings of True Seasonals in your analysis) and 0 indicates that the predicted prices are not particularly reliable (and the use of True Seasonals is only optional).
After this short explanation we can focus on the proper analysis. As we are able to see on the chart, True Seasonals suggest that in the first week of April the price of gold might follow a sideways trend. However, after that declines in the range of 2% might be expected in the second week of the month. From the third week on the situation might turn around – gold might rebound and rise by approximately 3%, this rise stopped in the last days of April.
If you compare the predicted prices with the Quality of Projection, you will see that the latter hits a low of about 9 in the final days of the month. In other words, the predicted prices are of high quality (you should consider including them in your analysis). What is more, Quality of Projection reaches its highest level in the second week of April, which coincides with the period of predicted slumps. This means that it may be reasonable to pay special attention to the progress of events on the precious metals market in this period.
A short recap is in order. True Seasonals suggest that you should remain cautious in the first half of April as falls in the price of gold are possible. On the other hand, the second part of the month might be profitable with predicted gains of about 3%.
At this point we feel obliged to remind you – factors other than seasonality and expiration of derivatives might influence the prices of precious metals. Because of that, we strongly recommend you to keep track of the situation on the market and to make use of our Premium Updates and Market Alerts which will keep you updated on the recent developments.
Letters from Subscribers
This week we would like to begin with question about how we define a breakout. It might seem obvious, but sometimes the obvious things are forgotten.
A breakout is when price moves above the previous high or another important resistance level. In this week’s case, gold has not broken above its very-long-term rising trend channel, even though it has broken above its previous highs. While we're at it, a confirmed breakout would be the breakout that takes place on a huge volume, or when the price consolidates above the level it has broken above for a few days / weeks (in the former case we usually want price to stay above a given level for 3 consecutive trading days). Whether we take days or weeks into account depends on the perspective we use. When making short-term calls, 3 days of consolidation would be sufficient, but when taking into account a 6-month rally for instance, then a few days of consolidation might not be enough for the breakout to be confirmed.
Now we would like to answer couple of questions about Japan. As one of our Subscribers noticed "it would appear considerable rebuilding will be necessary in Japan. Any indications this will impact stocks of companies that export timber products?"
We agree that the rebuilding process in Japan will put positive pressure on commodities' prices, also on timber, if... there is money for that. And we know that there will be money for that based on the recent G-7 decision, so not only is this decision inflationary (in the end even if the powers that be decide not to simply print money at this time, they will most likely be forced to do so later on as they will not have enough cash left for other – domestic expenses), but particularly positive for commodities.
Now let's move to another question about the Japan: "has it not struck you that selling US treasuries will increase the price of Yen relative to US dollars which the Japanese Govt. does not want to see happen. More than likely the Japanese will print money over the rest of this decade to pay for most of the reconstruction caused by the Earthquake and Tsunami. Could be wrong but it makes more sense to me notwithstanding it is bad policy."
Actually that makes sense to us and could very well happen. The Japanese are very well acquainted with quantitative easing. They just about invented the concept. Japan was the first economy in recent times to have tried a full-scale version of quantitative easing for a significant period, well before Ben Bernanke. The Bank of Japan lowered the policy rate to zero in February 2001 and then went to quantitative easing the next month. It ended both quantitative easing and its zero interest rate policy only in 2006. Whether you call it "quantitative easing" or ??????, ryoteki kin'yu kanwa, we tend to think that it makes for bad policy but is good for commodities.
Summary
The euro has reached a long-term resistance line and this suggests a likely rally in the USD Index. The general stock market has been gathering strength and appears poised to rally at least in the short-term.
The implications for precious metals appear mixed with a slight bearish bias. Gold, silver and gold and silver mining stocks showed strength this week but the negative price-volume action seen on Thursday is a cause for concern. This is especially true for silver, which has just reached its $38 target/resistance level.
The risk-reward ratio has turned unfavorable for Speculators holding long positions in metals and gold and silver mining stocks. It appears that recently opened (March 17th) speculative positions should be closed at this time and profits taken.
There will always be another time to re-enter the market when conditions are more favorable. It may be prudent at this time to wait for a confirmed breakout before re-opening speculative long positions. The situation is not bearish but does not appear bullish enough to continue keeping long speculative positions.
We will keep you informed as things develop going forward.
Our next Premium Update is scheduled one day early next week and will be published on Thursday, March 31st, 2011.
This completes this week's Premium Update.
Thank you for using the Premium Service. Have a great weekend and profitable week!
Sincerely,
Przemyslaw Radomski


