
Welcome to the Premium Update!
Anything said or written about the tragedy in Japan must begin with the disastrous scale of the country’s human loss. The people of Japan have suffered thousands dead or missing, hundreds of thousands homeless, whole villages and towns wiped out. It seems too much for any one country to take.
The Japanese are no strangers to catastrophe. They are too well acquainted with earthquakes, typhoons, mudslides and other natural disasters that batter this nation. Japan, which is smaller in land area than California but home to nearly four times as many people, is caught in a vortex of an unimaginable disaster--an earthquake, a tsunami and a possible nuclear meltdown all at the same time.
This past week the economic fallout did not lag much behind nature’s destructive forces. The financial aftershocks gathered force this week as investors fled from assets deemed risky such as stocks, oil and gold (the latter is quite surprising). Amid worries that the crisis could slow down a global economy, investors were also spooked by a 16 percent drop in Japanese shares in the first two trading days of the week. Stock markets slumped around the world as investors sought what they believe to be safe havens, like United States dollars and Treasury Bonds. (We are constantly amazed that people deem these assets to be safe havens.) It is inevitable that most investors will feel the ripple effects of Japan’s disaster in their portfolio one way or another.
Will Treasury bonds benefit in the long run from the Japanese fiasco? There are some good reasons to think that they will not. In fact, it seems very probable that Japan will be a net seller off U.S. debt and equities as the Japanese government and the country’s companies and citizens raise cash to fund the extensive rebuilding that will be needed. Keep in mind that Japan is the world’s second largest holder of U.S. debt. It is estimated that Japan owns about $3 trillion of U.S. stocks and bonds. Japan owns more than $1 trillion in U.S. stocks which is equal to about 6% of the total value of the New York Stock Exchange. Selling off any sizeable portion of that will undoubtedly put downward pressure on American equities. Japan has been buying on average about $10 billion worth of Treasuries per month. The reconstruction effort in Japan will also test its government's ability to borrow. Japan is already one of the most indebted countries in the world.
It appears that if Japan begins dumping its U.S. bonds, the U.S. will have no choice but to raise interest rates in order to attract buyers for its Treasury bills. And it needs to sell Treasury bills in order to pay the interest on its bloated debt and its overstuffed spending programs.
Comparison with the ’95 Kobe Quake
We have seen much written in the press this week comparing this disaster with the aftermath of the 1995 Kobe quake which measure 6.8 and took more than 6,000 lives. In ‘95, the Japanese repatriated back to Japan heaps of overseas investment to pay for the rebuilding effort. The yen surged in value, rising about 25% against the dollar between January and April 1995. Japan’s stock market dropped nearly 20% during the same period as investors pulled out money to repair damage or to buy Japanese bonds in a patriotic move to help the government repair Kobe. Precious-metal prices (gold and platinum in this case) were unfazed by the earthquake but gained strongly with the sell-off of the U.S. dollar. Keep in mind that Japanese insurance companies will surely want to bring some money home to pay for the flood of claims that are awaiting them.
In the wake of last Friday’s tsunami we have seen the yen rising against global currencies and Japanese stocks tanking, the same pattern that followed the Kobe earthquake. While that may have some people scratching their heads in puzzlement, it actually makes sense. Currency traders were betting that the demand for yen would go up as the Japanese government converts some of its vast dollar holdings into yen to finance reconstruction. Additionally, some investors have cashed out of Japanese stocks, thus buying more of the currency. Thursday morning the yen surged to a record high against the U.S. dollar and the Japanese stock market sank again after a U.S. nuclear official warned that the situation at a damaged reactor was more serious than Tokyo has acknowledged. The rise in the yen is not welcome news to an economy already reeling from the quake’s massive damage and disruption, and power shortfalls. The reason is simple. A stronger yen means Japanese-made goods are more expensive for consumers in the United States and Europe, causing problems for Japanese exporters and for the export-dependent economy as a whole.
Also Thursday, in a highly unusual move, the US and the Group of 7 nations announced they will join Japan in an effort to stabilize the value of the yen by intervening in currency markets. The market’s response was an immediate drop in the value of the yen against the dollar, reversing almost a week of sharp increases. The Nikkei 225 also surged on the news. The rising value of the yen threatened to undermine demand for Japanese exports at the same time that a series of disasters has damaged the domestic economy.
It is the first time since 2000 that the Group of 7 nations has made a coordinated intervention into the currency markets, then to stabilize the euro. During the 1990s, the yen and the dollar were also the targets of similar coordinated interventions.
In the aftermath of Kobe disaster, the brief period of yen strength/stock weakness ended and the trend reversed. The yen plunged and Japanese stocks gained 50% in the following 12 months. But at the time of the Kobe earthquake Japan’s economy was significantly stronger than it is today. Last year China overtook Japan at a walk and became the world’s second largest economy pushing Japan into third place. At the time of the Kobe earthquake Japan’s GDP was 17.9% of the world GDP. In 2009 Japan’s economy shrank to 8.7% of the world GDP, that’s more than 51% drop. Japan has an aging population and 20 years of slow economic growth.
The Broken Windows Fallacy
We have also been reading a positive spin on Japan's tragedy that this destruction will be the catalyst for rebuilding that might jumpstart Japan's economy as it did after World War II. This is the belief that the destruction of wealth fuels its creation. We would like to put that one to rest. It’s called “the broken window” fallacy. Frederic Bastiat, a 19th century economist explains this by means of an allegory. It goes like this—when a kid throws a rock at a shop window and breaks it everyone in the vicinity regrets the unfortunate incident. But a man who happens upon the scene points out that this is not a bad thing after all. The man fixing the window will get money for doing so. The money might be spent on a new suit, and so, the tailor too will get money. The tailor will spend money on other items, and the circle of rising prosperity will expand without end.
In the 1946 book Economics in One Lesson, Austrian School economist Henry Hazlitt exposed the fallacy. No man burns down his own house on the theory that the need to rebuild it will stimulate his energies. One cannot argue the massive destruction will be a net benefit to the Japanese economy. Hazlitt wrote: The wanton destruction of anything of real value is always a net loss, a misfortune, or a disaster, and whatever the offsetting considerations in a particular instance, can never be, on net balance, a boon or a blessing.
If the broken window really produces wealth, why not break all windows up and down the whole city block?
The only “beneficiary” for the disaster in Japan might be Australia which exports to Japan essential goods such as iron, meat, sugar, coal and natural gas. And Japan will most likely need coal and natural gas for its energy needs. After the Kobe quake, Australia’s exports to Japan rose by 10%.
With so much happening in the world, let’s turn to this week's technical part with an analysis of the Euro Index. We will start with the short-term chart (charts courtesy by http://stockcharts.com.)
Euro - USD Indices
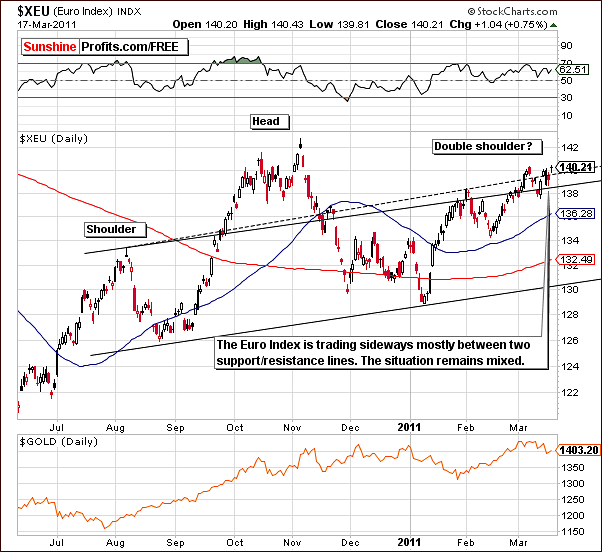
The situation in the Euro Index this week is mixed as sideways price movement has been seen between two important resistance lines during the past week. As a result, there is little to report here and no sign of a breakout has yet appeared.
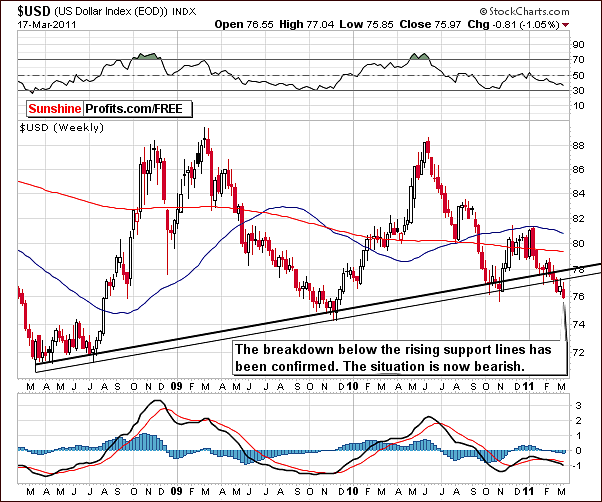
In this week's long-term USD Index chart, we see that the recent breakdown below the rising support line has now been verified. This increases the odds that further declines will be seen from here with the 2009 low the next significant level to be reached. This would be slightly above the 74 level and the next resistance would be slightly below 72 which was the 2008 low.
The outlook is rather bearish and if some sideways movement is seen, followed by further declines, then the situation will turn to clearly bearish. There are no bullish signals here for the time being.
Summing up, the situation in the USD Index appears bearish although not to any great degree at this time. Speculative positions could actually be opened by those particularly interested in FX trading. It’s not a screaming sell for most Investors.
General Stock Market
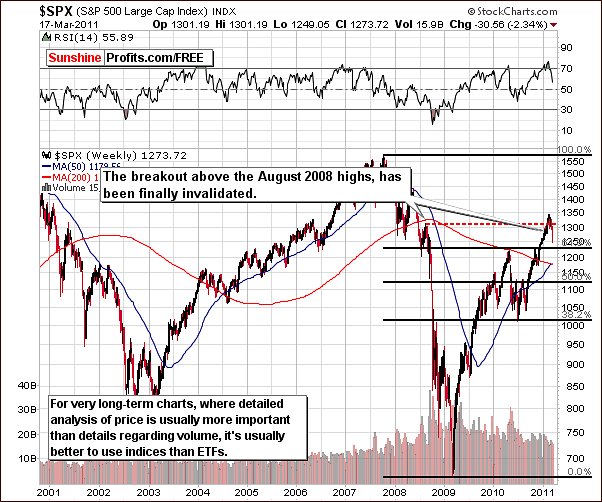
In the very long-term general stock market chart this week, we can see that the trend has been down for the past few weeks. The breakout above the August 2008 highs has been invalidated and a bigger correction is possible at this time. The early 2010 highs close to 1225 for the S&P 500 or even slightly below these levels may be approached in the weeks ahead.
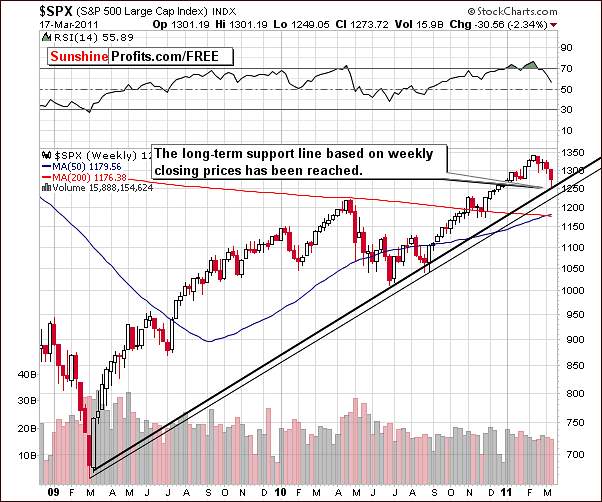
The level of the 2010 highs may not be approached right away since a strong support line formed by the 2009-2010 lows has been reached. The support held and a short-term bounce from here is a real possibility.
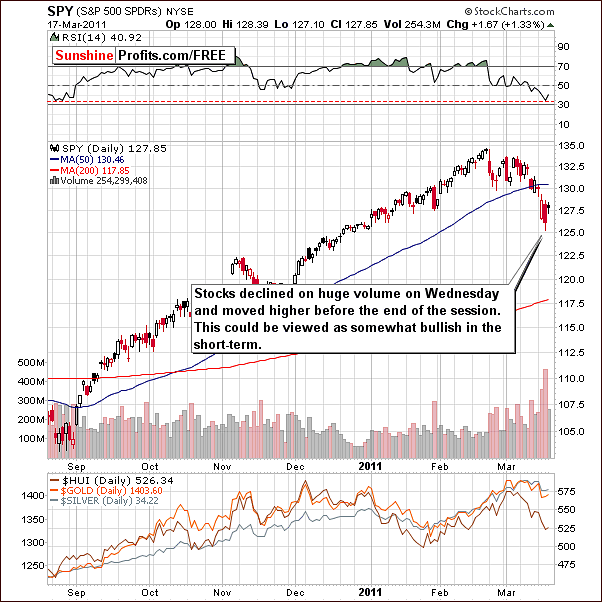
In the short-term SPY ETF chart, we can see that a sell-off on huge volume was followed by rising prices above the levels of intra-day lows late in Wednesday's trading session. A continuation of this trend was seen on Thursday as well, as price stayed visibly above Wednesday’s intra-day low.
Additionally, the much oversold RSI level is nearly equal to that seen last August when the late 2010 rally began. This – combined with the above-mentioned price action - is bullish in the short term. Further confirmation comes from the financial sector.
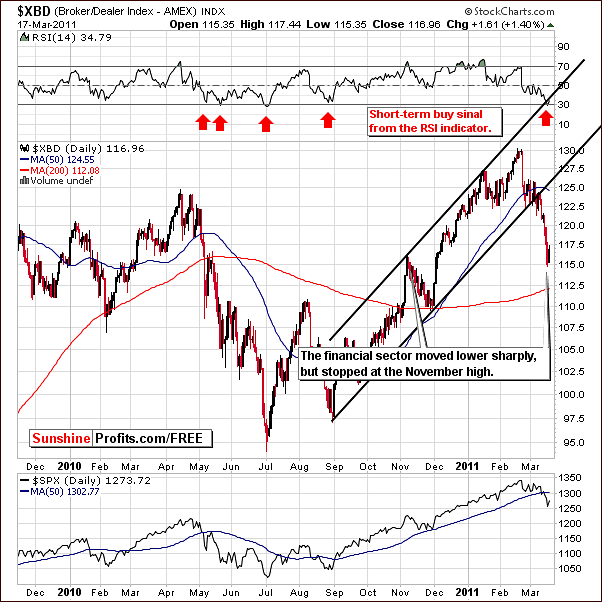
In the Broker/Dealer Index chart this week, we see that index levels have declined to the level of the November 2010 highs. This will likely provide some support and with an RSI here slightly above 30, we may soon see a change of direction and higher index levels.
As we have discussed on numerous occasions, the financials often are a leading indicator of trends to be seen in the general stock market. Furthermore, the RSI level today is quite similar to that seen in local bottoms in the past. This is a bullish signal for the short term for the financials as well as stocks in general.
Summing up, the general stock market is likely to rally in the short term and it is unclear at this time whether a bigger rally has yet begun. Perhaps Wednesday afternoon's uptrend was the start of it but there is still the possibility that we may see a short period of declines before another medium-term rally begins in the general stock market.
Correlation Matrix
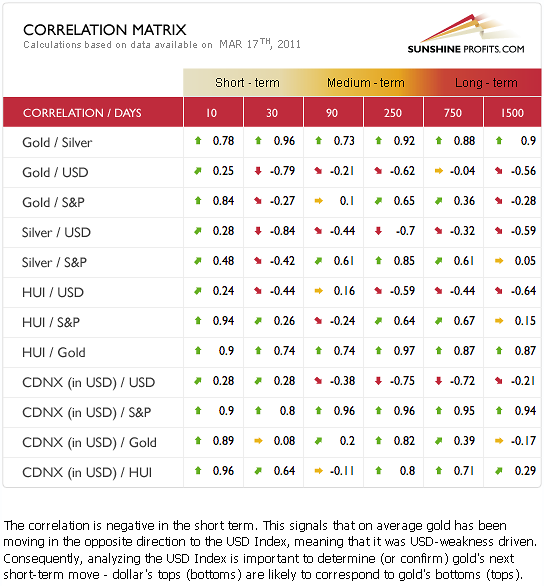
In this week’s Correlation Matrix, some important developments have taken place. In the short term, significant negative correlations are seen between the precious metals and the USD.
The bearish implications going forward for the USD Index will likely mean bullish news for gold, silver, and gold and silver mining stocks. Silver has been somewhat positively correlated with the general stock market in the medium term, but overall, the metals have been rather weakly correlated with stocks in the short term.
Quick bounce in stocks is still likely lead to higher precious metals prices as well (note very high correlation between the HUI Index and stocks in the 10-day column). The implications are not yet clear but they are in place. With the other bullish signals discussed later in this update, the correlation coefficients can be said to further confirm short-term bullish points made in this week's Premium Update.
Gold
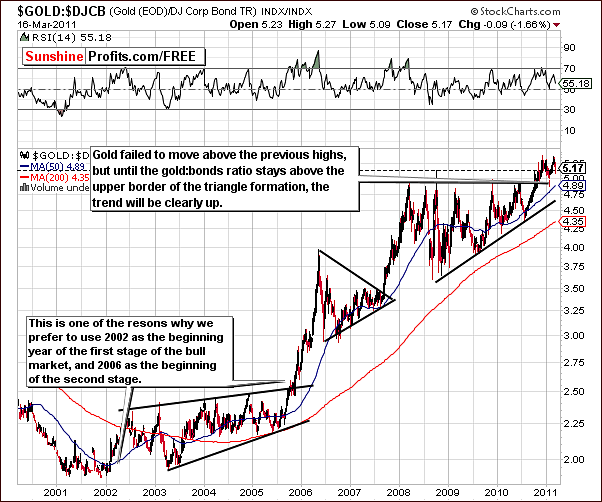
We begin this week’s gold section with the Gold:Bonds Ratio chart. It appears that we may have seen a double top formed above the rising triangle pattern and unless gold declines below the upper border of this pattern, the trend will remain up. Even if it moves slightly below, the uptrend will not be invalidated as long as it remains above the lower part of the triangle pattern.
We are presently a long ways away from the lower level of the triangle pattern and for this reason, it appears that the long-term outlook remains bullish at this time.
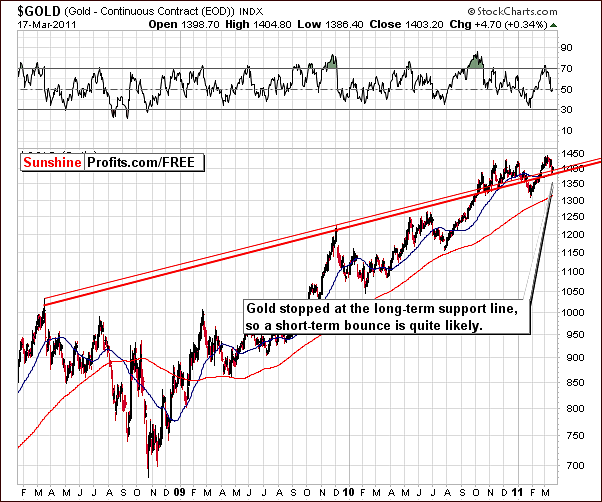
Turning to the long-term chart for gold itself, we see that its price has moved to the long-term support level and bounced a bit. Since this level has been reached, some sideways price action may be seen in the coming days or even an additional small rally is possible from here.
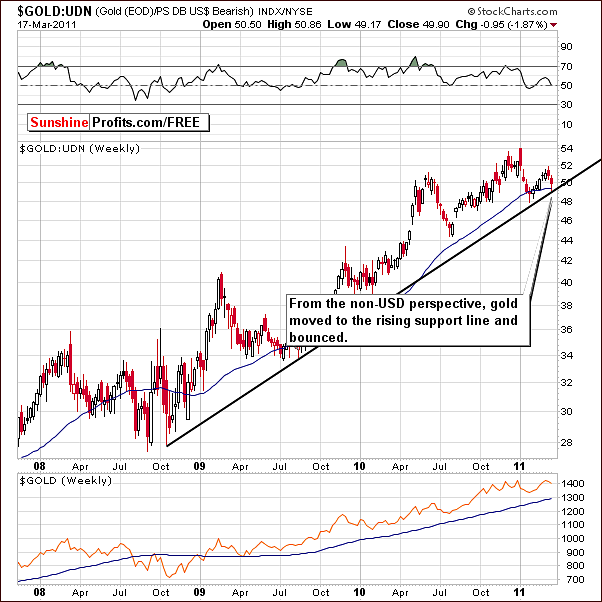
Looking at gold from a non-USD perspective, we see similar trends, although here we have a different support line. The implications are the same and the odds of a short-term move may in fact be even greater. All-in-all, the non-USD chart confirms the bullish points made in the analysis of our previous chart.
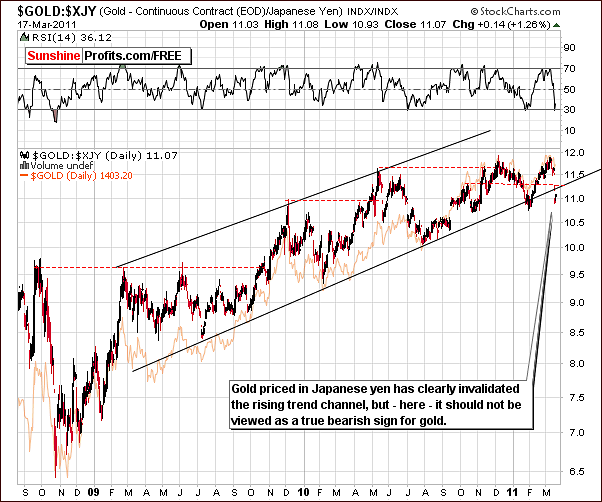
In terms of the Japanese yen, gold has moved sharply lower and is visibly below the rising trend channel. Should this be a cause for concern? Well, remember that technical analysis leads Investors to bet on the emotional patterns of the traders on the whole, buying when they sell and selling when they buy.
Patterns, trends and so are particularly useful when markets move due to emotional factors. Remember – markets are logical in the long run but emotional in the short run. That’s why we use fundamental analysis to establish long-term trend (secular bull market in commodities and precious metals) and then use technical analysis and many other tools for the short- and medium-term price swings. We are using technical analysis because we find it profitable to do so, but we are not technical analysis fanatics, and we realize that it has some limits, just like any other type of analysis – for instance fundamentals won’t tell you anything about the short-term price swings..
The current situation in Japan was not something that people could have expect to happen at this time, and what they could have discounted in the price. It was not a small event either, so it could not be viewed a price noise. The price of gold from the yen perspective declined, but it is clear at this time that it did not happen because gold became less attractive to investors.
It took place, because value of the yen has risen of late and this is in tune with what has been seen in previous periods of calamity in Japan. Such was the case in 1995 and since the yen has withstood great turmoil before, it appears that the long-term perspective for gold is not of great concern at this time.
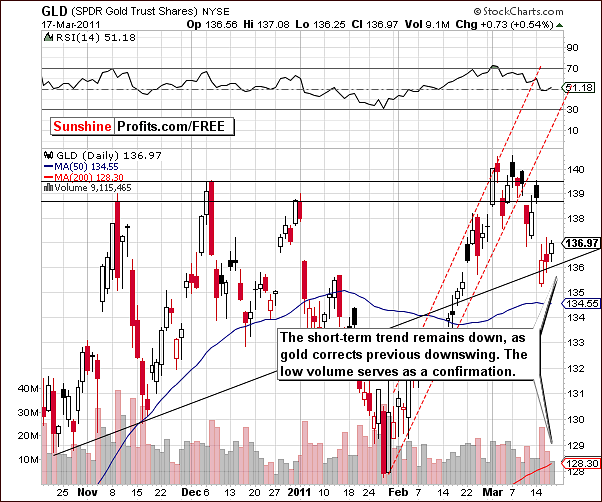
In this week’s short-term GLD ETF chart, we see a recent quick bounce in price levels on relatively low volume. This suggests that the final bottom for this decline may not be in yet. However, at this juncture it seems more important what it does not mean. We will have more to say in the following days, but at this point it does not mean that the post-plunge bounce is over – we could have another rally on even lower volume which would confirm a bearish case going forward.
In fact, based on the situation in mining stocks (as we will explain in the following part of this update), it seems that even if this is a counter-trend rally, it may still have more room to go.
Summing up, the situation is once again mixed this week for the yellow metal as far as the following weeks are concerned. However, the short term sentiment at this point is bullish.
Silver
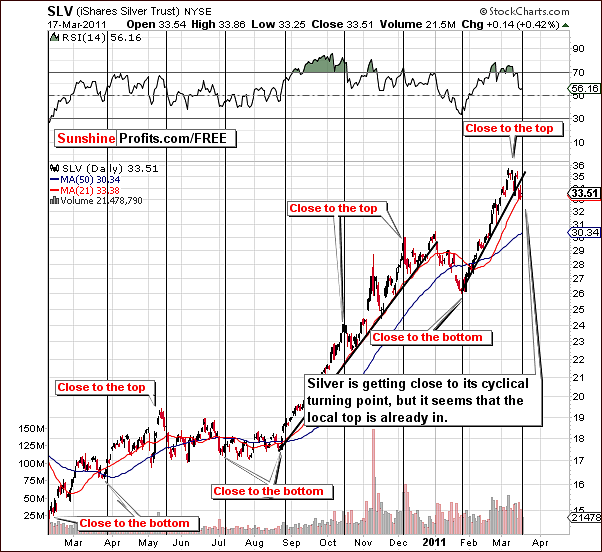
In this week’s silver chart, we see that silver appears to be right at one of its cyclical turning points. It appears that the local top is already in and the normal precision of the cyclical turning points supports this assumption. In other words, cyclical turning points are meant to work on a close-to-something basis, even though there were many times when they were right on spot.
Price levels have moved below the rising short-term support level and this has been confirmed. The trend appears bearish at this time, although a retest of the previous support line may be seen in the short term.
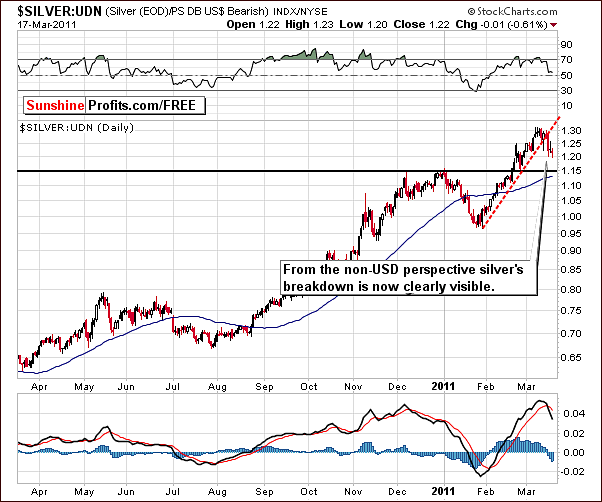
Looking at the white metal from a non-USD perspective, we can see that the recent breakdown has been confirmed. Even if a short-term bounce is seen from here, this will not invalidate the breakdown. It seems quite likely that a bearish trend is in place now and further declines are quite likely – not necessarily in the following 1-5 days.
Platinum
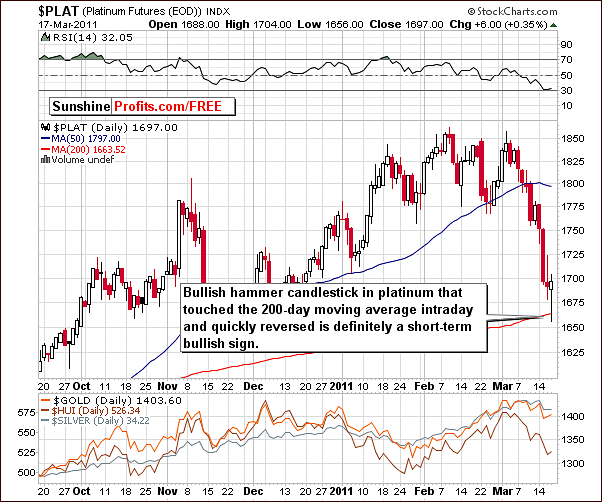
A look at the short-term chart for platinum this week shows what is referred to as a Reverse Bullish Hammer candlestick pattern. The 200-day moving average has been touched and closing prices moved above this level to nearly 1700. This is a short-term bullish development.
This is important because the other precious metals may very well follow suit and show some strength from here. The same holds true for stocks since platinum is primarily used in industrial applications.
Summing up, once again we have some mixed signals with the immediate-term being bullish but the short-term (several weeks) being mixed. Platinum was included this week to show that there still appears to be some positive news in at least one of the precious metals and this may very well carry over to the others.
Gold and Silver Mining Stocks
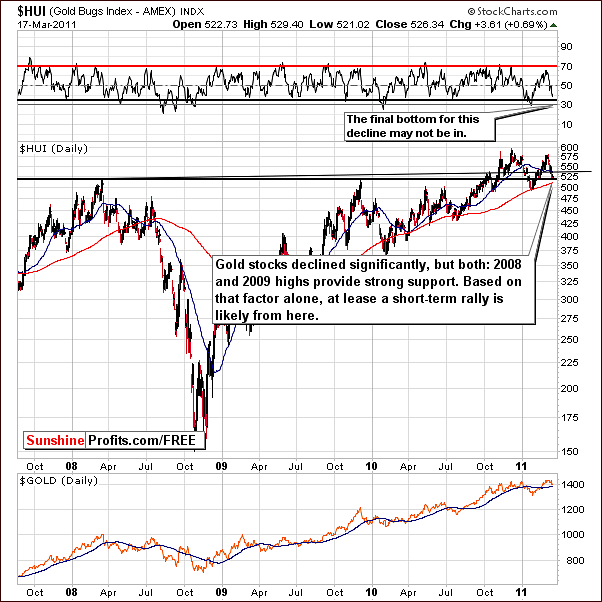
The long-term HUI Index chart is a proxy for Gold Stocks and this week we can see that the latter held above the support level created by the 2008-2009 highs. This – combined with the fact that we have seen a sharp decline recently – would make a short-term bounce likely even if there were no other bullish factors.
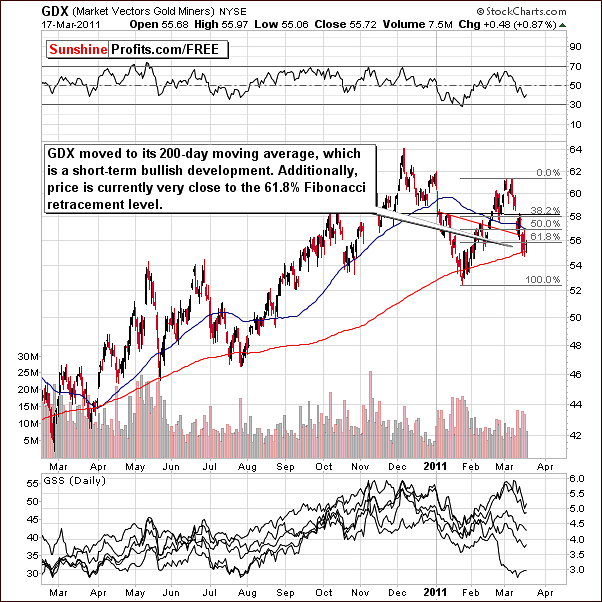
In this week’s GDX ETF chart, price levels have moved to the 200-day moving average and also close to the 61.8% Fibonacci retracement level. A short-term bounce appears likely from here with the lowest likely target level around $58 or slightly higher. We will keep you updated as this situation further develops.
The message in our Market Alert sent on March 17th 2011 is still valid. We stated that speculative transactions in mining stocks appear to be a good move at this point as the short-term trend appears to be quite bullish.
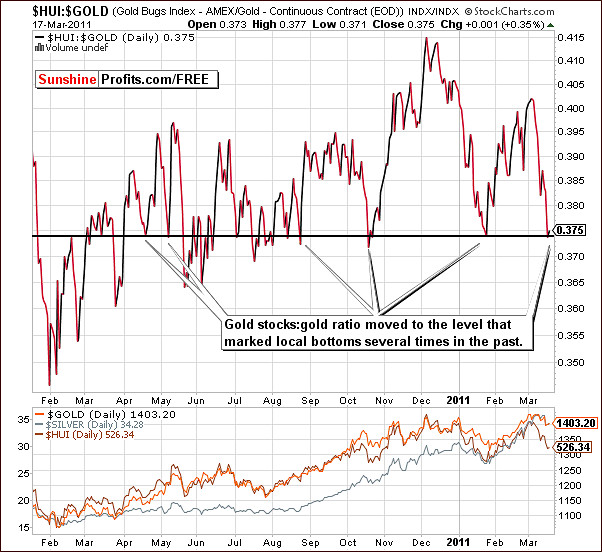
In the HUI:Gold chart, which represents the ratio between gold stocks relative to the price of gold itself, we see that a move to the level of recent local bottoms has been reached. This often coincided with local bottoms in gold, silver and mining stocks as well.
So, since the history often rhymes, we may have just seen a local bottom in the precious metals sector.
It seems that the pattern between September 2010 and today could be viewed as a head-and-shoulders pattern, but we would take the bearish implications into account only if see a significant move below the current level (below 0.37 or so).
Summing up, gold and silver mining stocks appear to be ready to move higher in the days ahead. We will report to you as the situation develops further.
Sunshine Profits Indicators
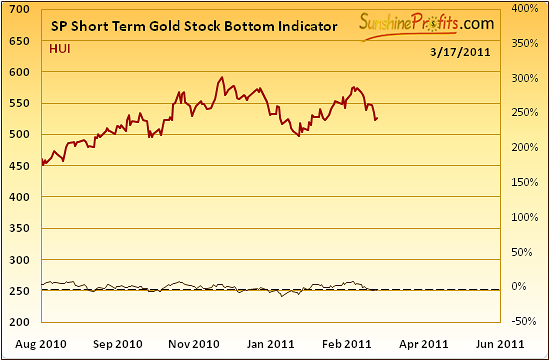
In our Short-Term Gold Stock Bottom Indicator, a buy signal has flashed. The value of the indicator has moved below and then back above the dotted line in our chart. This is valuable information and will be further supported with one more of our proprietary charts.
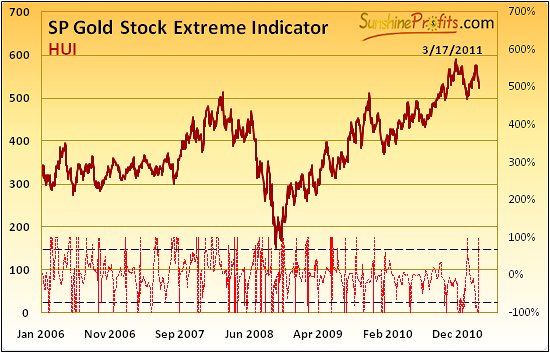
In the Gold Stock Extreme Indicator, we see a quick move above the dotted line. This has coincided with local bottoms for gold stocks every time this line was crossed since 2008. As we can see, not each and every bottom was indicated, but when we have actually seen SP Gold Stock Extreme Indicator flashing a buy signal, each time a short-term rally followed. This happened on most occasions prior to 2008 but every time since. 100% accuracy simply cannot be ignored.
This is valuable information and taken along with other short-term bullish factors seems to indicate that a short-term bet on higher values of gold mining stocks and also on metals themselves is justified at this time.
Letters from Subscribers
We have received a couple of important questions about precious metals this week. We would like to start with the one about Hecla Mining Co.:
A few months ago GSS had a terrible quarter and the stock took a hit. You had several questions concerning the stock, mainly what to do now. You were absolutely correct in telling subscribers to sell it because usually a stock that gets hit like that will most likely still underperform. Great call. HL (Hecla Mining) just had the same thing happen to them, or so it appears. They are ranked as your second pick, GG first. Of course I have recently opened up some call options on HL. What should I do now? Is the stock is likely to continue to underperform?
Yes, the situation in Hecla Mining appears to be similar to the one that we saw in GSS several months ago. Please note that back then we wrote the following regarding GSS shares:
The problem with Golden Star (GSS or GSC.TO) is that its price share is often influenced by factors other than the price of the metals and things like that can (and most likely will) happen. It is not possible for anyone to know all the details regarding all the companies, but that doesn't prevent you from including only the best gold and silver stocks in your portfolio. While you cannot know all the details yourself, you can check how other investors assess this company. If markets are rational in the long run, then all we need to do is isolate the required information from the random price moves; after all, each of them is caused by investors' decisions.
The point is that GSS has a low value of the R-square coefficient, which is another way of saying that its exposure to the price of gold is relatively low. It is very bad from the long-term perspective, not too good from the medium-term perspective (out of the top 10 stocks it has the lowest R-square value), and again the situation is very bad from the short-term perspective. The short-term value is being influenced by the very late move down, but the overall tendency holds. Golden Star is certainly not our first choice when it comes to selecting gold and silver stocks. Consequently, we believe that one should switch from GSS to other stocks.
So now, the question is “which ones?” That depends on the type of investment that you're planning to make - different stocks are applicable for different time frames. Be sure to check our Leverage Calculators and choose stocks from the top of the ranking that have high R-square value (generally you should be fine with stocks, whose R-square value is greater than 70%). Hope this clears up some of your questions and leads you to greater profits.
Moving back to HL - its R-square value is also very low, no matter which perspective you take into account. Taking short term into account, HL is the worst silver stock on our silver senior list. So - as it was the case with GSS - it seems to be a good idea to switch from HL to other stocks, for instance SLW (Silver Wheaton Corp.).
Second question we received this week was as follows:
As a gold investor, I’m concerned that if the crisis unfolds in this manner, the US government could impose restrictions on owning gold as they did in the early 30’s. What is your opinion as to the probability of such an event?
Yes, we agree that the Fed may ban all trading in gold. However, we view this situation as unlikely. If you have your physical silver / gold secure and speculate only with the capital that you can afford to lose, then you should not get too worried.
In this case geographical diversification is the way to go. Allocating your holdings within different countries makes you less vulnerable to possible gold and silver trading ban. Naturally, we must say that it should be done with respect to the law.
Summary
The situation for the US Dollar is more bearish than it was a week ago. The euro has seen little excitement this week as it appears to be trading somewhat sideways. Perhaps more will develop in the currency markets in the week ahead.
The general stock market is likely to rally in the immediate-term, but the medium-term situation remains mixed. It is not clear at this point if the downtrend prevails after this brief rally. The same trends appear likely for gold and silver mining stocks, which means that at least a short-term bounce is likely. We will keep you updated.
As mentioned in yesterday’s Market Alert, We are talking here about a very short-term move, which should be approached with caution. We see placing about one half of what you have used to initiate your trade after January 25th Update to be justified.
Our next Premium Update is scheduled for Friday, March 25, 2011.
This completes this week's Premium Update.
Thank you for using the Premium Service. Have a great weekend and profitable week!
Sincerely,
Przemyslaw Radomski
---------------------------------------
If you are reading this update thanks to a 7-day free-access trial, here is what you need to do to make sure you don't miss a single issue.
Unless you take action soon, you will lose your access to all our Premium sections and services
But first some reasons why you would not want to.
Premium Service Subscribers have made gains of 60% since I first recommended buying San Gold Corporation on March 27th 2009. If you would have used our latest long-term signal to go heavily long gold on April 9th 2009, and the previous Feb 18th warning what PMs are likely to fall, you would have caught the main turning points in the gold market in 2009!
There is no rush like a gold rush, and now is the time that you need all the help you can get to make profits in what history will one day see as a once in a lifetime opportunity. We do it all for you, read the news, follow the markets, analyze the charts and give you all the tools you need to profit in precious metals. We rank the mining stocks, both seniors and juniors, according to your investment horizon and risk preference. Randgold Resources Ltd., which has been featured in the top of our ranking, has vastly outperformed other mining stocks since we first mentioned it in October 2008. This company gained over 230% from its October lows to the June 2009 high. SGR.V, the junior stock, which topped our list, is up 60% in just a few months.
With a subscription to the Premium Service, which costs less than your daily cup of coffee, you will receive Market Alerts in your e-mail when it's time to take action, plus access to the unique Charts (updated daily!), Tools, and Key Principles sections of the website. Premium Updates are posted on a weekly basis before the US markets open on Monday to give you plenty of time to get ready.
So please... Take a moment to sign up right now, as any days left over from your free 7-day trial will automatically be added to your Premium Subscription.

