
Japan was struck by a magnitude-8.8 earthquake off its northeastern coast today, triggering a 13-foot tsunami that washed away cars and tore away buildings. Our thoughts and prayers are with the people of Japan.
This week we will travel around the world and quickly cover some stories that touch on gold. We’ll begin with a stop in:
Mumbai
The Bombay Bullion Association is planning to launch an exchange-traded fund in gold in what is the world's largest bullion spot market. India is the world's largest importer of gold, buying an average 700-800 metric tons annually and the outlook for a gold ETF in the country looks promising. There is also a silver ETF in the works.
South Pacific Islands
This week an Australian miner is due to restart a gold mine in the Solomon Islands as the commodities boom catches up with one of the world's most remote and exotic regions—the South Pacific islands. Papua New Guinea might resume mining in one of the world's richest copper deposits by 2012. The Solomon Islands has been associated with gold since 1568 when Spanish explorer Alvaro de Mendana de Neyra discovered what he believed to be the 'Land of Ophir', which according to the Bible, is the source of King Solomon's gold.
Greece
The cost of insuring Greek debt against default rose to a record after Moody's Investors Service cut the country's credit rating by three notches this week. All this gives us a feeling of Deja Vu. European leaders are scrambling to put together a package of measures to contain the debt crisis that led to bailouts last year of Greece and Ireland and higher gold prices. The Greek Finance Ministry didn’t mince words.
"Moody's downgrading of Greece's debt reveals more about the misaligned incentives and the lack of accountability of credit-rating agencies than the genuine state or prospects of the Greek economy," the statement said. "Having completely missed the build-up of risk that led to the global financial crisis in 2008, the rating agencies are now competing with each other to be the first to identify risks that will lead to the next crisis."
Columbia
There is a gold rush unlike any other now under way in Colombia. The newest front in this country’s forty year war between the government, guerrillas and paramilitary groups is not the vast tracts of coca, the plant used to make cocaine, but rather the country’s gold mines. Due to surge in gold prices, combatants from various sides of the conflict are shifting into gold mining, among them leftist guerrillas and right-wing paramilitary squads. The gold rush here is just a part of a broader mining boom in Colombia, with gold production climbing more than 30 per cent last year. These lawless miners are reported to be using liquid mercury to separate gold from river sediments, causing dangerous pollution. Violence is also part of the story. More than 60 grenade attacks were carried out last year in one Columbian city involving two armed groups vying for control of gold mines.
Saudi Arabia
There are two planned protests organized on Facebook in Saudi Arabia, one for today, March 11th followed by one on March 20th. Protestors would like to see free elections and more representation for the people. These protests could send shock waves across global markets and one can only imagine the effect it would have on oil and gold prices.
Saudi Arabia produces 8 million barrels of crude oil a day, roughly 10 percent of the world’s daily consumption. One fifth of the world’s known oil reserves sit beneath Saudi Arabian soil. Hoping to preempt trouble and calm the public the Saudi ruling class has committed to a $37 billion bribe for their subjects and is expected to announce a cabinet shuffle. They have also offered a 15 percent salary hike for public employees. In any case, the people of Saudi Arabia will probably not have to wait too long for a regime change. King Abdullah is 86 years old and his successor is 82 years old.
Malaysia
A huge construction project here could help determine whether the world can break China’s chokehold on the strategic metals crucial to diverse range of products. China now mines and refines at least 95 percent of the global supply of rare earths and has used this power to flex muscles. But in Malaysia they are building the world’s largest refinery for rare earth metals — the first such plant to be built outside China in nearly three decades. Rare earth metals have become increasingly vital to high-tech manufacturing. Beijing has aroused international fears by wielding that virtual monopoly as a global trade weapon.
Last September, for example, China imposed a two-month embargo on rare earth shipments to Japan during a territorial dispute, and for a short time even blocked some shipments to the United States and Europe. Beijing’s behavior helped propel world prices of the material to record highs — and sent industrial countries scrambling for alternatives.
Ivory Coast
The government of Ivory Coast's presidential incumbent Laurent Gbagbo Wednesday threatened to seize cocoa stocks held by cocoa exporters, and warned gold miners that they could be nationalized if they don't cooperate with the government. A bloody battle for power has been escalating in the West African nation since disputed presidential elections in November.
Singapore
A new exhibit in a Singapore museum shows treasures, including gold and silver, found on an Arab dhow carrying a rich cargo. The ship’s discovery confirms how significant trade was along a maritime silk road between Tang Dynasty China and Iraq. It also has revealed how China was mass-producing trade goods even then and customizing them to suit the tastes of clients in West Asia. So it turns out that globalization is not such a new concept and gold was a hot commodity back then.
China
China's controversial "one-child" policy has once again come up for discussion during the annual meeting of the country's legislature and its top political advisory body, according to local media reports. The policy was introduced in 1980 to try to control China's population growth. Critics say the policy—which limits most couples to one child—has created a rapidly aging population which threatens China's long-term economic growth. The government had originally said the policy would only last three decades. Imagine the future effect on gold if China repeals its one child policy.
The World’s Billionaires
And finally we do a quick tour around the world to see Forbes magazine new ranking of billionaires. No one region dominated the rankings. The U.S. had the largest representation, with 34%, followed by the Asia-Pacific region with 27%. (Ten years ago U.S. residents accounted for about 50% of the list.) The Asia-Pacific region had more billionaires than Europe for the first time in more than 10 years. It also gained the most billionaires of any region, with 105 new billionaires on the list. Moscow is the hot spot today as it displaced New York as the city with the greatest number of billionaires with 79, compared with New York’s measly 58.
Carlos Slim of Mexico remains the world's richest person for a second year with estimated assets of $74 billion including largest mobile phone operator in the Americas.Bill Gates, 55, chairman of Microsoft Corp., was second again as his net worth rose $3 billion, to $56 billion. Warren Buffett, 80, held on to third place with $50 billion. Mark Zuckerberg, the 26-year-old co-founder and chief executive of Facebook, jumped to 52nd this year from 212th place last year. There were a record number of billionaires in 2011, with 1,210, compared with the previous high of 1,125 in 2008. Of the 214 newcomers to the prestigious list in 2011, 54 hailed from China and 31 from Russia.
To see if precious metals will make millionaires of the rest of us this week, let's begin this week's technical part with the analysis of the Euro Index. We will start with the short-term chart (charts courtesy by http://stockcharts.com.)
Euro - USD Indices
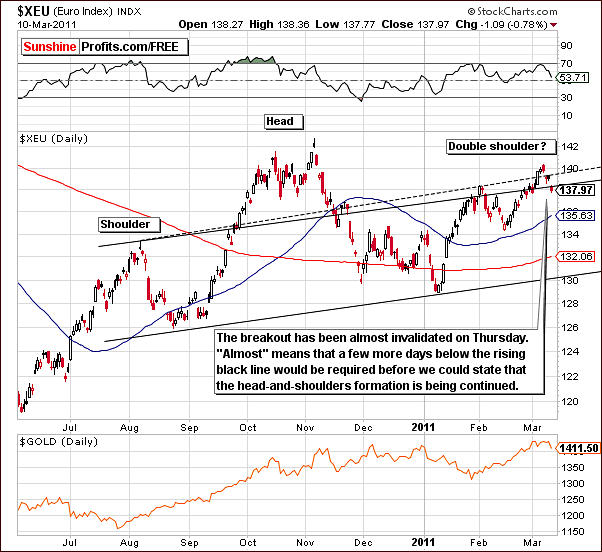
This week, a fairly significant decline was seen in the Euro Index after an insignificant breakout. This means that the bearish head-and-shoulders pattern could still be continued and would have a double right shoulder. This is a very bearish pattern. It could bring the index level down to as low as 120 – if the price gets below 130 that is.
The situation is indeed mixed at this time and the market action in the next few days could be quite important.
The breakdown could be invalidated but it could also be verified. We’ll keep you posted as the currency market price actions often have important impacts upon all other markets. Gold, silver, and gold and silver mining stocks are no exception.
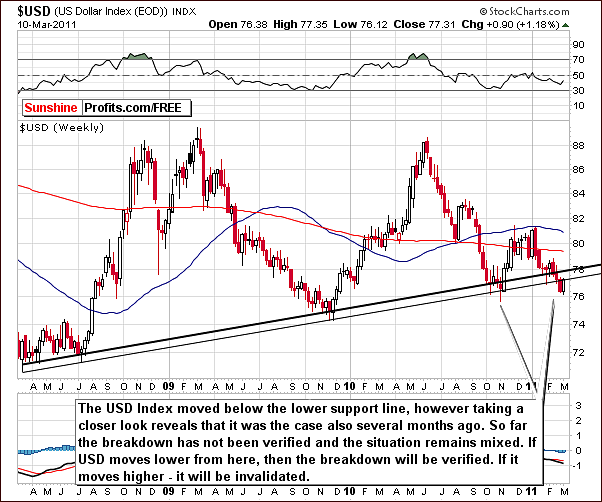
In the long-term USD Index chart, we see a breakdown below the rising support line. This is an important development but is subject to verification before any real conclusions can be made.
If the USD Index rises from here, the breakdown will be invalidated and a rally would likely follow. Otherwise, further declines in the index would verify the breakdown.
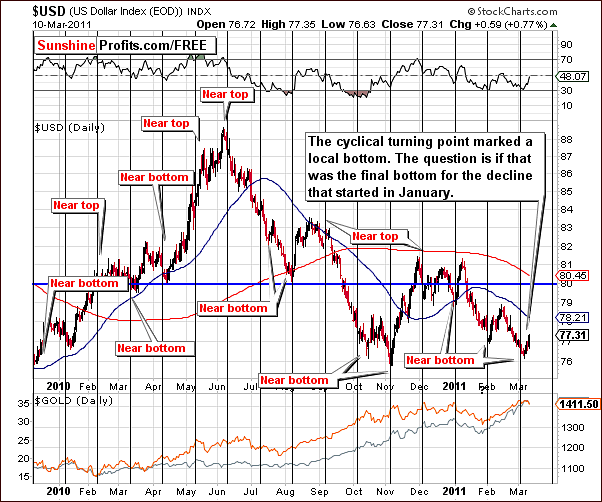
In this week’s short-term USD Index chart, we see that a turnaround took place very close to the cyclical turning point. As we stated in our Premium Update March 4th, 2011, “….the doubts that were present in our long-term chart analysis are backed by the influence of a cyclical turning point likely to be seen very soon. There could very well be a rally from what appears to be an impending local bottom.“
So if, in fact, the local bottom is in, does this mean that the decline in the USD Index which began in January has ended? This may be the case but it is far from a certainty. Note that the USD Index rose after the RSI touched the 30 level. This was also the case in early February and at that time, a rally for precious metals followed. This could happen once again.
On the other hand, the USD Index did not move above the long-term support/resistance line yet, so the situation remains tense.
Summing up, the situation is mixed in the currency markets this week, and the implications for the precious metals are therefore unclear. Based on the US dollar alone, the situation appears slightly bearish for gold, silver and gold and silver mining stocks.
General Stock Market
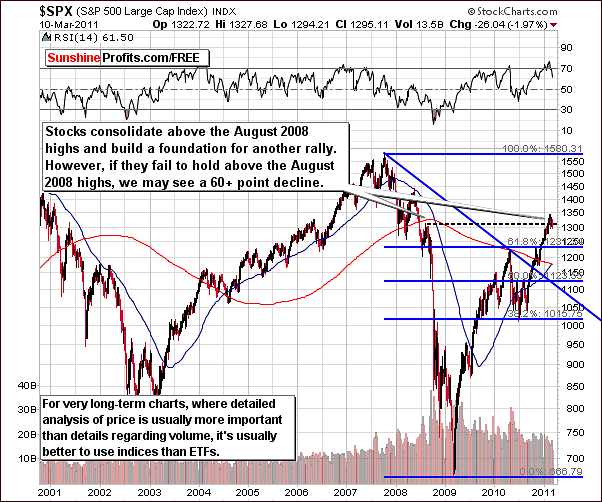
In the very long-term general stock market chart this week, we see that stocks are trying to hold on to levels above the August 2008 highs. If this level is held, we will likely see another significant rally. Otherwise, a volatile decline in stock prices could very well be just around the corner.
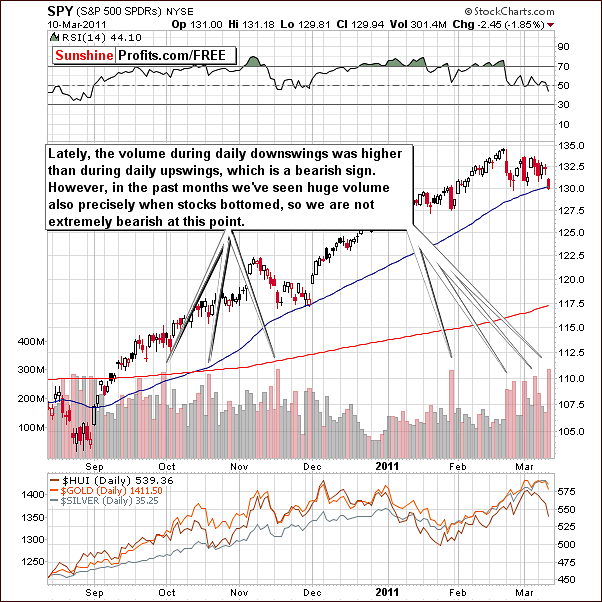
In this week’s short-term general stock market chart, we can see that during recent price declines, volume levels were higher than when prices rose. This is normally a very bearish sign.
However, there’s the flip side of the coin. A single spike in volume with declines in stock prices, however, may in fact be a local bottom. So although we are not bullish at this time, the outlook is only slightly bearish. An additional clue to support the bearish case can be seen in our next chart.
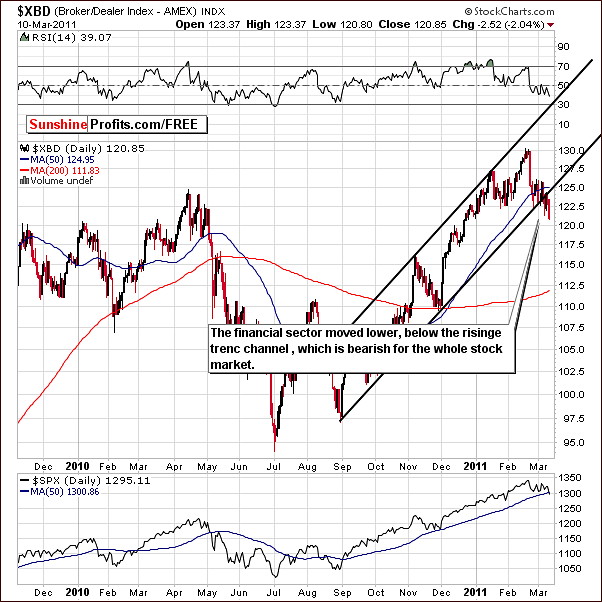
In the Broker / Dealer Index Chart this week which reflects the action within the financial sector, we can see that index levels have broken below the rising trend channel. Normally this index leads the trends of other stocks and therefore the downturn seen here implies that declines will be seen in the general stock market as well.
Summing up, stocks are trying to hold above the important level of the highs seen in August 2008. The medium-term direction for stocks will likely be determined by what happens in the next few days or weeks. The financial sector stocks, which often lead all other stocks, have declined during this past week and this is generally bearish indicator for all stocks.
Correlation Matrix
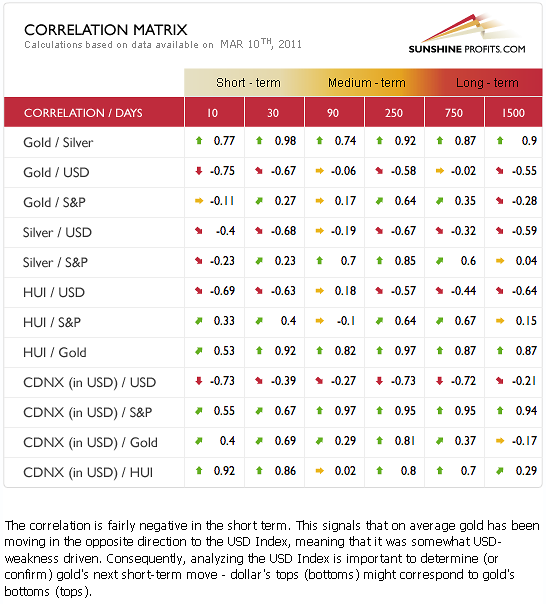
In this week’s Correlation Matrix, very little has changed but we can draw some conclusions from the correlations seen with stocks. Looking at the 90-day column especially, it seems that bigger declines in the general stock market could result in the same across the precious metals sector and especially for silver. Caution is required at this time based on these coefficients, the Broker / Dealer Index Chart, and the price- volume actions in the general stock market.
The USD Index in the short term has moved mostly in the opposite direction of gold, silver and gold and silver mining stocks. These markets appear, however, to move independently in the medium term.
If the situation turns bullish in the USD Index, this could be slightly bearish for the precious metals sector. In the short term, the precious metals appear to move on their own, however if large declines are seen in the general stock market, it would put a negative pressure on precious metals, especially on silver and juniors.
Gold
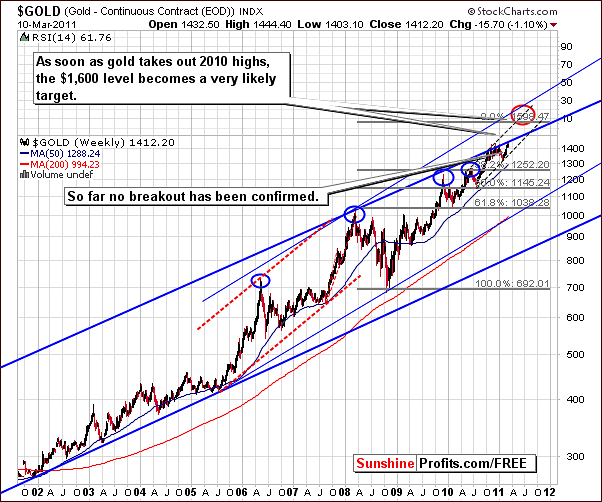
In the very long-term chart for gold, we can see that Thursday’s gold decline is barely visible. All we can say about it is that this can be viewed as evidence that the recent breakout has not yet been confirmed. The $1,600 level still appears to be a viable target (note that it could be reached in May or so – not right away). A single-day decline is not something from which great conclusions should be drawn.
At this point, further moves to the upside do not appear imminent although it is still possible that they could be seen. Confirmed breakout would be required to say that $1,600 for gold is really in the cards and until this confirmation comes to pass, the situation remains somewhat mixed and unclear.
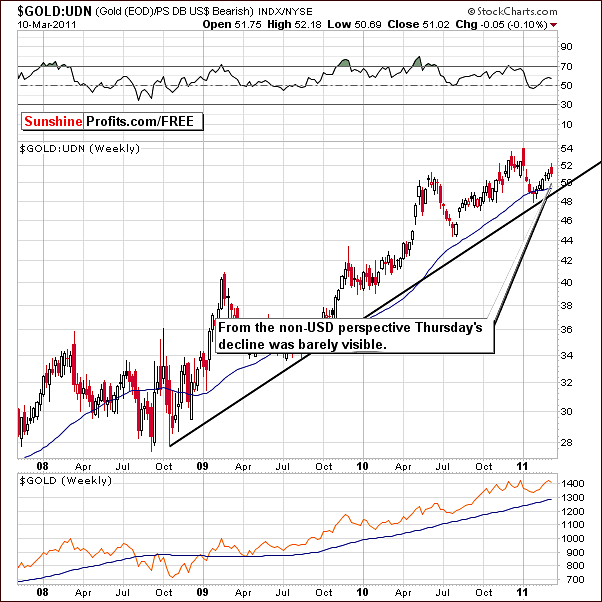
From a non-USD perspective, Thursday’s daily decline is barely visible and does not invalidate the overall rising trend seen recently.
A rally in the USD Index could have a positive impact here as we have stated a number of times, most recently in our Premium Update February 25th 2011, where we said that “Since no rally was seen in the USD Index, there is minimal impact on gold’s price from a non-USD perspective. Once the dollar does begin to rally strongly, and we feel that it will, this ratio will likely catch up in a big way as was seen last April and also early 2009.”
In the previous paragraphs we used the could word, because it’s based on the assumption that the correlation between gold and USD would be positive. However, since the situation is changing in the short term, it seems that the end result could be really small. If gold declines but USD rises, then the decline from non-USD perspective will be smaller, and if gold rises but USD declines, then the upswing from non-USD perspective will also be small.
The upcoming week could yield some important developments in the currency markets and this would likely have a significant impact upon gold from a non-USD perspective as well.
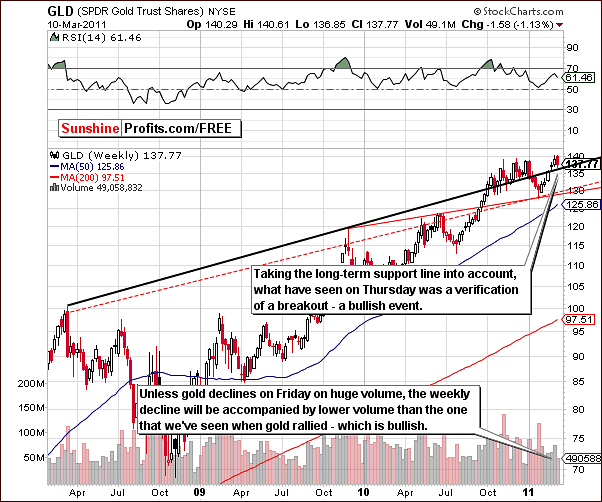
Taking a look at gold from the long-term GLD ETF perspective, this week’s price action appears to be nothing more than a verification of the breakout seen in previous weeks. The price declined to the long-term support level and then slightly rebounded upwards once again. Volume levels seen during the decline were not significant.
Still, this week has yet another day to go as of this issue’s Thursday evening writing. Unless gold declines on huge volume Friday, the weekly decline of this week on the whole will not be overly significant from a long-term perspective. Based on this chart alone, it would still seem that higher index levels from here are more probable than further declines.
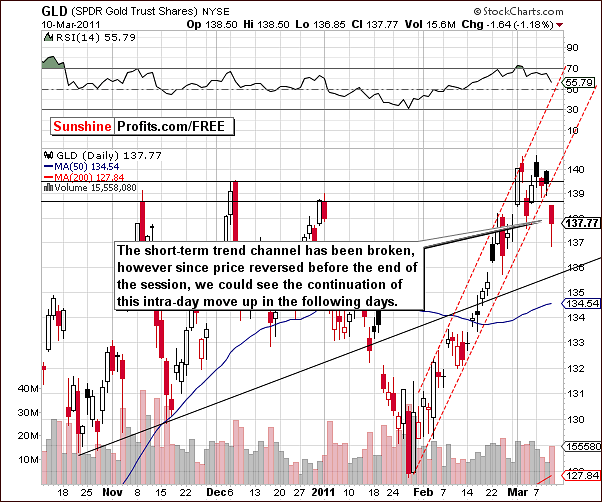
In this week’s short-term GLD ETF chart, we see some interesting price action. Thursday’s closing level was really quite similar to that seen a full week ago on March 3rd. The intra-day low was a bit below what was seen previously but the closing index level is quite similar to that seen on previous days.
Volume levels have been quite average after being very low on Tuesday and Wednesday. Price/volume action during these two days appeared to be nothing more than some sideways price movement after the recent breakout above previous highs. These indications were not bearish. Thursday’s volume action is really average – comparable to what we’ve seen in the first days of the month.
The current trend from a short-term perspective is, however, slightly bearish because of the decline below the rising trend channel. It is important to note that this breakdown has not been confirmed and in the latter part of Thursday’s session, price levels actually rose.
On an intra-day basis, the $137 level was broken but the GLD ETF closing level was more than $0.75 higher. Based on the early March highs, which were above $140, we’ve seen a $3 decline recently and this could possibly be the completion of the typical early March seasonal pattern. Normally, this decline has been a bit greater but this recent decline could be it for the March, 2011 seasonal slump.
Summing up, the situation this week for gold is quite mixed. From a long-term perspective, the outlook appears bullish, but the short-term situation is mixed at best. Gold moved below its short-term rising trend channel, and unless it moves back above previous highs quickly, the short-term outlook will become bearish.
We expect to see either a breakout above the very-long term trading channel to the $1,600 level or so or what could be a significant decline. We do feel the long-term trend remains up, but the short-term situation is no longer very bullish.
Silver
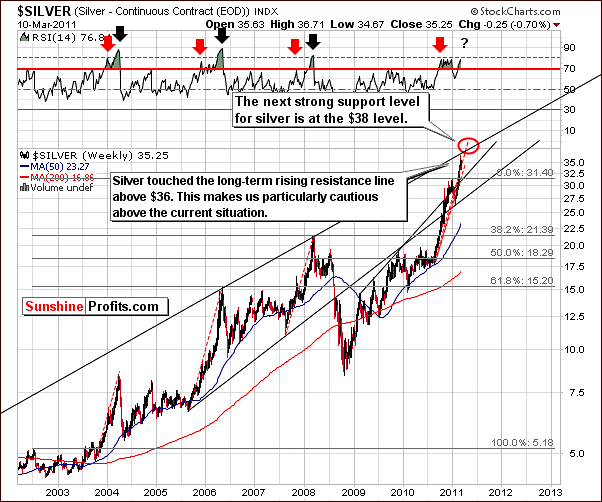
In this week’s very long-term chart for silver, we have quite a bearish development. When silver’s price surpassed the $36 level, it touched the very long-term rising resistance line. This level may have been touched somewhat ahead of schedule and the $38 target level may not be seen now for some time. Actually, it is possible that we have seen a local top already, and extreme caution is warranted from here.
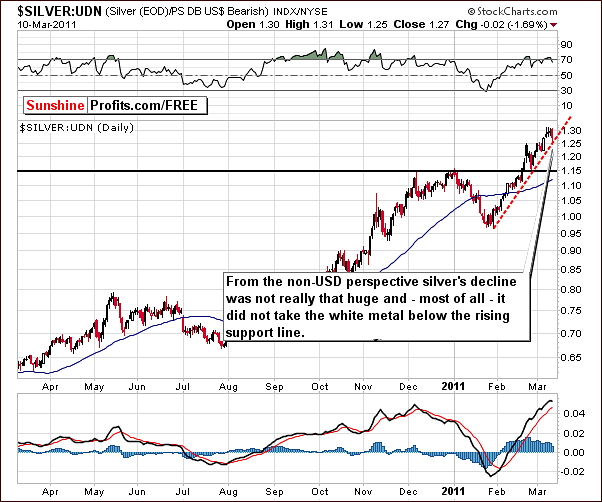
Looking at the white metal from a non-USD side, we see a definite short-term uptrend. Right now it may appear to just be a bounce, but, as we saw from the USD side, the short-term trend does appear to be up. The price levels reached on Thursday could mark a local bottom, having occurred actually within the intra-day trading period – that is unless we see this support line broken, and this could be the case based on the Friday’s pre-market action.
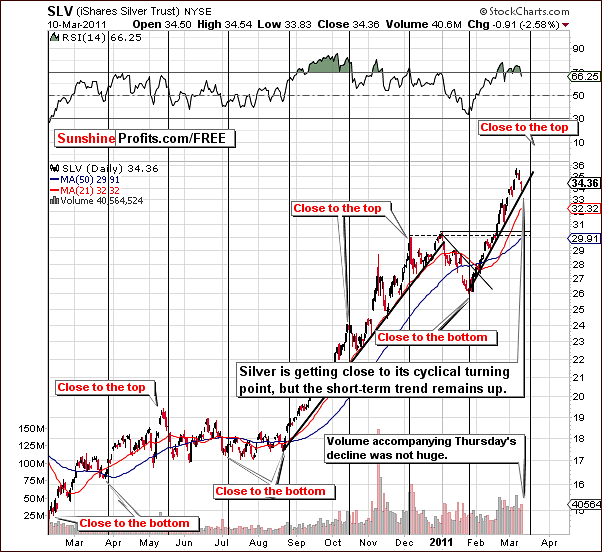
The short-term, SLV ETF chart is important for identifying silver’s cyclical turning points. We note that these have been quite accurate predictors during the past few months. At this moment it’s not clear if the final top for this rally is already in, or will we have a few more days of higher prices – based on the above chart.
It is possible that we have just seen the local top but another move up towards the $38 level could in fact be seen in the coming days. The cyclical turning point could coincide with such a move.
Still, based on Friday’s pre-market action it seems that the local top might already be in, as it means that silver has broken below the rising support line, which was – until now - the most bullish technical factor for the white metal.
Summing up, the situation for silver does not look too favorable. The short-term support line has been broken, the long-term support line has been reached and the cyclical turning point is close.
Gold and Silver Mining Stocks
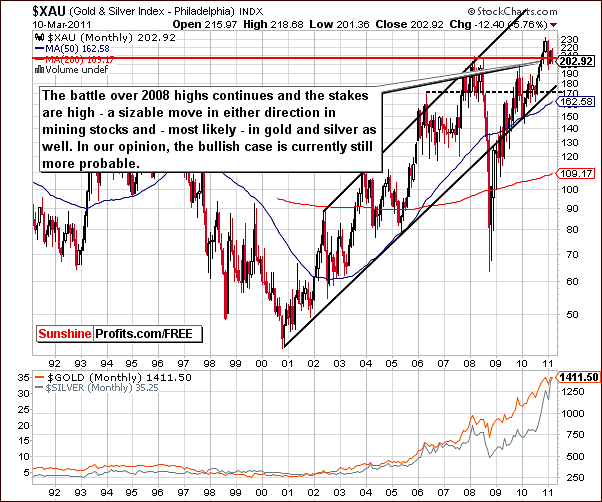
The very long-term XAU Index chart is a proxy for Gold and Silver Mining Stocks. In this chart, we can see that mining stocks did move below the level of 2008 highs during the past week. This decline, however, has been insignificant and the battle continues for the direction of the next major move. No clear trend has yet been established.
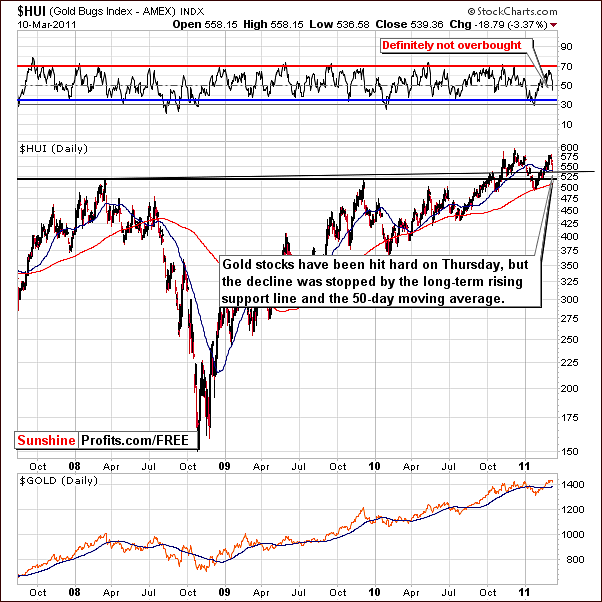
In this week’s HUI Index chart we have seen a move to the rising black support line as well as to the blue sloping 50-day moving average. These support lines appear to have stopped the volatile decline seen on Thursday. Consequently at least a short-term bounce from here is likely.
The gold and silver mining stocks have indeed been hit the hardest by this week’s declines. The metals themselves did comparatively well suffering much smaller declines than was seen in their respective mining stocks.
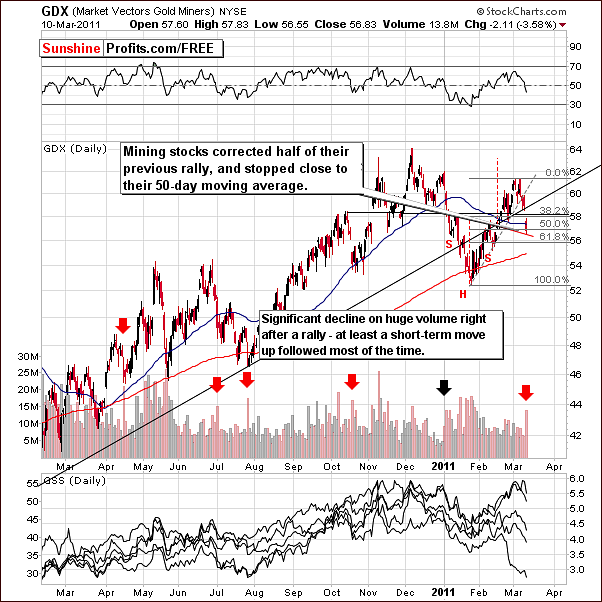
In the short-term GDX ETF chart, this week’s decline amounts to about 50% of the previous rally. Based on this fact and the 50-day moving average, the speed of the decline, and the huge volume levels seen, it appears that a short-term bounce is likely.
Based on past trends, big declines taking place right after a big rally accompanied by huge volume levels, normally a bearish indication, have often been followed quite quickly by another rally.
The red and black arrows in the chart shows that this happened most of the time as seen in April, late July and October last year. In short, the huge decline on huge volume has not normally been a bearish indicator for the short term in gold and silver mining stocks.
Summing up, gold and silver mining stocks have seen a difficult week which may have been quite worrisome for Investors. Based on price-volume action over the past year, it appears that a short-term rally is likely. Volume levels during this bounce could actually determine if the next big move will be up or down. We will continue to sort through all these factors and let you know if anything important changes.
However, based on the current situation in silver and the general stock market, it seems that it might be a good idea to exit the market and wait for things to calm down, before re-entering in.
Crude Oil Prices
Several Subscribers have recently asked us to comment on the relationship, if any, between the prices of crude oil and gold and silver’s price, so here we are.
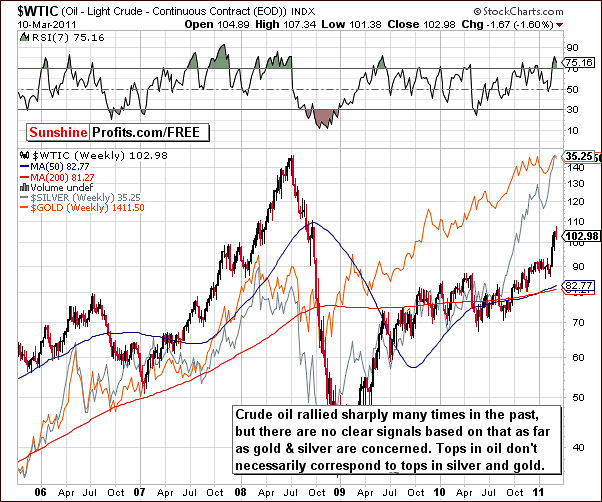
The above chart shows the price movements for all three over the past five years and a close inspection seems to indicate that there are no conclusive patterns which will contribute in any way to market timing signals.
Oil, silver and gold are of course all commodities. Generally, bull markets are often seen across numerous commodity sectors simultaneously and it’s therefore not surprising to see these three in uptrends at the same time. Please note that tops in oil correspond to tops, bottoms and sideways price movements in gold and silver. Bottoms in oil also correspond to tops, bottoms, and sideways price movements in gold. Consequently, a local top or bottom in oil does not necessarily have any short-term implications for Gold and Silver Speculators.
Let’s take a closer look at the gold:oil ratio.
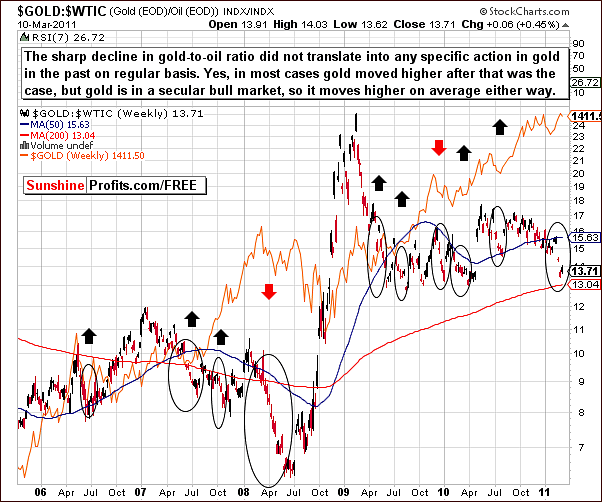
The above chart does not provide any information which seems to be useful in predicting gold’s future price performance.
Declines in the ratio – such as the one that we’ve seen recently – mostly correspond to higher gold prices without any specific details. However, since gold is in a strong bull market, then even random events would correspond to higher gold prices on average. Consequently, there’s nothing about the ratio that would make us use it as a trading tool and we do not feel that this ratio is one which should be monitored on a daily basis.
We’ve checked the silver to oil ratio as well.
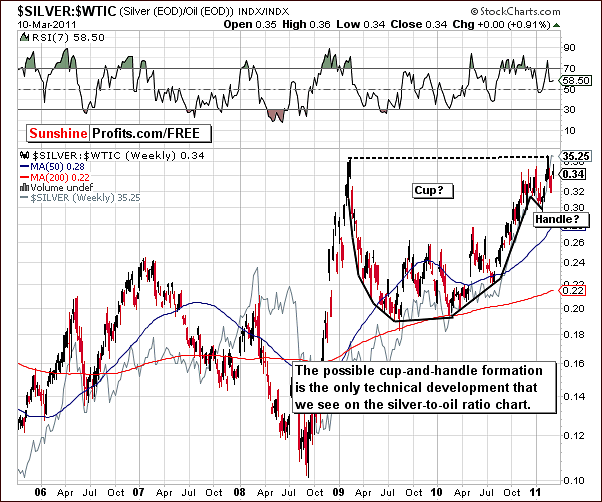
In the silver / oil price ratio, there is little seen here as well, but we do note the formation of a cup-and-handle pattern. If this bullish pattern further develops and silver breaks out of it, much higher silver prices could be seen. Still, this formation is a long-term one, which means that the bullish implications are also long-term. Silver is however already in a very strong bull market, so this is nothing new.
Once again, this ratio does not seem to be worthy of following on a daily basis.
The Brownian Motion
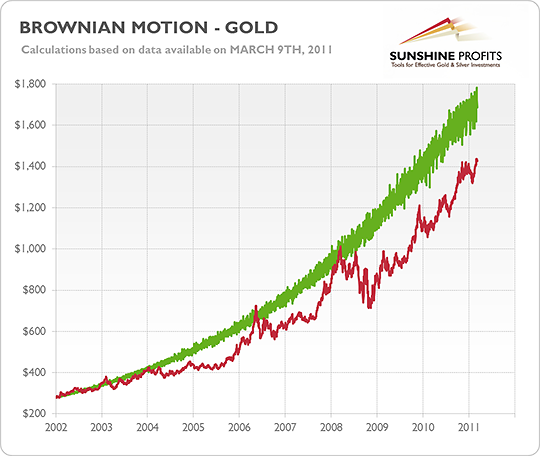
In today’s Premium Update we move our analysis of the movements of the price of gold beyond the usual factors. We would like to make you familiar with the idea of the Brownian motion. Brownian motion is a mathematical way of describing phenomena which are perceived as random. If we assume that the price changes of gold have a certain amount of randomness to them, then we may use Brownian motion to describe these price changes.
Let’s take a look at the chart above. It presents both actual prices of gold since 2002 (the red line) and the Brownian motion based on those actual prices (the green line). This particular Brownian motion fluctuates around an exponential relationship. However, it doesn’t seem that prices of gold can be directly approximated by this Brownian motion – the actual prices of gold deviate from this motion and gold trades most of the time significantly below the green pattern.
So, why would we be actually interested in Brownian motion if it doesn’t tell us what the level of the price will be? The answer is right on the chart. If you look at the local tops in gold, you will surely notice that most of these tops had been preceded by a moment in which prices of gold reached the level suggested by Brownian motion. This means that the analysis of Brownian motion might be able to point to possible tops in gold. Knowing that let’s move to the proper analysis.
At the moment, the price of gold is around $1,400. The above-mentioned chart shows that this level is still far from the level suggested by Brownian motion. This might imply that gold still has a potential to move higher and that we won’t see a major (!) top in the nearest future. Another thing is that the actual price of gold has been closing the distance to the Brownian motion and that much of that process took part in the second half of 2010 and in the first months this year.
These two points suggest that the major top in gold is yet to come and that it won’t materialize until the price of gold reaches the level of $1,600 – possibly moving temporarily above this level. At this moment it seems that long-term investments are more than justified as gold is still likely go move higher, even if it doesn’t happen right away.
The indications of Brownian motion are subject to change in the future – this is why we urge you to keep track of the current situation on the precious metals market and to make use of our Premium Updates and Market Alerts. Should any significant changes in our outlook for the market occur, we will keep you up to date.
Letters from Subscribers
Before summarizing, we would like to answer a few important questions posed recently by our Subscribers.
How does April's contract liquidation factor in to short-term gold and silver prices?
In April the precious metals derivatives will expire on the 26th (options) and on the 27th (futures). Therefore, the influence of derivatives should be most visible around these days. The findings of our new tool – True Seasonals (which will be available on our new website) suggest that the price of gold in April might reach its peak on the 26th, after which it is likely to decline by approximately 1% until the 29th, which marks a possible short-term bottom. This may be followed by a 3% rise in the first week of May. If you assume that gold would be worth $1400 on April 26th this would mean that gold would decline by about $14 during the following three days and it would gain about $45 in the first week of May.
This suggests that it might be best not to open any additional short-term long positions between April 26th and April 29th . On the other hand, it might be profitable to add to your speculative positions on April 29th and close them around May 6th.
If you consider trading in line with the True Seasonals indications, you need to keep track of other market signals as factors other than seasonality and derivatives may influence the price of gold. The best way to do this is to stay tuned to our Premium Updates and Market Alerts as they cover the latest changes in the precious metals market.
Another question was from a Subscriber who asked about an article he had read in which author claimed that the S&P 500 is vastly overbought and is due for a severe correction which will affect gold and all commodities. In addition the author stated that a 1% drop in the gold price historically translates to an 8% drop in gold stock prices on the HUI.
Please note that there have been times when gold stocks declined along with the general stock market and there have been times when gold stocks rallied despite main stock indices declines. When looking at a price, you can often see that trends persist for some time and that it is a good idea to be positioned according to the trend. The same can be said about the way markets relate to each other. If markets moved together in the past three months, then it is more likely than not (taking only this factor into account) that they will move together also in the following week.
This is where our Correlation Matrix comes in. Since we are discussing the likelihood or not of a major correction, we should consider the medium-term correlation coefficients. At this point, the past 90 days show almost no linear correlation whatsoever between stocks and gold stocks. Consequently, even if the situation in the general stock market gets very bearish, we would not be so sure about the negative impact on the gold stock sector.
As of today, it seems that gold stock investors should be cautious but that is due to the situation on the silver market (currently highly correlated with stocks) and due to the fact that gold moved below its rising short-term trend channel.
Among this week's questions we also found one asking if the enormous US government debt might cause the collapse of the US dollar. Our Subscriber wanted to know if in our opinion the US Dollar is going to decrease in value and what possible impact it might have on gold and silver prices.
In our opinion sooner or later the USD is likely to collapse. In last week’s Premium Update we quoted an in-depth report that said that if the U.S.A. were a corporation traded on the stock exchange you wouldn’t want to buy its shares. The report issued by a world-leading venture capital firm said that U.S.A. Inc. is bloated, inefficient debts-ridden and not unproductive. According to the study, the US has a net worth of negative $44 trillion, which comes to $143,000 per capita. The US is printing money like there is no tomorrow, at the same time claiming that inflation is not a threat. We don't want to speculate how this is going to end, but it's not likely to be pretty. Needless to say it is likely to be bullish for precious metals.
Quote from February 25th, 2011 Premium Update, where we replied to analogous question:
It's impossible to tell. One speculative attack on the USD could begin a dramatic selloff as either party holding large amount of dollars (Japan, China, ...) could panic and dump their reserves on the market. This would trigger even more dumping and before you know it, the financial system as we know it could cease to exist. This is not likely to happen any time soon - the powers that be still have aces up their sleeves. As a general rule, currency- and financial crises take place later than everyone expects, but when they finally do occur it happens in a fashion more rapid and more brutal than anticipated.
It's like building a house of cards - if you are very good at it, and you take your time, you can build a house that is very high, but you can't convince anyone that you can keep adding more cards indefinitely. Why? Because most people tried it and know that it's impossible. Now, when it comes to international economics and monetary policy very few people are able to 'try it' and see the immediate effect. This time the details are more complicated, but one can look at it this way - if someone will build a house of cards 50 years now, does it still mean that this house has to go down eventually? Most likely, yes. Why? Because past experiences (history) and pure, cold logic proves this to be the case.
In our view, it is impossible to tell when the dollar will crash and gold will sky-rocket, but instead of trying to guess the date, we prefer to design and follow a strategy that will make our capital grow regardless of that date. We think that putting part of one's holdings into precious metals bullion, part into mining companies as a long-term investment, and using the rest to speculate in the short- and medium term is the way to go. Thanks to this approach one is protected against a serious financial turmoil, positioned in a sector that has very favorable fundamentals (long-term growth) and thanks to speculation one is able to make money along the way. As mentioned before, we wrote about this approach in the Universal Investor essays - you can find them in the Research section.
We recently commented on gold:silver ratio and its recent 1:41 value. Here is what we've wrote in our March 4th, 2011 Premium Update:
Gold: silver ratio is quite low now, as silver has outperformed significantly recently, however that does not automatically imply that we have turning point right now. In the final stage of the bull market we expect the gold:silver ratio to move close to the 1:16 level which is where it was also during the final part of the bull market (early '80s), which is also close to where the ratio traded during a large part of this century. Yes, that means a much higher price of silver and this is what we expect.
Our Subscriber added some interesting information about 1:16 ratio. Here it is:
1:16 was a pegged price by the US government when we were on the Gold Standard.
1:16 was a Hunt induced ratio in the '80s
As our Subscriber correctly noted, there were many cases when the ratio between gold to silver moved to 1:16. Moreover, please note that the ratio was about 1:15 at the end of the 19th century, about 1:12 at the time of the Roman Empire. Does today’s 41:1 ratio really appear as a low value?
Summary
The situation in the USD Index is mixed but the next few days could very well clarify things quite a bit. This of course would also clear up the uncertainty in the Euro Index which has recently declined.
The general stock market outlook is slightly bearish at this time and this could lead to lower precious metals prices, especially for silver. Based on this and (mostly) on today’s pre-market action in silver, we believe that the long speculative positions in the precious metals sector should be closed.
The situation is not clearly bearish at this point. Conversely, there are several bullish signals present; however the risk/reward ratio is not favorable enough to justify betting on higher prices in the short term. Since we would not suggest going long until things settle down a bit, we also think that open positions should be closed and re-opened when the situation improves. With speculation in mind, there’s always the next train.
Note that the situation may turn around in a few hours, days or weeks. Much depends on what happens in the next week or two (should any bounce materialize, volume will provide us with important details) and we will keep you informed as this further develops.
Thursday’s price declines may have completed the early March normal downtrend for gold, which would be a bullish factor, but based on today’s pre-market action, we see that gold, mining stocks and also silver moved below their rising trend channels, and the end result is that the situation is not short-term bullish enough to justify a bet on further price gains. It’s been a profitable ride since the end of January 2011, but we believe that taking profits off the table right now is a good idea.
There are no changes as far as long-term investment capital is concerned.
As always, we will keep monitoring the markets on a daily basis and report to you accordingly.
Our next Premium Update is scheduled for Friday, March 18, 2011.
This completes this week's Premium Update.
Thank you for using the Premium Service. Have a great weekend and profitable week!
Sincerely,
Przemyslaw Radomski

