If the U.S. A. were a corporation traded on the stock exchange would you buy its stock or would you dump your holdings?
The conclusion of a report titled U.S.A. Inc. issued recently by Kleiner, Perkins, Caufield and Byers, a world leading venture capital firm, says sell, sell, sell. Some of the people who signed off on the forward to the 460-page research report include the likes of George Schultz, Paul Volker and Michael Bloomberg.
The comprehensive report was compiled by Mary Meeker, partner at KPCB and former financial analyst at Morgan Stanley. It discusses America’s financial situation and outlook as if it were a corporation. Of course, the United States isn't a corporation. It can't dump underperforming divisions (California, Illinois?) or auction off parts of the company (the Navy, Social security?) The "customers" are also the shareholders and they want to reward themselves with unaffordable company perks. What would a turnaround expert recommend for a company that lost more than $2 trillion ("net operating cost") in 2010?”
Meeker analyzed America’s balance sheet and the results are less than encouraging.
"In effect, USA Inc. is maxing out its credit card. It has fallen into a pattern of spending more than it earns and is issuing debt at nearly every turn," she writes. "The ‘management team’ has created incentives to spend on healthcare, housing, and current consumption. At the margin, investing in productive capital, education, and technology – the very tools needed to compete in the global marketplace – has stagnated."
In a recent Business Week article Meeker writes:
The bottom line on USA Inc.? Cash flow and net worth are negative, profits are rare, and off-balance-sheet liabilities are enormous... Lenders have been patient so far, but the sky-high rates on the sovereign debt of Greece, Ireland, and Portugal suggest what might lie ahead for USA Inc. shareholders and our children.
By our rough estimate, USA Inc. has a net worth of negative $44 trillion. That comes to $143,000 per capita. Negative.
Meeker says Medicare and Medicaid are the drag on USA Inc. If you exclude these entitlement programs the "core business" shows a median net profit margin of 4 percent over the past 15 years, she says. In the early years of the country, the only entitlements were military pensions, that is until the 1930s and World War II when the federal government substantially expanded its role in the economy. It expanded its role even more during the euphoric days of the Great Society in the 1960s.
Since 1965, the nation's gross domestic product has increased about 2.7 times over, but entitlement expenses have increased 11.1 times over, she writes. What do Americans have to show for it, she asks. The huge sums that the federal government lays out for Medicare and Medicaid would be easier to stomach if people believed the money was well spent; the evidence is that it's not.
Meeker shares one statistic she says shocked her. If current trends continue, according to the Congressional Budget Office, entitlement spending and net interest payments combined will equal all of federal revenue by 2025, just 14 years from now. Back in 1999, the crossover point was not supposed to happen until 2060, she says.
Imagine: no Army, Navy, Air Force, Marine Corps, or Coast Guard, no federal courts or prisons, no National Park Service, no Food & Drug Administration, no embassies, no salaries for Congress. That's what it would take to balance the budget by 2025 and still pay interest on America's debts, without either raising revenue or reducing entitlement growth. That's certainly not a recognizable America.
Fortunately, Meeker does more than just analyze USA Inc's troubles; she also provides a thorough turnaround plan.
Once you understand USA Inc.'s main problems, the solutions become almost self-evident, she says.
The centerpiece of this turnaround plan is a "focus on revenues." She touches on a need for USA Inc. to trim expenses, but cautions: "while revenue is highly correlated with GDP growth, expenses are less so."
There's a lot that can be done to make USA Inc. operate like a well-run business. A corporate turnaround specialist would quickly hire an independent firm to conduct an audit of each business line. Is each line operating at maximum efficiency? Where should we invest and where should we scale back? Are good performance metrics and financial controls in place? Can more processes be automated and optimized? Should some assets be sold? Why not hire a compensation consultant to see whether federal workers are overpaid vs. private-sector counterparts? Why not pay bonuses to federal employees who meet deficit reduction goals? Why not give the President the line item veto, allowing him or her to carve the pork out of otherwise worthy legislation?
I hope it's clear by now that USA Inc. has a spending problem, not a revenue problem. Simple math says that balancing the budget purely by raising taxes would require doubling rates across the board, which would kill growth. That said, tax revenues probably have to go up a little. Another option, again using simple math, would be to scale back deductions and tax credits, which cost nearly $1 trillion a year in forgone revenue. Reducing the deductibility of home mortgage interest, for example, would raise tax revenue without higher tax rates. As a form of investment with long-term payoffs, construction of houses does not rank particularly high.
Given that Meeker's spent her professional career in technology, it is no surprise that she makes increasing investment in tech a centerpiece of her turnaround plan.
"Technology plus infrastructure plus education investments drove ~90% of labor productivity growth for past ~30 years," she writes. "However, USA Inc. has increasingly allocated resources away from productive technology plus infrastructure plus education investment spending toward less-productive entitlement program spending."
Meeker gives with some encouraging words:
We can take comfort as citizens and shareholders that USA Inc.'s asset base and entrepreneurial culture are strong. In 25 years of studying tech companies and working in financial services, I've discovered that people will sacrifice if they have a clear idea of what their sacrifices can accomplish. I think the same goes for USA Inc.
With everything that has happened with precious metals this week, let’s not delay any longer and let’s turn to this week’s technical part with the analysis of the Euro Index. We will start with the short-term chart (charts courtesy by http://stockcharts.com/.)
Euro - USD Indices
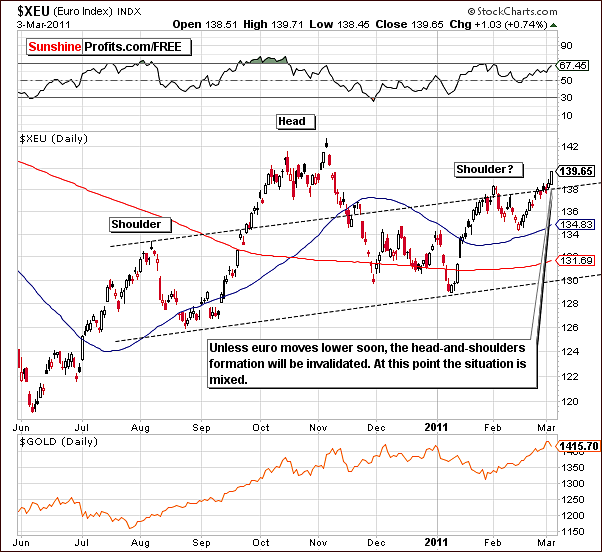
There were some important developments this week which are visible in the short-term Euro Index chart. A significant daily rally was seen on Thursday, bringing index levels above the early February highs and unless an immediate decline is seen, this will invalidate the head-and-shoulders pattern. A decline from here would keep this pattern development underway.
At this point, the situation is mixed though we feel there is a slightly bullish bias. This is a change from what was seen in the last few weeks. It appears that a continuation of the head-and-shoulders pattern formation is less than 50% likely at this time. Of course, three days of price action above the February, 2011 highs would be needed to confirm this move and invalidate the pattern.
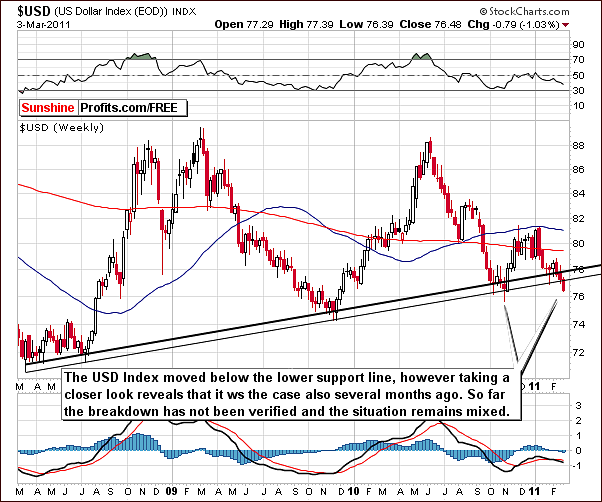
In the long-term USD Index chart, we can see that the index moved below the lower long-term rising support line which is based on several important bottoms. Of course, any bullish sentiment seen in the Euro Index normally leads to a bearish outlook for the dollar and such is the case once again.
The breakdown here has not, however, been confirmed. Several months ago, the USD Index moved below this support line and then quickly rose back above it before the end of the week.
In the November 5th, 2010 Premium Update we commented on a similar move in the USD Index as follows:
This week saw a move slightly below the long-term support line. This really is quite minimal when compared to the size of the previous rally. Especially, Thursday's intra-day price action was not all that big considering the Fed's $600B news.
Truly, yesterday's decline was not as big as it could have been. In fact, much larger weekly declines have been seen recently. Since the breakdown has not been verified, we still need to think of it as possibly fake until confirmed. If this confirmation is indeed realized, action can then be taken as the ultimate direction will likely be more clear and predictable. This is, however, not yet the case.
The trend did indeed reverse shortly thereafter. Confirmations of breakouts and breakdowns, usually over a three consecutive day period truly are important and it is quite risky to form conclusions without such verification.
In short, the outlook for the USD Index from a long-term perspective is mixed with a slightly bearish bias.
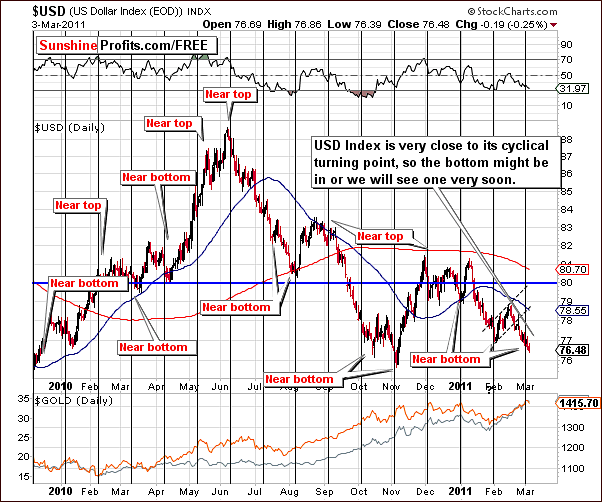
In this week’s short-term USD Index chart, the doubts that were present in our long-term chart analysis are backed by the influence of a cyclical turning point likely to be seen very soon. There could very well be a rally from what appears to be an impending local bottom.
Summing up, the situation in the USD Index is overall mixed with a slightly bearish sentiment at this time. Conversely the situation in the Euro Index appears to be slightly bullish.
General Stock Market
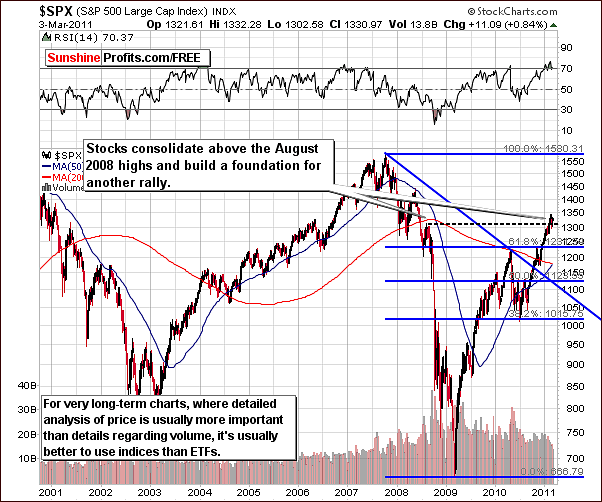
In the very long-term chart this week, stocks continue to basically move sideways though remaining above the levels of August, 2008 highs in the S&P 500 Index. No other significant developments are seen from a very long-term perspective here.
Last week in our Premium Update, we said this about the recent sideways price action in stocks: This could be a gathering of strength for a subsequent rally. We continue to stand by this statement after another week of observing stocks.
The important implications here are that a resumption of a rally in the general stock market following the current period of sideways price movement could lead to a precious metals rally as well. This is especially true for silver.
Summing up, stocks appear poised to resume their rally as the current pause builds a foundation for another move up. In other words, the recent sideways price action above the levels of the August, 2008 highs leads us to a bullish outlook for the weeks ahead.
Correlation Matrix
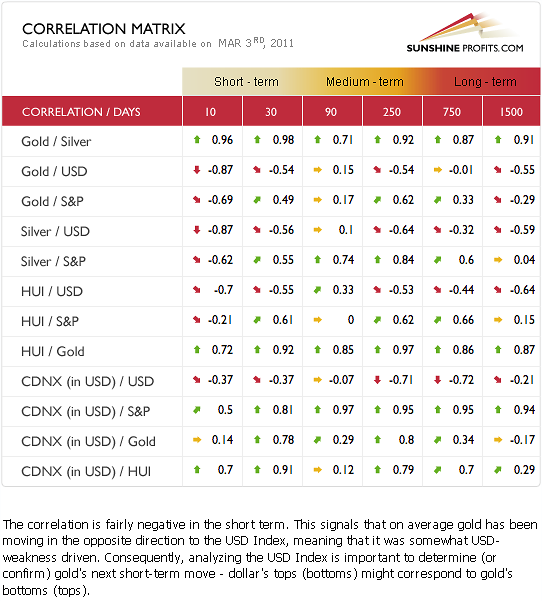
In this week’s Correlation Matrix, we see three significant influences in the medium term. These are Silver/S&P, CDNX (in USD)/S&P, and HUI/Gold. Gold and Gold stocks being highly correlated is, of course, no surprise. Since the general stock market is verifying a breakout at this point, the implications upon silver and juniors is bullish. The specifics of these markets will be discussed in later sections and in the letters portion of this week’s update.
The short-term coefficients (the 10 and 30-day columns) this week are generally positive or negative – they are no longer insignificant, that is, in the range of low correlation (close to 0).
The USD has generally moved in the opposite direction of gold, silver and gold and silver mining stocks. Therefore, the slightly bearish sentiment for the dollar does not lead to such an outlook for precious metals as a whole. Index levels of the currency markets are not of great concern at this time.
The current rally in precious metals was not stopped by the trend in the currency markets. The negative correlation has been increasing day-to-day. The positive situation in the general stock market appears to have carried over to the precious metals sector.
Overall, the implications to the precious metals appear bullish from here.
Gold
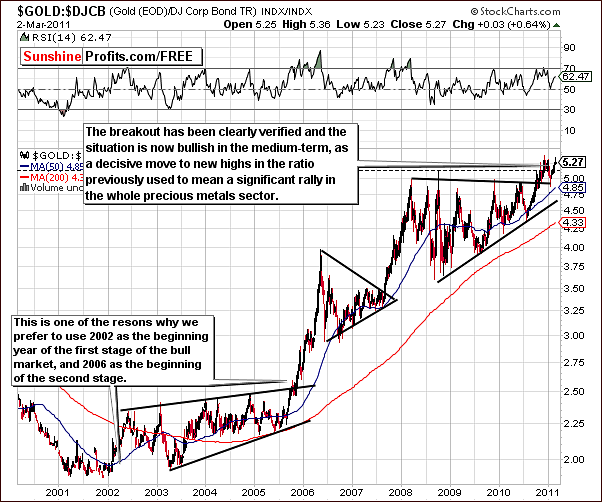
When we look at the ratio between the price of gold and corporate bonds this week, the trend continues to appear bullish. After a short period of consolidation, the ratio has moved higher and is now close to the level of the late 2010 highs. The breakout above the long-term triangle pattern (2008-2010) has been confirmed. Furthermore, this is likely the last stop before the highs of late 2010 are also taken out, resulting in a huge rally in the whole precious metals sector. The validation of the breakout from the rising triangle pattern is a significant development here.
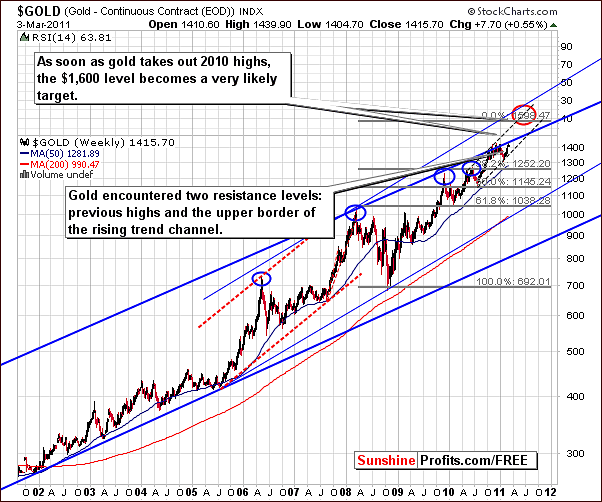
In the very long-term chart for gold, the $1,600 target level is still valid. Let’s switch our attention to two important resistance levels which have recently been touched. These are the previous highs and the upper border of the rising trend channel. A period of consolidation is acceptable in view of this recent move.
The decline in gold’s price was not really surprising and since the beginning of the week, we have seen about an $8 rise in the price of the yellow metal so far.
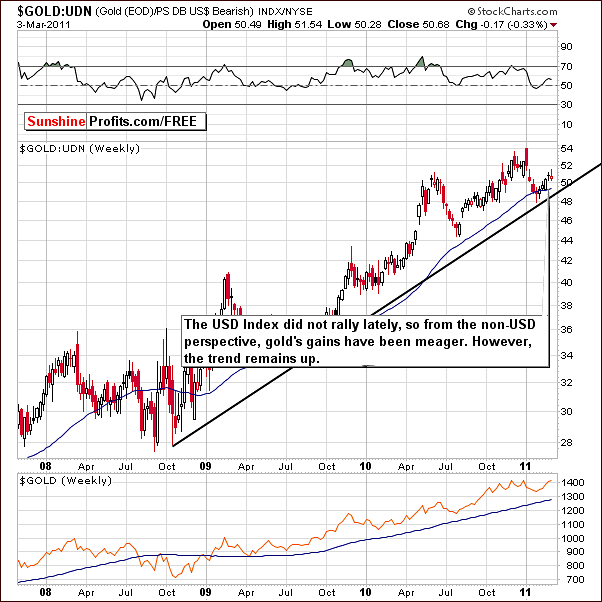
From a non-USD perspective, once again there is little excitement to report to you this week. The trend still appears to be up from here but, as we mentioned last week, the rally in the USD Index is a prerequisite for some big moves here. Such a rally has not been seen in this influential currency market.
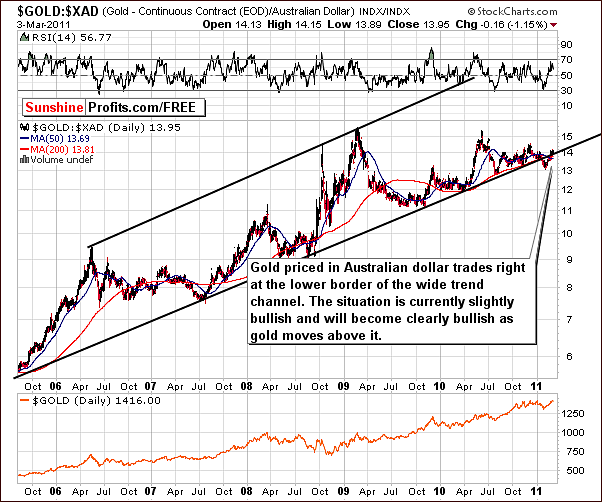
Once again this week, we take a look at gold from the Australian dollar perspective. Recall that this chart was once providing a bearish outlook when all others were bullish. This was the case in February 10th, 2011 Premium Update.
This week, we continue to see an invalidation of the recent breakdown and still see index levels here close to the lower border of the trading channel. This back-and-forth index level movement has shown no decisive breakout but the trend still appears slightly bullish since levels have not dropped significantly below this support line. The bullish sentiment would increase significantly if an upward move is seen in the coming days.
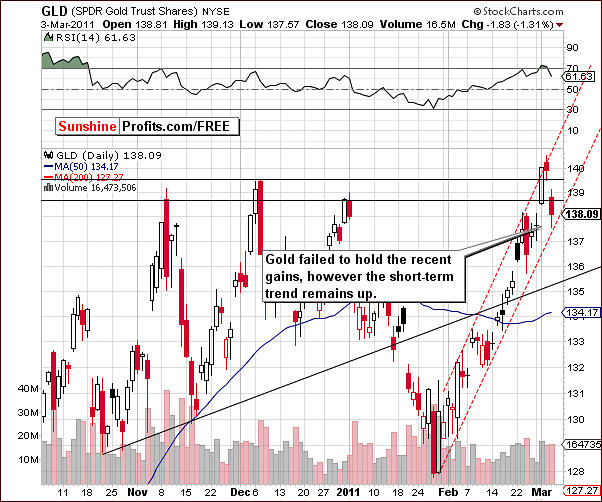
This week’s short-term GLD ETF chart shows that the move above previous highs did not hold but this is not overly bearish in and of itself at this point. The reason is that Thursday’s decline did not go below the rising, short-term trading channel and the RSI is not at overbought levels. These would be bearish indicators which are not in place at this time.
Volume levels on Thursday were fairly significant but did not exceed the levels seen in previous daily upswings. Additionally, they are lower than what was seen during daily decline seen in late February. So, although the situation may appear scary at first glance, it appears that it is not the time to take drastic action. We will continue to keep an eye out for you and let you know when anything significant takes place.
Summing up, although recent price / volume action may have led to a temptation to get out of gold, analysis of all sides makes this seem to not yet be the right move. Volume levels do not support an overly bearish outlook, and the short-term trend for the yellow metal still appears to be up.
Silver
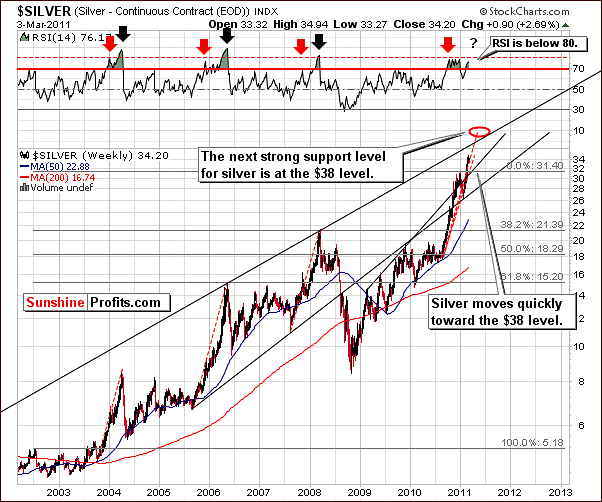
In the very long-term chart this week we see that silver has been moving in tune with the dotted-red line analogous to the move seen in 2005-2006. Its price continues to move towards the $38 level, which is still a valid target level for this rally.
Simply put, the situation looks bullish. The breakout above the previous highs is clearly seen here and the RSI is not above the 80 level. Consolidation and a rising RSI level have not yet been seen and there simply are not any obvious bearish implications seen in this week’s chart or trends.
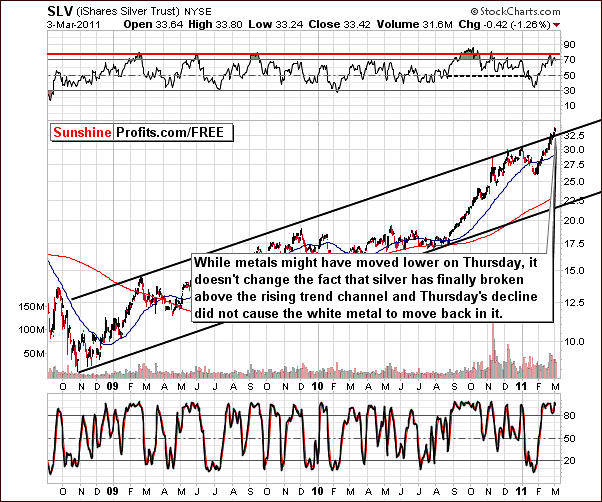
As we zoom in a bit closer, we can see that silver has moved above the long-term rising trend channel. If this breakout is verified (and it currently is being verified), the uptrend could accelerate from here. This may be hard to imagine (9 years ago silver above $30 was also hard to imagine), but it appears to be a real possibility at this time. The implications are clearly bullish, and we would also like to mention that when gold declined on Thursday, silver did not.
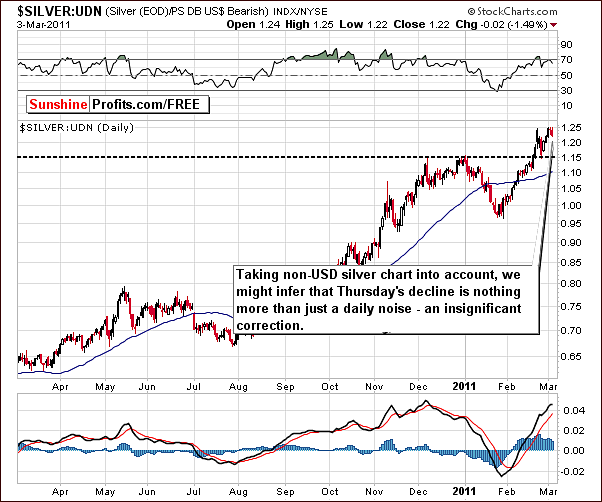
From a non-USD perspective this week, we simply wish to note that Thursday’s price action is barely visible and quite insignificant. The opposite is the case as far as verification of the breakout above the previous highs is concerned. There is little to report this week on silver other than these two bullish facts.
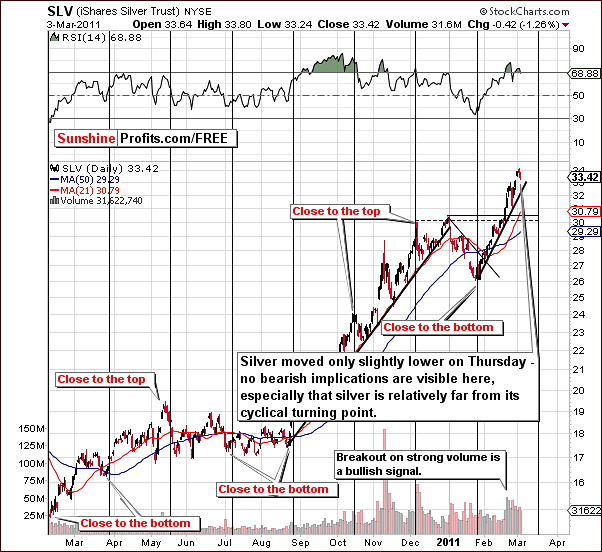
In this week’s short-term, SLV ETF chart, we can see that index levels remain above the rising support line. Volume levels were not higher than seen on recent upswings, and silver is still far from its cyclical turning point. Taken together, these factors provide a bullish outlook from here.
RSI levels are close to the overbought range, but we note that previously this has not been a problem for silver’s short-term price moves. It seems unwise to make conclusive calls based on RSI levels only.
Summing up, the bullish outlook for silver appears strong enough to withstand the lack of a strong rally in the gold market. Actually, silver appears more likely to push gold higher than gold is likely to push silver lower. Silver’s recent trend appears strong and it appears likely to continue from here.
Gold and Silver Mining Stocks
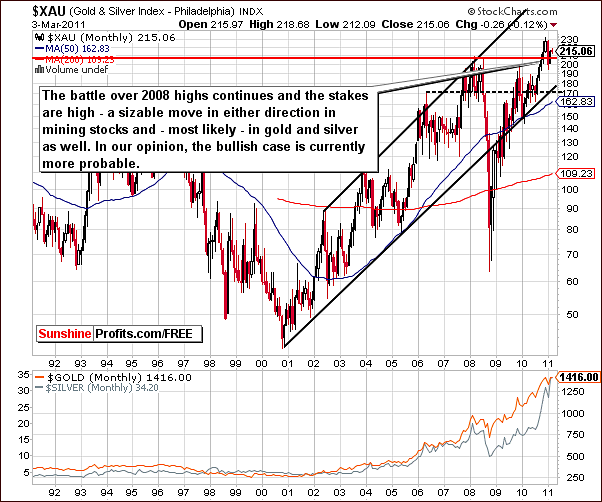
The very long-term XAU Index chart is a proxy for gold and silver mining stocks. Last week’s comment that “This week we continue to see a fight for new highs” here continues to hold for this week.
On a short-term basis, we have seen these 2008 levels surpassed, but here in the XAU Index chart, we are looking at major long-term moves. The use of monthly candlesticks, a valid charting tool for very-long term analysis, shows that values are only slightly above 2008 highs and a more significant move should be seen here before we state that such a breakout is definitely in. Therefore, we describe the trend as slightly bullish.
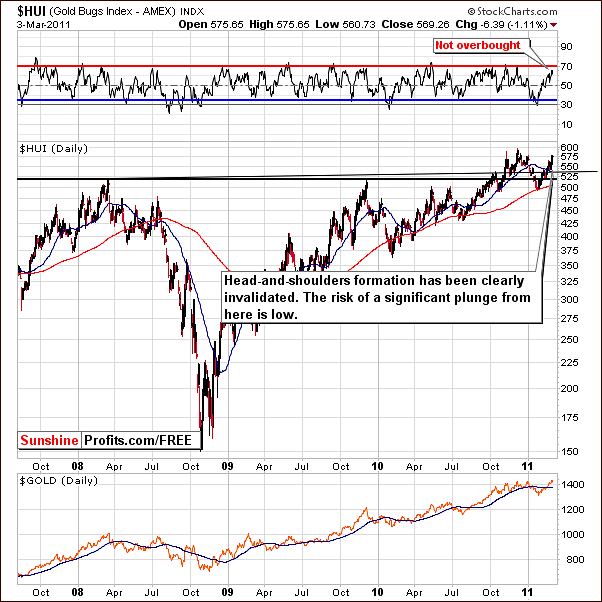
In the HUI Index (gold stocks) chart this week, we now see that the head-and-shoulders pattern has been invalidated with index levels remaining above the level of 2008 and 2010 highs and the risk of a move down to the 400-450 level appears to be very low at this point. RSI levels based on the Gold Bugs Index are not above 70 and therefore not overbought. There is some room to the upside in the RSI here so a continuation of the current rally is possible and – based on other factors - likely.
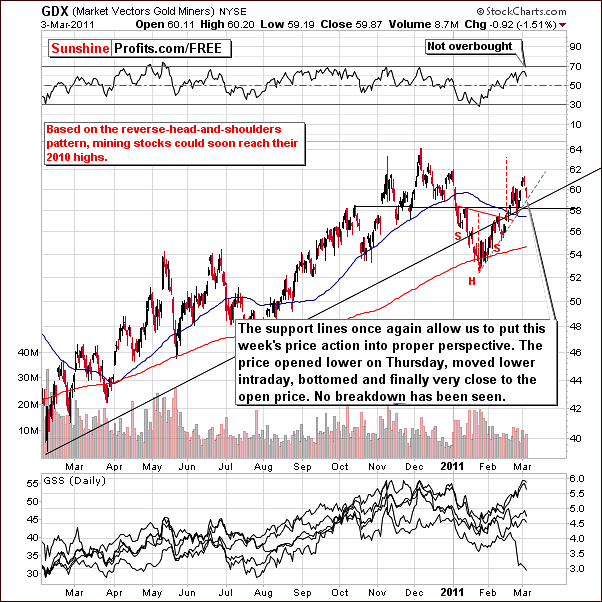
In the short-term GDX ETF chart (again, a proxy for gold & silver mining stocks), analysis of volume is our general focus point. Thursday’s decline in ETF levels can be termed insignificant because it was not accompanied by an increase in volume.
As was the case with the HUI Index, the RSI for the GDX ETF is also below overbought levels. This appears to provide some support for the validity of 2010 highs as target levels although they have not yet been reached.
No support levels have been breached and index levels are closest to the short-term rising support line. This grey-dashed line in our chart has been touched on an intra-day basis but a move higher followed. The outlook remains bullish from here.
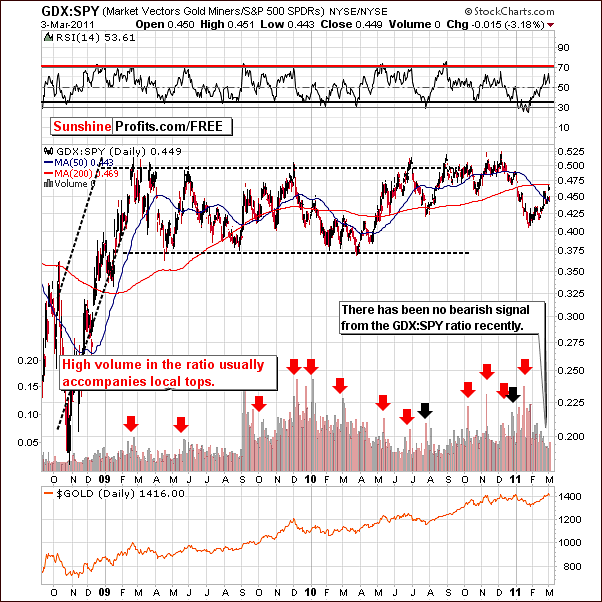
The above chart provides barely any changes since the previous week, which by itself is somewhat bullish. Please read the following quote from last week’s update for details:
The GDX:SPY ratio chart is often used to reveal a sell signal. In other words, we usually see a spike high volume in the ration close to a local top. Such action would be attributed to the volume in mining stocks being high compared to other stocks.
We have not seen such a signal here this week and we have included this chart for this reason. Mining stock volume levels have not been high compared to volume accompanying moves in other stocks and consequently the volume ratio has not spiked.
This lack of bearish signal is additional information in favor of a rally in mining stocks although perhaps a few days pause may be seen first. The important point is that a rally is clearly more probable than a downturn based on the price and volume action seen in this chart.
Again, a single spike in volume here, especially if combined with a resistance level in the ratio and a supporting RSI would be a strong sell signal. This has not been seen recently and the critical bearish signals have not been seen lately.
Summing up, gold and silver mining stocks seem ready to move higher from here. Thursday’s decline was insignificant and analysis of recent trends continues to point to a bullish outlook.
Sunshine Profits’ Indicators
Two of our gold & gold stock indicators have just flashed a signal. Please take a look below for details.
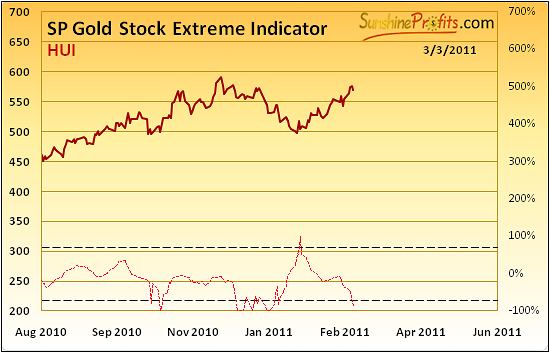
In the first of our SP Extreme Indicators this week, we see a move below the lower dotted line which in the recent past has indicated that a short-term rally is likely. Generally, this indicator signals extremes, not necessarily bottoms, so analyzing its previous performance is important before interpreting its signals. At least short-term rallies have been seen after this indicator flashed signals in the recent months, so it has bullish implications also today.
Please note that we’ve previously seen this signal right after markets closed on January 27th, 2011, and this is what we wrote in the January 28th, 2011 Premium Update:
Moreover, in the SP Gold Stock Extreme Indicator, we see that the suggestion is that a local top or bottom has been reached. When the indicator crosses either of the dotted lines, we see an extreme signal and here it indicates a local bottom, since it was a decline that we’ve seen recently. Both abovementioned signals are bullish for the short-term and speculative long positions are justified from this point of view.
In our second SP Extreme Indicator chart, the situation appears even more bullish.
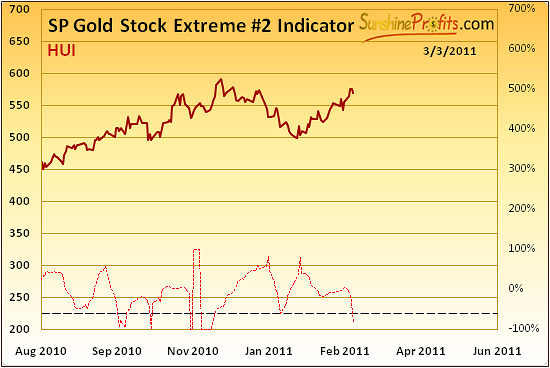
Previously, when this indicator moved below the lower dotted line, it meant that gold was close to a bottom and a rally followed – and this signal has been reliable in the past months. Please compare the previous signals and the price action that followed.
The implication here is that it is possible that Thursday’s decline may have been, in fact, the last local intra-day bottom rather than the beginning of a decline. Consequently, a rally could be seen from here. We will follow this closely and report to you should any of these assumptions be invalidated.
Juniors
As stated in the Key Principles section, the list of top juniors will be updated approximately every 4 weeks, so this is the Update that should contain the revised version of the list. However, before providing you with details, we would like to comment on this sector's performance in general.
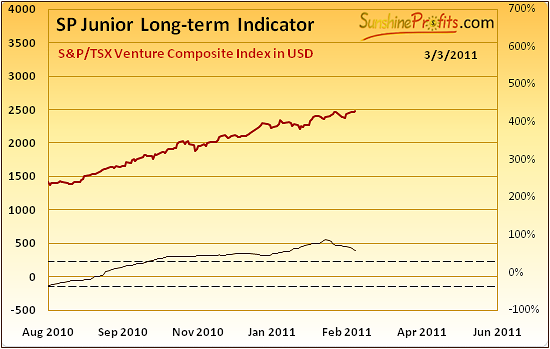
Value of the indicator has been moving generally in the horizontal way, even though it has declined slightly recently. Still, since the outlook for the main stock indices remains bullish, and they are highly correlated with the junior sector, we not consider the sell signal for juniors to be in, although technically we have seen a slight decline in the above indicator. Consequently the situation remains bullish for the junior sector. It might change, but it is not the case yet.
Now let's take a look at this month's junior lists.
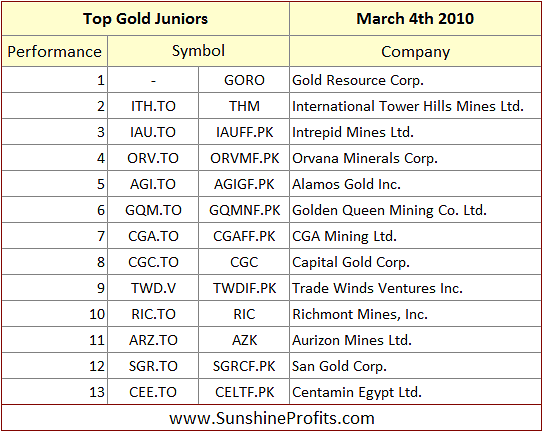
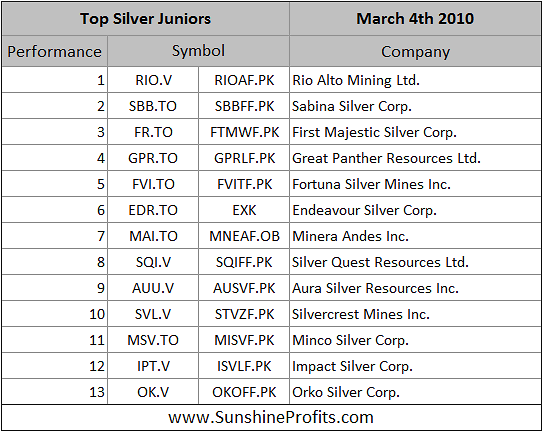
We can see only minor changes in top 3 gold and silver miners. Namely, THM and GORO have switched their places, but are still on the top of our gold juniors list. Top 3 silver mining companies are holding their previous positions.
It also looks like our top miners have more or less recovered from January correction very quickly, which is especially visible in cases of GORO, SBB.TO and FR.TO (actually, these two silver miners have already surpassed their December, 2010 highs).
We have two new gold miners on the list: Richmont Mines, Inc. and Aurizon Mines Ltd. AAG.V, which was closing our previous list didn't qualify to this month's top gold miners ranking, so it might be a good idea to switch from this stock to the better performing ones. There are also two new additions to our silver miners list, which are Impact Silver Corp. and Orko Silver Corp.
Please note recent performance of the Great Panther Resources Ltd. – we have commented on it separately in the September 16th, 2010 Premium Update, when we wrote the following:
The final question for today was about juniors and especially one of them - Great Panther Resources - and its relatively late move up and was accompanied with really positive feedback. Thank you. GPR.TO looks good, but other stocks from our rankings look slightly better. It seems that if one decides to keep it, they will still be fine (it ALMOST qualified to our top list). Of course that's just our opinion.
GPR.TO was trading at 1 back then and at the moment of writing these words is at 4.36. Significant 336% profits would’ve been made if one purchased on Sep 16th, 2010, and sold today.
Letters from Subscribers
One of our Subscribers asked us to comment on the recent speech of the Fed Chairman, Ben Bernanke in which he argued that the inflation won't kick in.
One reason economists think inflation won't kick in is the nation's current high unemployment rate, 9 percent. Workers have little power to demand big pay increases because the job market is still weak. That will prevent inflation from igniting, Bernanke said.
Our comment is that the above statement doesn't make much sense. The logic is that since people will not earn more then they will not have more money to spend. The problem here is that prices in general don't depend on how much people earn, but how much money is there floating around. The fact that pumping money into the system isn't really effective anymore as far as creating jobs is concerned is one thing, and the fact that it doesn't create REAL wealth is another thing. If there is the same amount of goods in the world and more money and you will need more money to buy the same amount of goods. Period. That's the very basic law of supply and demand. Supply of money increases without a corresponding action in demand, so the value of money decreases. The decrease in value of money caused by increase in its supply is precisely inflation.
One could argue that the current environment is more stagflationary than inflationary (because of the concerns about GDP growth), but the main point is that the value of money is going down and precious metals investors know it best. Does the situation on the job market mean that the inflation is not a threat regardless of the money supply? Of course not.
Final drastic example why it cannot be the case. Let's imagine that one unemployed person received freshly printed $4 trillion from the Fed to spend it. Would it cause significant increase in inflation as the money supply would increase? Naturally. Would this fact alone cause any changes on the job market? No.
Second question we have received this week was about precious metals prices and the seasonal tendencies, which are pointing to lower prices in March. Our Subscriber wanted to know if we are incorporating this into our calculations.
We take the weak seasonal tendencies into account and are monitoring the markets closely for any signs of weakness. Monday this week, we actually prepared a sell alert based on weak volume during the daily upswing. Being conservative we were waiting to check if the market continues up on low volume - we didn't want to send out a message based on very limited information. Finally, the markets moved lower and since it was not accompanied by higher volume intra-day we concluded that it was a false alert and that no sell signal should be published, as what we've seen was merely a daily consolidation. Markets rallied on Tuesday, so being careful paid off. We will continue to monitor the markets and if we believe that the March weakness is likely to come into play - we'll let you know.
Third question was about gold:silver ratio that today is 1:41. Is this the limit or a turning point?
Gold: silver ratio is quite low now, as silver has outperformed significantly recently, however that does not automatically imply that we have turning point right now. In the final stage of the bull market we expect the gold:silver ratio to move close to the 1:16 level which is where it was also during the final part of the bull market (early '80s), which is also close to where the ratio traded during a large part of this century. Yes, that means a lot higher price of silver and this is what we expect.
However, in the meantime gold:silver ratio is likely to fluctuate as silver is much more volatile than gold is, and its more correlated with the general stock market because of the abundance of its industrial uses. At this point we would not want to provide a detailed target for the ratio because it has just moved above the previous high - a move which has not been confirmed - however, the situation appears bullish as the silver:gold ratio is now back into the rising trend channel. The $38 target for silver remains valid.
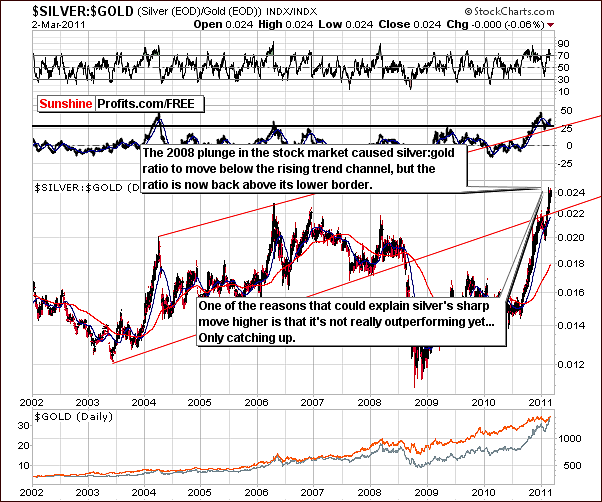
Please note that it may be the case that silver is not really outperforming in terms of its ratio. It's simply catching up, and the true outperformance remains to be seen, as the ratio moves closer to the upper border of the trend channel. The current rally in the ratio appears as an unprecedented event, however if one takes into account that the ratio truly plunged in 2008 when stocks declined, then it becomes more reasonable. The first part of the current upswing was still a correction of the 2008 decline, not really an excessive move to the upside. Consequently, the excessive part could still be ahead, meaning even more significant rally in silver. We don't want to put a number on that yet, but if gold moves to $1,600, then silver might even go above our $38 target level.
This could be viewed as extreme at this point, but please note that back in 2002, silver above $30 appeared extreme as well - yet we see silver above this level right now.
Summary
The USD Index outlook has changed this week from bullish to slightly bearish. The influence on the precious metals sector, however, is still slightly bullish.
The general stock market had rather lackluster movement this week following its recent breakout. This is still slightly bullish news for silver and the rest of the precious metals sector. On Thursday, gold’s decline was visible but did not move below the rising trend channel. This is important and the outlook for the yellow metal remains positive.
Declines in gold and silver stocks were barely visible and have not yet been confirmed. Consequently the outlook remains bullish for gold, silver and gold and silver mining stocks. We still feel that it is wise to keep open speculative long positions and will let you know if the breakout is verified. This would possibly provide an opportunity to add to long positions or if not verified, the time may come where it is a good idea to close them.
There is no change with regards to our feeling on long-term positions and we continue to believe that being fully invested in the precious metals markets with the long-term portion of your capital is wise. As always, we will let you know if anything happens which changes our outlook in any significant manner.
Our next Premium Update is scheduled for Friday, March 11th, 2011.
This completes this week's Premium Update.
Thank you for using the Premium Service. Have a great weekend and profitable week!
Sincerely,
Przemyslaw Radomski


