Things are getting crazy. The year started off with strange events like five thousand red-winged blackbirds falling dead on New Year’s Eve in Arkansas. We wrote that one of the major risks facing the world in 2011 is social unrest and the possibility that the Tunisian revolution will be a catalyst of rebellion and unrest across the region.
Well, we certainly got more than we bargained for.
Remember, it’s only two months into the year and already we have seen several attempted revolutions in Middle Eastern countries with two successful ones so far and another on the brink. There are reports of thousands of civilian deaths in Libya and Libya’s lunatic tyrant is threatening to burn the country’s oil fields.
Although there is absolutely nothing funny about this situation, it does bring to mind one of Robin William’s funniest comedy routines where Muammar el-Qaddafi (played by Williams) draws an imaginary line on the ground and says: “This is the ‘Line of Death.’ You cross it, you die.” The very unfunny thing is that Qaddafi is saying this to his own people.
We can only hope that in the long run democracy will be an engine for prosperity in these countries but we don’t want to be naive. It would be more prudent to brace ourselves for an outpouring of anti-Western, anti-American, anti-Semitic venom peppered with Islamic fundamentalism and a good measure of chaos and tribal wars. There is real fear that the Arab democracy movements will ultimately be dominated by extremists, as happened in Iran after the 1979 revolution that ousted the shah. Even if that does not happen, there is legitimate worry about chaotic transition between revolt and democratic stability, if it ever comes. We can, of course, expect higher oil prices and higher precious metals prices.
Thomas Friedman writes in the New York Times that the road to democracy will be a hard one. “This is not going to be a joy ride because the lid is being blown off an entire region with frail institutions, scant civil society and virtually no democratic traditions or culture of innovation.”
Global markets, still fragile, could be tilted off course if instability in the Middle East spreads. Markets largely ignored the revolutions in Tunisia and Egypt, two countries that are basically not that significant on the global economic scheme of things. They don’t owe much money to western banks, nor do they export large quantities of commodities, such as oil.
But markets certainly took notice this week of the violent upheaval in Libya.
Did you see what happened to the price of oil, gold and silver this week?
Gold closed at $1,402 on Thursday while silver moved above $34 - the highest price reached in 31 years. The rise widened the gold-silver ratio -- the number of silver ounces needed to buy an ounce of gold dropping -- to around 42, a near 13-year low. Oil climbed to the highest level in 30 months as Libya’s uprising reduced shipments from Africa’s third-biggest producer. The yen and Swiss franc strengthened, stocks declined and U.S. index futures dropped. Brent crude jumped 6.6 percent to $118.56 a barrel and futures for April delivery topped $103 a barrel in New York.
On February 14th we sent out a Market Alert saying: It seems well justified to move part of your long-term capital back to silver, as high-risk period is over, at least for now.
Silver was trading at about $30 and now, 11 days later in the pre-market trading, it is close to $32.7, almost a 10% increase. If on the day that we sent out the Alert you would have invested $100,000 in silver, you would have approximately $9,000 profit as of today.
There are ominous reports of thousands of people killed in Tripoli as anti-government protests reached the Libyan capital for the first time. The Libyan government attacked protesters, and rebels claimed control of the second-biggest city, Benghazi. Tens of thousands of Bahraini protesters marched in the capital demanding democracy.
In other events in the Middle East, Israel put its navy on alert as two Iranian naval vessels sailed through Egypt's Suez Canal on Tuesday, staking out what Israeli officials called a provocative, symbolic presence in the Mediterranean.
Saudi Arabia’s King Abdullah returned home this week after a three-month absence for medical treatment, probably to make sure that his throne is still intact. Although the oil-rich kingdom has escaped the unrest, there have been signs of domestic discontent over high unemployment. There are fears that that Saudi Arabia's Shiite Muslim minority could be inspired by the protests of their co-religionist neighbors in Bahrain. Despite the kingdom's lack of democracy and high youth unemployment few people believe that Saudi Arabia is ripe for the turmoil that has cut a swath through other parts of the Arab world. Saudis enjoy much higher incomes than most other Arabs.
When the then young colonel Qaddafi seized power 41years ago oil was trading at $3 a barrel. During the 1973 Arab oil boycott, which Qaddafi wholeheartedly cheered, oil raced to $11 a barrel. Today, with army helicopters shooting civilians, oil futures in New York flirted with $100 a barrel. Libya supplies 2% of the world’s oil.
Qaddafi appears hopelessly out of touch with younger generations. The former revolutionary vowed in a bizarre speech that he would fight to the last drop of blood. (He probably meant his peoples’.)
There are questions that need to be answered that only time will tell. Once the chaos subsides, will the new governments in these countries continue to support the dollar pricing policies on oil? This could have great implications for the dollar. If Bahrain falls, will it have a domino effect on Saudi Arabia? We could be on the brink of a new world order and we might not like it.
Pimco’s Chief Executive Muhamad El Erian wrote this week in the Financial Times that in the short run events taking place in the Middle East will be stagflationary for the global economy. He names three factors: First, higher oil prices will increase production costs and act as a tax on consumers. Second, greater precautionary stockpiling around the world will intensify pressures on commodities as a whole, aggravating the impact of demand-supply imbalances and large injections of liquidity. Third, the region will be a smaller market for other countries’ exports.
Domestically, having already countered aggressively the impact of the global financial crisis, western economies have little room left for further demand stimulus. Some have already embarked on fiscal consolidation, while for others it is only a matter of time. Moreover, recent evidence of inflationary pressures is already influencing the narrative of some central banks.
In the next few days, markets will react to the changed outlook for the region and the global economy. Higher commodity prices will be accompanied by greater risk aversion in the equity and credit markets. Over time, however, such market apprehension is likely to give way as the impact of greater long-term stability in a key part of the world is felt. In the long term, after all, democracy and individual freedoms are the best drivers of prosperity.
El Erian is optimistic for democracy in the region. The only true and vibrant democracy we know of in the entire Middle East is Israel. We can only hope and pray that Israel does not remain the only democracy in the region for long.
With everything that has happened with precious metals this week, let’s not delay any longer and let’s turn to this week’s technical part with the analysis of the Euro Index. We will start with the short-term chart (charts courtesy by http://stockcharts.com.)
Euro - USD Indices
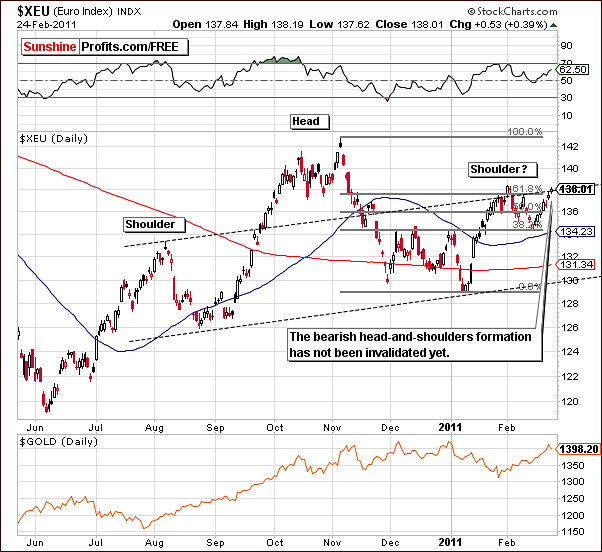
In the short-term Euro Index chart this week, we have seen a continuation of the bearish head-and-shoulders pattern. The general trend continues to be the opposite of that seen in the USD Index and a local top in euro is still likely to be seen in coming days.
The Euro Index level has recently moved to its previous February 2011 high but did not surpass this level. This is not yet a bullish development and continues to support the case for further development of the head-and-shoulders pattern. A downturn from here appears probable.
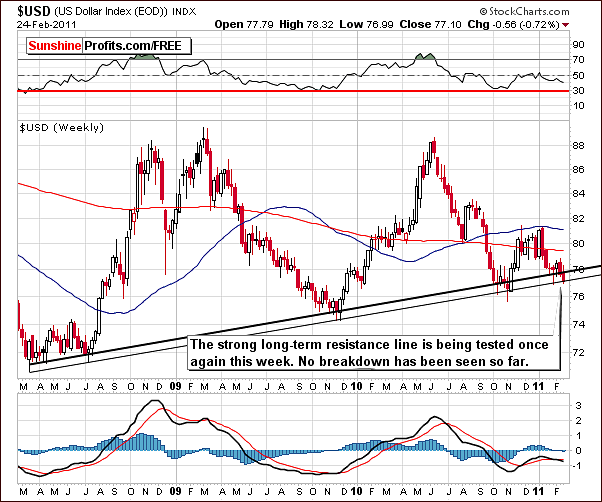
The main theme for the USD Index this week can be summarized as “although much has happened [on a day-to-day basis], little has changed”. The USD Index has moved to the long-term support line and this support line has therefore not been invalidated. Consequently, the trend remains up. A more detailed picture is seen in the short-term chart this week.
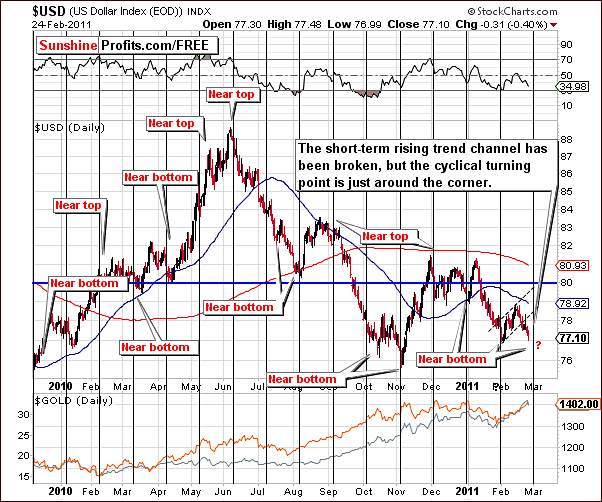
In this week’s short-term USD Index chart, we can see that the short-term, rising trend channel has been broken. The USD Index appears to be closing in on a cyclical turning point and since the current short-term move is down, a local bottom is suggested relatively soon. It may in fact be seen in the coming days.
The rising short-term trend channel has been broken, but the long-term trend is still up, which is more important at this point.
At this point, the influence on precious metals is not as clearly defined as it appeared a few weeks ago. Recently, a downturn in the USD Index coincided with much higher prices in precious metals. The previous positive correlation between these two markets seems to have been invalidated. More will be discussed on this topic later.
Although the USD Index analysis may not appear to be the best way to approach precious metals at this time, it continues to be a regular feature section in our weekly Premium Update. Perhaps it will be more useful in the weeks ahead.
Summing up, the influence upon gold in US dollars is not really visible. From a non-USD perspective, a rally in the USD Index is likely to make the non-USD gains in gold much larger. This will be further discussed in this week’s Gold Section.
General Stock Market
In the very long-term chart this week, we see some volatility and declines in the past few days. It is important to note that the downturn has not moved to levels below the mid-2008 highs. It seems at this point to be nothing more than a form of verification of the breakout above these highs.
The RSI is not severely overbought any longer. It’s still relatively high compared to its historical average, but it’s definitely not above the 70 level. This is one of the positive results of the recent slight decline and a few more days of sideways price action could cause further reduction in the RSI. This could be a gathering of strength for a subsequent rally.
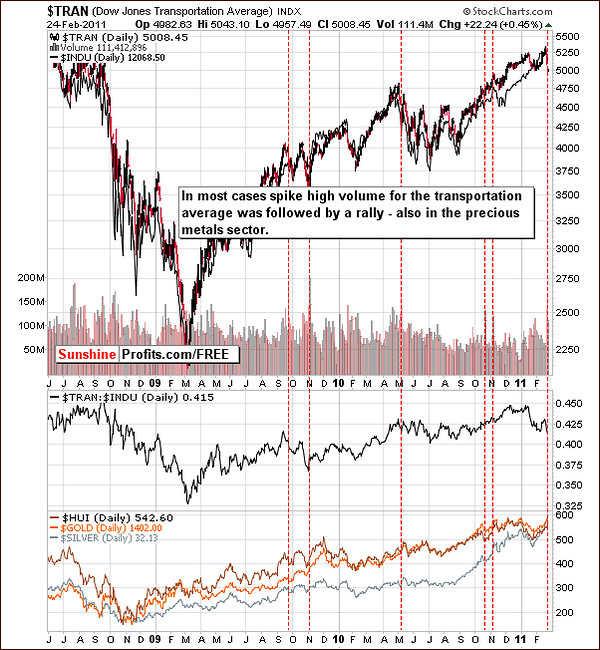
The Dow Jones Transportation Average Index is quite interesting this week. We have seen a decline on huge volume. Examining past similar moves, we see that in many cases this has been an indication that the decline is nearly over and higher prices may very well follow.
In the lower section of the above chart, we see the key parts of the precious metals sector: gold, silver and the HUI Index. Note that when high volume levels are closely aligned with local bottoms in the Transportation Average Index, a rally for at least the short term often follows. In other words, this is a bullish sign for gold, silver and mining stocks.
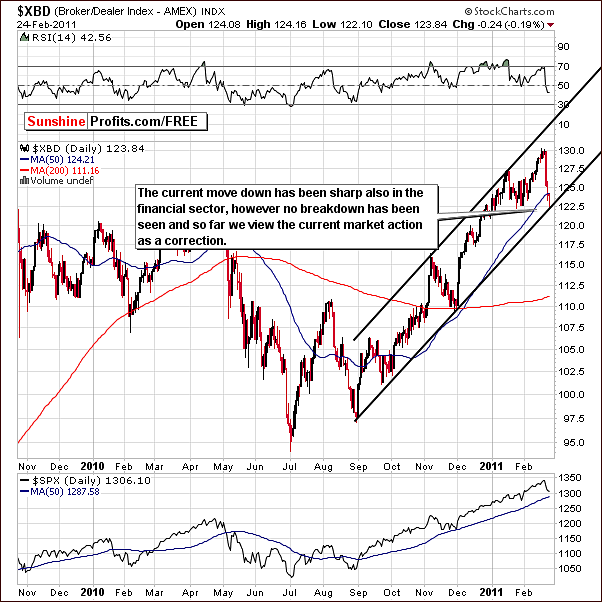
The Broker Dealer Index (proxy for the financial sector) level further confirms that the trend still appears to be up. Index levels moved down but are still within the rising trend channel – the trend remains up.
Summing up, the situation in the general stock market still appears bullish even though some declines have been seen this week. It is quite probable that we have simply seen a slight correction – a verification of the breakout above the mid-2008 highs.
Correlation Matrix
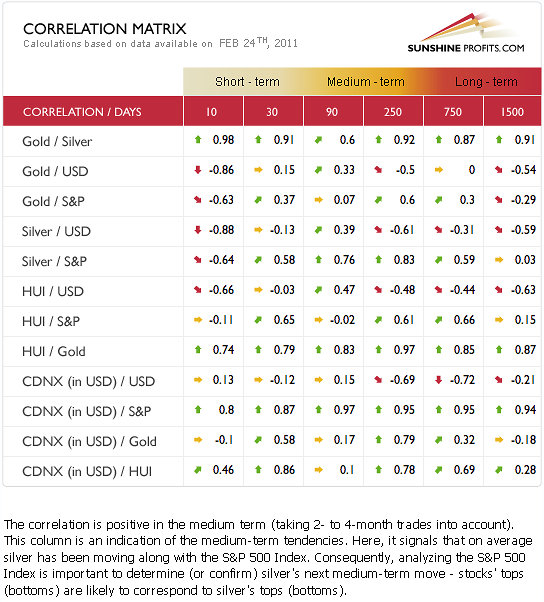
The implications for the short run continue to show stocks moving more or less in tune with silver. Note the high correlation coefficients in the medium-term columns. The general stock market is still above mid-2008 highs and this is bullish for silver and thus also indirectly for the rest of the precious metals sector.
Mining stocks have moved above their mid-2008 highs and are verifying this breakout. The same situation also applies to the white metal. No other significant correlations of the US dollar or stocks are seen here in the short run. Both gold and silver have been highly negatively correlated with the dollar but only in the 10-day column. This is simply a situation to watch at this point, not to draw significant conclusions based on that column.
The increased world geopolitical tensions appear to have increased the appeal of gold, silver and mining stocks as they managed to move more or less independently from other markets.
Gold
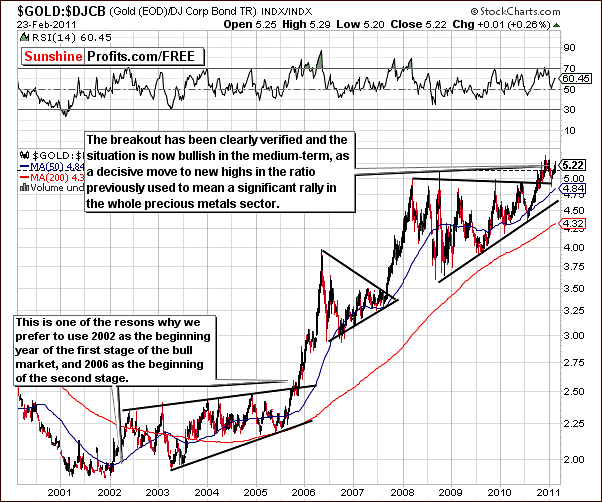
We begin our gold section once again with a look at the ratio between the price of gold and corporate bonds. This allows us a better analysis and understanding of the other long-term charts.
The recent breakout has been verified and the rally continues. Notice that the Gold: Corporate Bonds ratio moved sharply higher after reaching a local bottom a few weeks ago. It now appears about ready to take out its previous highs and it seems this is likely to happen soon. If so, a significant upswing throughout the precious metals sector is likely to follow.
Although there is always a possibility that such a trend could be invalidated, it seems more likely that the ratio will continue to move upwards. For this reason, we believe the medium-term outlook for gold, silver and mining stocks is bullish at this time.
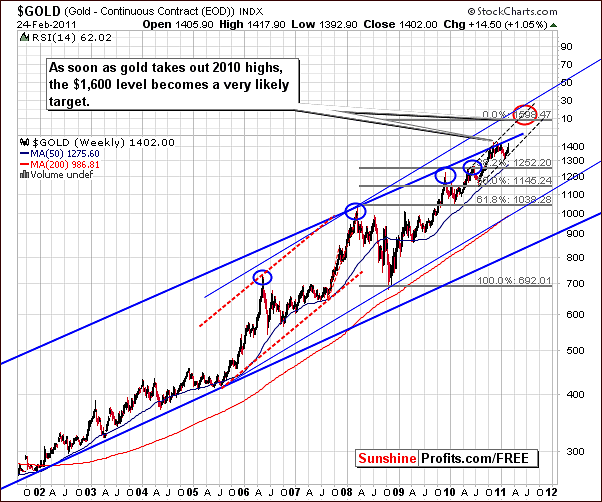
So, now let’s take a look at the very long-term chart for gold where we clearly see its recent price action close to the rising resistance line (upper border of the very long-term trading channel). Several months ago, the upper border of the rising trend channel was approached but not broken.
In the October 1st, 2010 Premium Update, we wrote the following:
Before the lower, less steep line is surpassed, it is likely that gold will first reach a local top and then go through a quick consolidation. This will most likely result in a greater strength and increase the odds of a further rally being sustained.
Two weeks later with gold considerably higher we stated:
Once again this week, this same trading channel has held and evidence continues to mount for a likely corrective phase to begin very soon. Gold appears unable to breakout above the resistance line and although its price did rise significantly in the past few weeks, there does not appear to be enough strength left in this rally to delay the inevitable correction much longer.
Since that time gold moved considerably lower and bounced. This action is clearly visible from the very long-term perspective, so the gold market appears ready to move above the aforementioned resistance level. The higher light blue line will then likely become the next resistance level. It seems that this is the most probable outcome going forward and target levels of $1,600 or higher would then be valid.
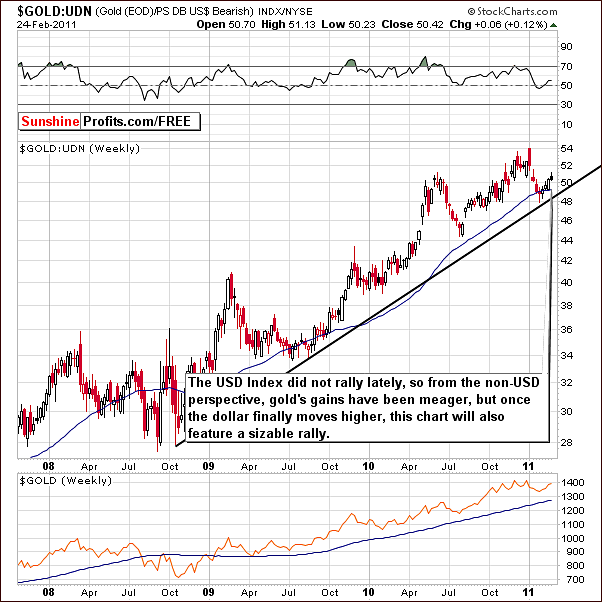
From a non-USD perspective, there is very little exciting news this week. Since no rally was seen in the USD Index, there is minimal impact on gold’s price from a non-USD perspective. Once the dollar does begin to rally strongly, and we feel that it will, this ratio will likely catch up in a big way as was seen last April and also early 2009.
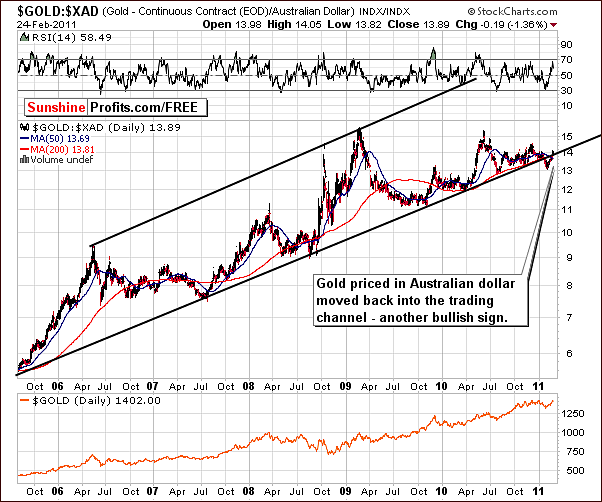
We decided to include gold’s chart from the Australian dollar perspective this week since a while back it was the only chart showing any bearish factors. It seemed like a good idea to see what it tells us today.
Significantly, there appears to be an invalidation of the previous bearish sentiment as the price of gold in Australian dollars has moved back above the rising support level. The previous breakdown appears therefore to have been invalidated. While it is true that we really need to see a few more days of price action within the trading channel, this does seem likely to be the case from here.
At this time therefore, this chart is bullish.
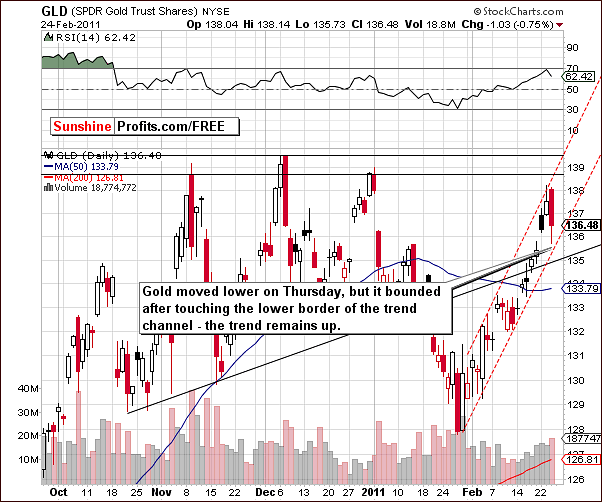
This week’s short-term GLD ETF chart reveals what may be viewed as a bit of scary price action on Thursday. Some Traders and Investors may feel that the intra-day price decline is an indication that bad days may be ahead. We do not agree.
Gold’s price is still well within the rising trend channel and it did move higher after approaching the lower border of the trading channel intraday on Thursday. This suggests that the support line is not likely to be broken soon and the trend appears to be up.
Another reason that we do not feel any bearish signals were given is that we have seen this type of price action within rallies in the past. This was seen on a single day during last October and it’s important to remember that the price action within a single day is rarely a big deal, if it’s not followed by a breakdown.
Summing up, a quick consolidation after recent decisive price increase is the more likely explanation for what at first glance appeared to be bearish price action on Thursday. This was in line with what we had written in a previous update and the situation continues to be bullish for gold at this time.
If we have at least a few days of consolidation here and then silver moves sharply higher, gold could move above its previous highs without another pause.
Silver
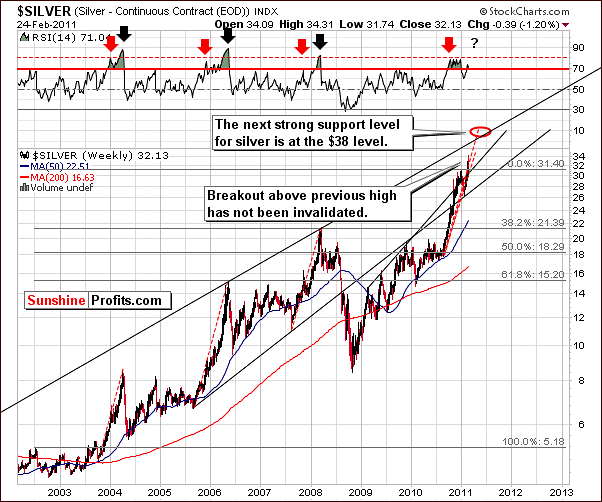
The most important signal which silver’s very long-term chart gives us this week is that the recent breakout above previous highs has not been invalidated by the price action seen on Thursday.
Moreover, the RSI, which is based on weekly closing prices, is not close to 80, which is normally the RSI level which confirms that silver’s second and final top is in during very strong rallies. Therefore, the sentiment at this point remains bullish.
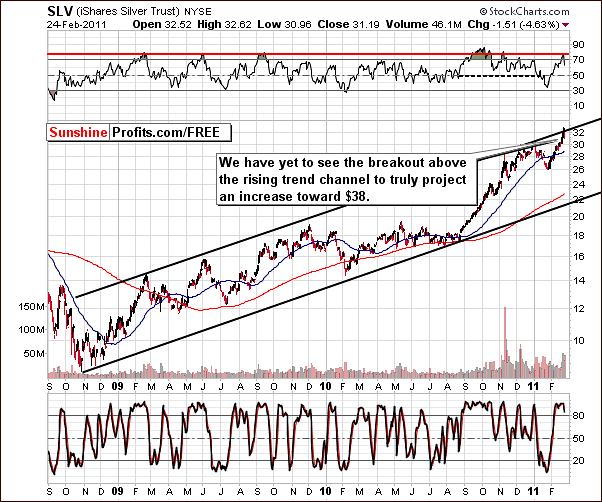
As we zoom in a bit closer, we can clearly see the breakout above previous highs. It is also of note that no breakout above the rising trend channel has been seen thus far.
The possibility of a short consolidation period is real. It would likely be followed by a further uptrend and a possible move above the resistance line on a second attempt. More details on this will be apparent in the short-term term chart coming up soon.
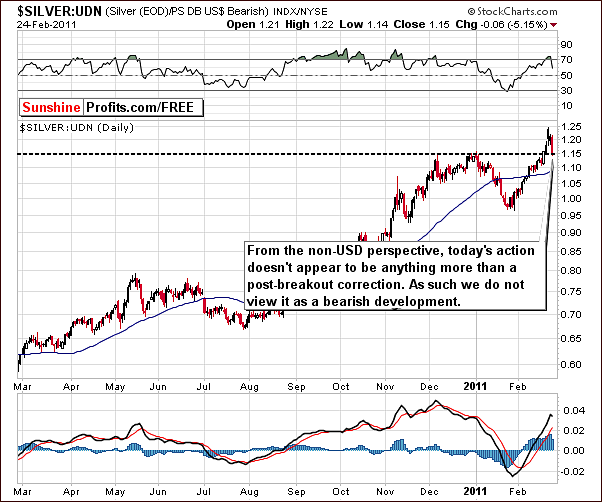
In this week’s non-USD chart, we can now see a confirmation of the recent breakout. The ratio has recently declined to the level of previous highs but still remains above previous highs. It is possible that some sideways movement will be seen for a few days and, if so, could be the foundation for a subsequent rally. In short, the signals are not regarded as bearish at this time.
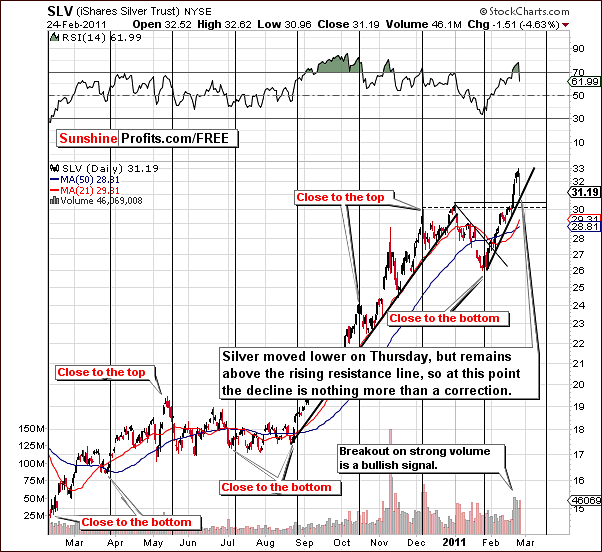
In this week’s short-term SLV ETF chart, we can see the breakout above the rising long-term trading channel. Index levels did not decline neither below the previous highs, nor below the rising support line. Consequently, silver still appears to be in an uptrend. A few days of sideways movement could actually result in a gathering of strength in preparation for the rally to follow.
Summing up, day-to-day price action may seem somewhat scary at times but the important thing to remember is that it seems that the trend does remain up. No significant, bearish signals pointing to a downturn are apparent at this time.
Mining Stocks
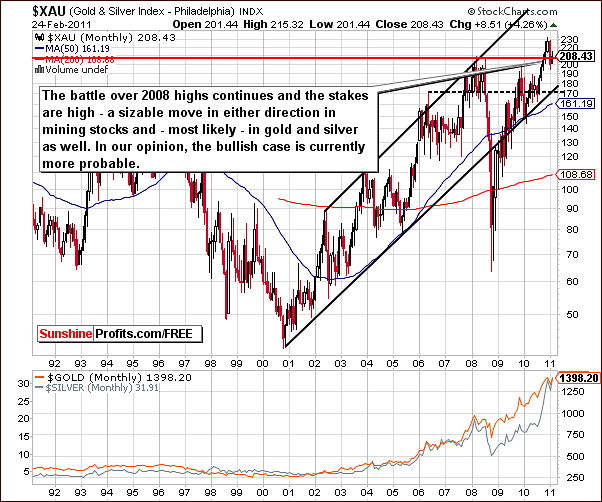
The very long-term XAU Index chart is a proxy for Gold and Silver Mining Stocks. This week we continue to see a fight for new highs. Index levels have recently moved back and forth flirting with the 2008 highs.
Once all is said and done and a decisive move is seen in either direction, it is likely that a bigger move will follow. Based on past behavior here and signals from other charts, it seems more probable that the index levels will move higher.
This is in agreement with what we stated in our last week’s Premium Update. We stated that based on silver’s price action this week, as well as the performance of mining stocks (closed above 2008 highs), it appears that a bullish move here is slightly more likely. We stand by this once again this week.
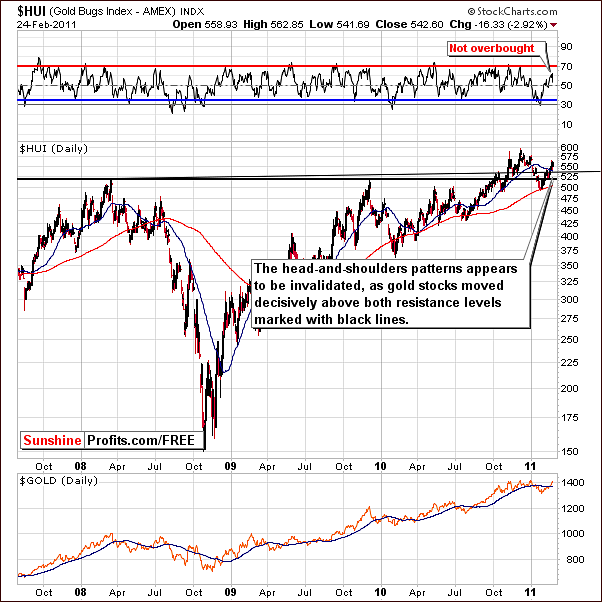
In the HUI Index chart this week, we see the index level is above both resistance levels marked with black lines and the breakout is in the process of being verified. The head-and-shoulders pattern which was under development last week has nearly been invalidated. This would of course be a bullish development.
It is our opinion that the breakout will likely be verified and it is therefore probable that the head-and-shoulders pattern will not be completed. Our outlook going forward is bullish based on the information found in this chart and also based on the one below.
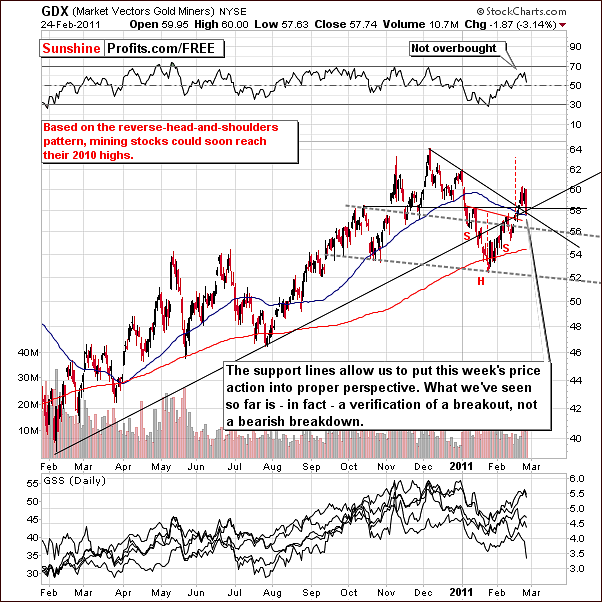
In the short-term GDX ETF chart, which is a proxy for the mining stocks, we see that the declines, which took place on Thursday and a few days prior, have simply been part of the breakout verification process. Until a breakdown is seen, we should not view this situation as bearish.
In the previous Premium Update we wrote the following about the mining stocks (below the GDX chart):
Several days of consolidation or sideways movement may be seen now or even beginning a few days from now at slightly higher levels. We do not see any confirmation at this time as to which is more likely. At this time, exiting long positions does not appear to be justified, because the short-term uptrend remains in place.
Index levels remain above multiple resistance lines and although disturbing on a day-to-day basis are not bearish in and of themselves. Target levels remain in place, as reaching the late 2010 highs is expected based upon the reverse head-and-shoulder’s formation.
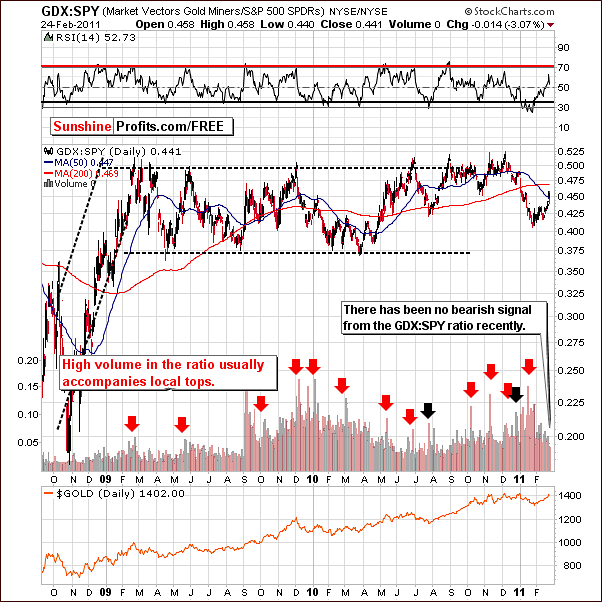
The GDX:SPY ratio chart is often used to reveal a sell signal. In other words, we usually see a spike high volume in the ration close to a local top. Such action would be attributed to the volume in mining stocks being high compared to other stocks.
We have not seen such a signal here this week and we have included this chart for this reason. Mining stock volume levels have not been high compared to volume accompanying moves in other stocks and consequently the volume ratio has not spiked.
This lack of bearish signal is additional information in favor of a rally in mining stocks although perhaps a few days pause may be seen first. The important point is that a rally is clearly more probable than a downturn based on the price and volume action seen in this chart.
Summing up, as with gold and silver, recent day-to-day and intra-day price action has been somewhat frightening for mining stock Investors. The situation however has not changed and we continue with our bullish sentiment going forward. If a breakdown is seen or if the situation should change, we will let you know immediately with a Market Alert or in the following Premium Update depending on when such change would materialize.
Letters from Subscribers
This week we have received a question that keeps coming back like a boomerang. The U.S dollar goes down. Riots in the streets. No jobs. How do we all survive? (…) If the dollar is worthless how does this [profits from precious metals stock investments] help me???? I am really confused. It is great to see my money growing. But if all hell breaks loose (which appears it will), how do a turn my million dollars of great panther stock or whosoever into something that I can use??
You expect a boomerang to come back, so we were already prepared for this question. The most appropriate way to deal with this issue is by diversifying among various strategies (approaches). If you would like to read more on this topic, as far as choosing positions sizes is concerned, please read our essay "The Universal Investor. Speculation and Investment".
At the moment we think there is high probability that Canadian, US and Australian securities exchanges will survive as a viable marketplace for precious metals stocks. If they collapsed, we believe that this shock would push prices of physical metals much higher, thus making up for the losses on the paper markets. Moreover, please note that if you own a stock that gives you more rights than just a derivative instrument. Being a shareholder means owning a part of the company. Even if the USD is destroyed, you still own a part of a company, which mines something that has just most likely doubled in price or so.
Is it really a problem if you can’t value your shares using dollars? The company: managers, employees, machinery etc. would still be there. The odds are that even if there is no USD, we would still have some form of money – not that we would go back to the barter system. Since that would most likely be the case, the stock might not be priced in USD, but in some other form of money. Consequently, we doubt that stock investments would become worthless even if the dollar collapses.
In other words, we think that using paper markets for leverage is a good way to go, as long as one remembers to have the physical as well.
This leads to another question. When do you expect the USD to crash and gold to sky-rocket? The dollar crash is talked about for years now…
It's impossible to tell. One speculative attack on the USD could begin a dramatic selloff as either party holding large amount of dollars (Japan, China, ...) could panic and dump their reserves on the market. This would trigger even more dumping and before you know it, the financial system as we know it could cease to exist. This is not likely to happen any time soon - the powers that be still have aces up their sleeves. As a general rule, currency- and financial crises take place later than everyone expects, but when they finally do occur it happens in a fashion more rapid and more brutal than anticipated.
It's like building a house of cards - if you are very good at it, and you take your time, you can build a house that is very high, but you can't convince anyone that if you keep adding more cards, you can do it indefinitely. Why? Because most people tried it and know that it's impossible. Now, when it comes to international economics and monetary policy very few people are able to 'try it' and see the immediate effect. This time the details are more complicated, but one can look at it this way - if someone will build a house of cards 50 years now, does it still mean that this house has to go down eventually? Most likely, yes. Why? Because past experiences (history) and pure, cold logic proves this to be the case.
In our view, it is impossible to tell when the dollar will definitely crash and gold will definitely sky-rocket, but instead of trying to guess that date, we prefer to design and follow a strategy that will make our capital grow regardless of that date. We think that putting part of one's holdings into precious metals bullion, part into mining companies as a long-term investment, and using the rest to speculate in the short- and medium term is the way to go. Thanks to this approach one is protected against a serious financial turmoil, positioned in a sector that has very favorable fundamentals (long-term growth) and thanks to speculation one is able to make money along the way. As mentioned before, we wrote about this approach in the 'Universal Investor' essays - you can find them in the Research section.
Summary
The USD Index declined this week but is still above its long-term support line. It is approaching a cyclical turning point and is still likely to move higher soon.
The general stock market is verifying a breakout above previous highs and the same situation is also seen for silver. Gold and mining stocks have also moved lower in the past few days but are still above their respective support lines. The trend remains up and recent price declines appear to be attributed simply to a short period of consolidation.
We mentioned the possibility of small consolidation periods in the precious metals markets in a recent commentary. Seeing this now leads to us to refrain from any serious bearish sentiment. If further developments unfold which change our outlook, we will let you know accordingly. If gold, silver and mining stocks rally from here, it will mean that the verification is completed and at the same time it will provide another favorable buying opportunity – important news for Traders who missed the previous one.
Our next Premium Update is scheduled for Friday, March 4, 2011.
This completes this week's Premium Update.
Thank you for using the Premium Service. Have a great weekend and profitable week!
Sincerely,
Przemyslaw Radomski


