
We recently devoted two issues of our Premium Update to the idea of gold as a safe haven in times of economic and geopolitical upheaval. Recently, The New York Times picked up the topic. But the fact that it is featured in the mainstream media does not have us worried about our long-term gold investments, at least not yet. There is an old saying among seasoned investors that the time to dump an investment is when it is "discovered"by the popular media. But in the case of gold we are still far away from that point. Still, the increase in gold's gleam in the media means that a local top is not far away - which is consistent with what we wrote last week. In fact, this is outlined in our Top or Not? list useful while timing major tops in gold, silver, and mining stocks.
The article talks about gold buyers traditionally being motivated by fear. But what has changed recently, according to the New York Times, is that some of the most respected investors on Wall Street are now among the fearful. The thrust of the article says that fears of inflation, deflation, government borrowing or the plunging euro have set off a dash to gold "illustrating how fears of economic turmoil have moved from the fringe to the mainstream. And gold bugs, often dismissed as crackpots who hoard gold bars in the basement, are finally having their day."
Although we don't like to be described as "crackpots," it is true that we are finally having our day and we expect it to be mostly sunny with scattered showers.
The age-old refuge of gold is relevant again, claims the article and points out that the United States Mint is running short of gold coins, South African companies increased Krugerrand production by 50 percent late last month and sales of American Eagle one-ounce gold coins tripled in May from the previous month. And to illustrate just how far gold has moved into the American mainstream, the paper goes bipartisan by holding up investor George Soros on the political left and Fox News commentator Glenn Beck on the right as examples of the new gold enthusiasts.
The article covers some of the same issues we have discussed extensively in Premium Update, including the concern that US government borrowing is unsustainable and the day of reckoning is at hand.
If governments print more money to pay off their debts, the logic goes, inflation will destroy the value of the dollar, the euro and other paper currencies - thus enhancing the value of gold. What is more, with tax increases unlikely and with Europe on the brink, the unthinkable - a sovereign debt default or the collapse of the credit system - has suddenly become thinkable.
Central Bank Gold Report
Speaking of governments, it seems that central banks are also catching the gold bug. According to the latest findings of the World Gold Council, gold reserves held by countries now total 27,069 metric tons, up from 26,356 a year ago.
The U.S. government remains the world's biggest hoarder of gold, with more than 8,100 tons in reserve, according to the World Gold Council. The governments of Germany, Italy and France follow. The central banks of Germany and Italy made no changes to their gold reserves over the last year, while France pared its holdings by about 15 tons, according to World Gold Council data. India, the world's largest consumer of gold, made news when its central bank bought 200 tons from the IMF in November 2009. Russia, meanwhile, has been stocking up on gold for years, adding more than 26 metric tons to its reserves in the first quarter of 2010, according to the World Gold Council. The Philippines has boosted its gold reserves by about 10 metric tons.
China is a "Stealth" Gold Buyer
What we find most interesting is the rapid rise of the gold reserves in China. China's gold reserves presumably held steady at 1,054 tons year-over-year, according to the World Gold Council, but it might be the case that the Chinese like to keep their cards close to the chest. Just a little more than a year ago China revealed it had quietly purchased 454 tons of gold over a six-year period, mostly from its own mine production. China is widely believed to be quietly adding large quantities of gold to its reserves keeping the purchases secrete so as not to push gold prices higher and the value of the dollar lower. (China is also the world's largest holder of U.S. Treasuries.) Although China is the world's largest producer, it consumes all of its production.
The Chinese government legalized private gold investment only about three years ago after banning it ever since the Communist revolution in 1949. More than five decades of pent up demand, the establishment of domestic spot and futures markets, the introduction of a national gold-investment distribution system through banks and retail shops, the rise in personal income and a growing middle and upper classes means that China will play an increasingly large role in global supply-demand trends.
Today, gold investment is not only legal in China, but it is actively encouraged. Physical bar and coin purchases this year will probably total 100 tons or more and physical investment will continue to grow from year to year.
It is also interesting to note how little gold has been sold by the 18 European countries covered under the Central Bank Gold Agreement that allows them to sell up to 400 metric tons of gold. Through the first eight months of its latest fiscal year (ends September 2010), only a tenth of that amount changed hands, nearly all of it being sold by the IMF to raise money to aid nations strapped by the economic meltdown.
The Chinese Yuan Rises
A rather important piece of news last week was China's central bank setting a key daily rate for the renminbi (Yuan) at its highest level in five years suggesting possible further gradual increases. Economists have charged that the Chinese government has kept the value of its currency artificially low to make its exports more attractive and Beijing has faced considerable international pressure to allow the renminbi to rise against the dollar.
The currency's 0.42 percent rise on Monday was its biggest one-day move since 2005. Though seemingly small, Monday's gain represents an extraordinary change in China's currency stance. Since this move will make Chinese goods more expensive to foreign buyers, we would need to see more decisive moves here to believe that this is a true change in the approach toward their exchange rate policy, not just a temporary see-here's-the-increase-give-us-a-break move.
We have also read reports that China's policy-makers are already engineering significant wage increases across the economy-and plan to continue doing so over the next few years. This will keep Chinese consumers spending, a propitious economic scenario for gold.
To see if the near future is propitious for gold let's begin this week's technical part with the analysis of the euro. We will start with the long-term Euro Index chart (charts courtesy by http://stockcharts.com.)
Euro and USD Indices
Since the euro and USD are so closely aligned and have such profound effects upon one another, we have decided to combine them into our opening section so that we can easily transition between them as we begin this week's update.
It is our goal each week to provide clear, concise analysis to our Subscribers and to do so in a progressive manner. As always, your feedback is valuable to us and is regarded with utmost importance. Please comment anytime with respect to any of our publications.
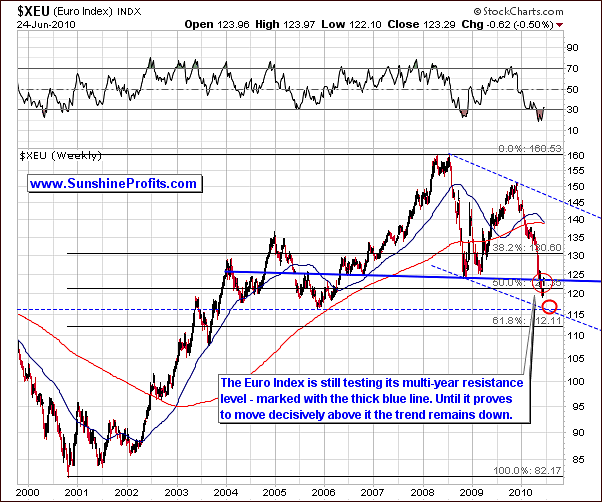
This week's Euro Index chart reveals a rather uneventful week and we see little change over the past five trading days. The euro stayed below the strong, multi-year resistance level with generally sideways movement this week.
Last week we commented on the lack of signs indicating an end to the downtrend in our euro section. We have seen general sideways movement this week with the euro remaining below the resistance line. For this reason, we are still not bullish for the near-term.
The thick red ellipse on the above chart shows a target in the range of 116-117. This is consistent with our bearish sentiment for the next several weeks. This is, however, bullish for the USD, which of course, is significantly affected by its most important component, the euro/dollar exchange rate.
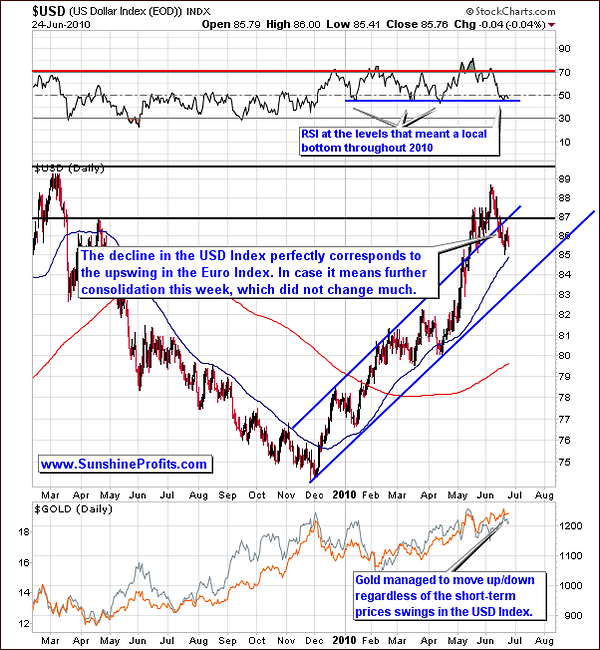
We now move to some technical analysis of the long-term of the USD Index chart. Presently we see that we are close to the range of the 50-day moving average (the blue, upward-trending line within the trading channel.) Throughout 2010, this situation has coincided with local bottoms (and in 2009 with local tops) and it is likely that we are again near such a point. This is further confirmed by the RSI indicator, as visible in the upper part of the above chart.
The implications for precious metals are truly not significant at this time. Therefore, we continue to hold our position as stated in previous updates for the precious metals sector. Once the present trends of the euro and the USD have reversed course and show a more definite trend, they might have a greater impact than seen today - we will report to you accordingly.
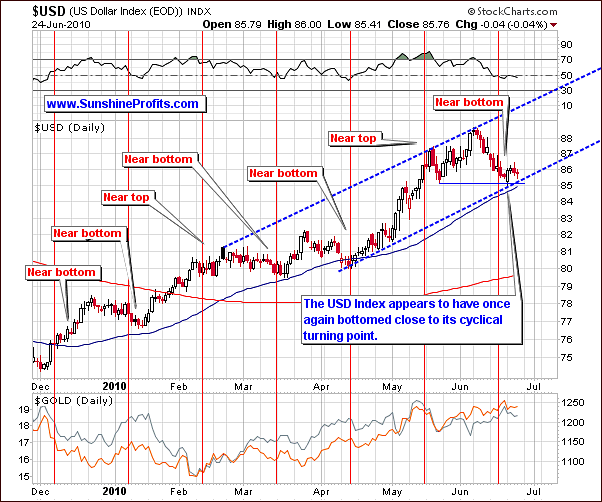
The short-term chart provides more details about what actually happened day to day within the past week. The red vertical lines on this chart normally align with tops or bottoms and it seems likely that we've reached a bottom within the past couple of days. This is also in the range of the lower border of the short-term trading channel.
Note that the USD nearly moved out of the rising trend channel recently only to reverse direction and settle well within it. The short-term chart provides us with details of this action as the lower border of the trading channel is clearly visible. Taking all these factors into consideration, it appears quite probable that the USD is currently very close to its local bottom. This in turn makes an upward move likely in the weeks ahead. This will likely correspond to further decline in the euro.
Summing up, the euro and the USD have recently wavered and no clear direction has been evident. For this reason, the precious metals sector has felt little impact from these indices. It may be the case that gold and silver will be affected to a much greater extent once the euro bottoms and USD tops. It is just a speculation at this point, but if these currencies reverse their trends the possible influence on the precious metals market might be big, so we will continue to monitor this situation on an ongoing basis. As always, we will keep our Subscribers informed of any and all important developments.
General Stock Market
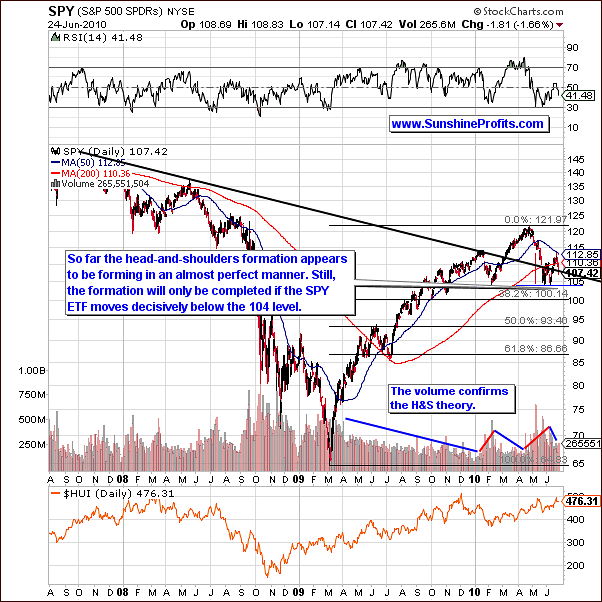
Last week, we devoted a great deal of our General Stock Market section to the emerging head-and-shoulders pattern on the long-term chart. Price and volume trends this week further confirm the likely full development of this very bearish pattern. We have seen declines in price along with increased volume levels. This will be more visible in the following part of the update where we study analyze short-term chart.
Note in the long-term chart, SPY ETF is close to the declining support level indicated by the black line above. It is possible that a slight upswing may be seen. This would not invalidate the emerging head and shoulders pattern unless a significant price increase was accompanied by high volume levels and if it took the value of the ETF above the $115 level. This is not expected to occur soon. It is much more probable that any upswing will be accompanied by low volume and thus short lived. The full development of the head-and-shoulders pattern continues to be quite probable. This spells trouble for stock prices in the following months.
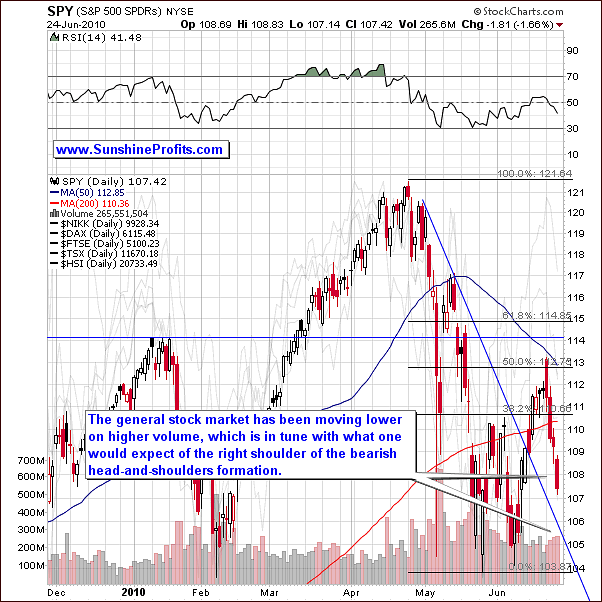
This week's short-term chart reveals that volume levels and declining prices have been far less dramatic than in prior weeks. We have seen sharp declines become the norm but it is important to remember that a daily or even weekly upswing would not invalidate the bearish outlook we have at present. Only a move to a level greater than 115 or so on high volume would accomplish this feat. We are far from this level today and see no signs of this as even a remote possibility in the near-term.
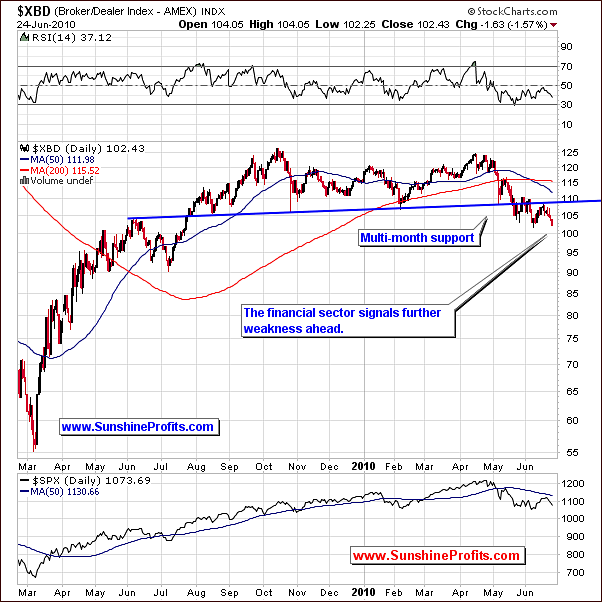
The Broker-Dealer Index, i.e. the financial sector this week confirms points we have made earlier. Note that the present level is close to previous lows. In fact, we are quite close to the lowest close since July, 2009.
It is important to note here that the financial sector often leads the other stock indices and the fact that we are presently at an 11-month low is quite important. Indications are that the general stock market will likely decline during the summer months reaching a probable bottom in the fall. History then supports a likely rally for much of 2011, a pre-election year for the U.S. President. This cycle of bullish markets has been in place for each pre-election year for nearly 80 years.
Summing up, the bearish sentiment professed last week has been further validated by the markets this week and we remain bearish for the medium-term. The possibility of temporary upward moves leads us to a neutral sentiment for the short-term (1-2 weeks). Historical trends have significant effects on market emotions, often overriding other underlying factors. Simply put, the strong patterns, which exist around and before U.S. Presidential election years cannot be ignored. At the same time, the head-and-shoulders formation could cause the main stock indices to move much lower during the summer months.
Correlations
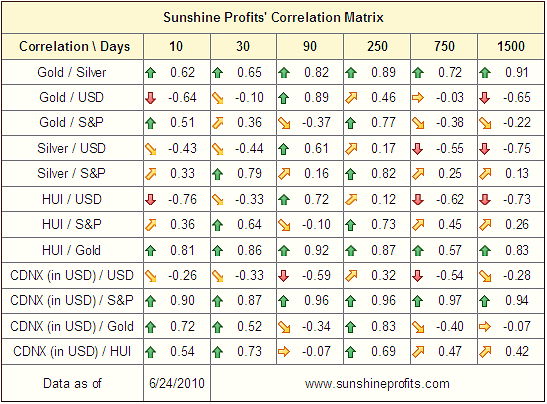
The correlation matrix is mainly used to seek information on how the major markets and indices impact the PM sector. We see very little change as compared to last week. However, several factors are worthy of note. Gold seems to be moving independently of the USD. Note the correlation coefficient is close to zero, that is, very low. This indicates near total independence as compared to the USD trends. The 30-day column does show a positive correlation in the range of 0.3- 0.4 but this is really not significantly high.
The main inference from this chart is that gold is less likely to be affected by weakness in the general stock market than silver and mining stocks. Note that their correlation (based on the last 30 trading days) hovers around 0.7. This is a strong correlation, which indicates likely movement in the same general direction. Finally, we see that juniors are also highly correlated with stocks, which is normally the case.
Summing up, given the current bearish situation on the general stock market gold itself appears to be the best option for the vast majority of Precious Metals Investors and Traders. This is consistent with what we have stated for several weeks. The risk/reward ratio has been and continues to be more favorable for gold.
It does not mean that silver nor mining stocks will not move higher along with gold - it means that the risk of them being negatively influenced by move lower in the main stock indices is higher than it is the case with gold. In other words, silver and mining stocks are not a bad long-term investment, but a more significant decline in these two sectors could occur if further downtrends continue in the general stock market. Simply put, gold is preferred in the short and medium-term. Silver and mining stocks continue to be quite risky for speculative capital at this time.
Gold
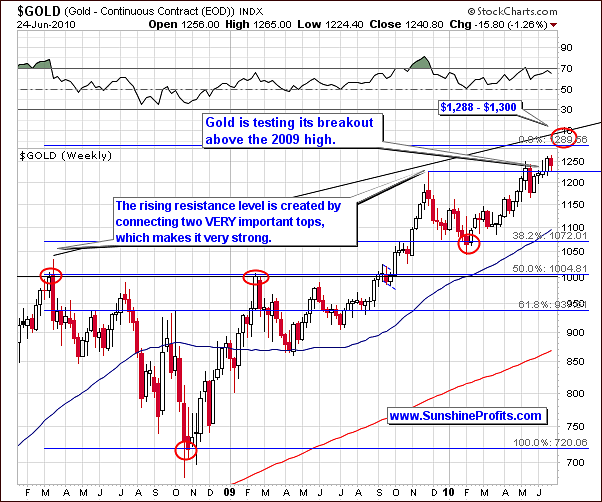
Gold's recent rally stalled somewhat this week. Although much volatility was seen intra-day, daily closing prices showed little movement in the last few days (more on that below.) The slight move lower - and consecutive upswing - has once again verified gold's breakout above its 2009 high.
Therefore, although the recent move down caused the gold market to decline, at this point the weekly chart suggests that this move was nothing more than just a verification of the previous breakout. Consequently, the huge rally which gold has shown for the past four months may not be running out of steam yet.
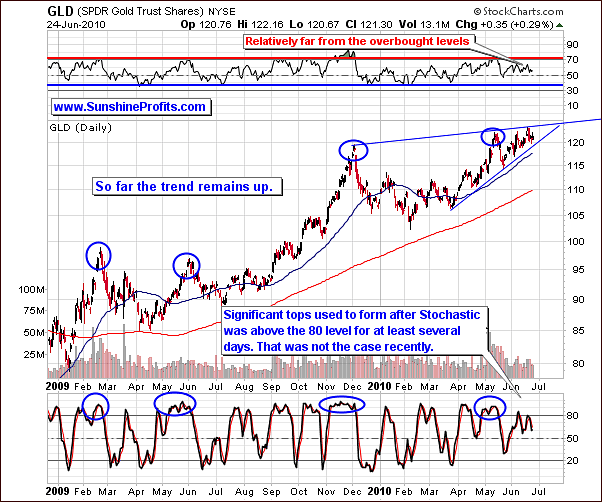
All in all, not much change was seen since last week. An appropriate motto could be much has happened but little has changed. The trend is still likely to be higher although we have seen increases followed by decreases throughout the past several days. Still, gold is within the rising trend channel, the RSI is slightly above middle range, and the stochastic indicator is below 80 (and it was not clearly above the 80 level, which was the case before previous tops were formed.) These indicators clearly show there is room for an additional rally. Any gains seen in the near-term, however, are likely to be less than spectacular, as at this point we don't see gold moving much higher than $1,300 before the final part of this year.
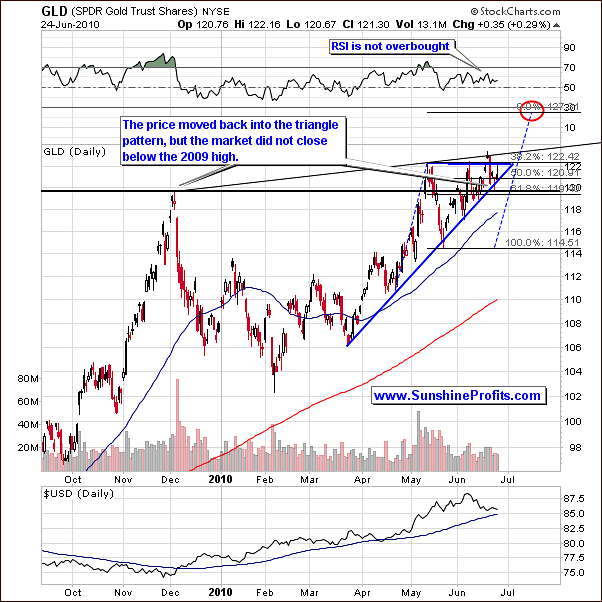
We now turn to the short-term chart for more specific timing details. Gold's price was seen to move to the 2009 high level briefly, then moving above the rising support level. It's breakout from on ongoing triangle pattern has therefore has not been confirmed. Although movement back to the triangle pattern did occur, this move did not go below the existing pattern. As this week ends, gold is still within its recent triangle pattern and could go either way to break this trend. Mostly triangles are sign of a continuation, especially if the previous move was up. Consequently, the situation is a little less bullish than it was the case a week ago, but our target (at or slightly below $1,300 in spot gold) remains intact.
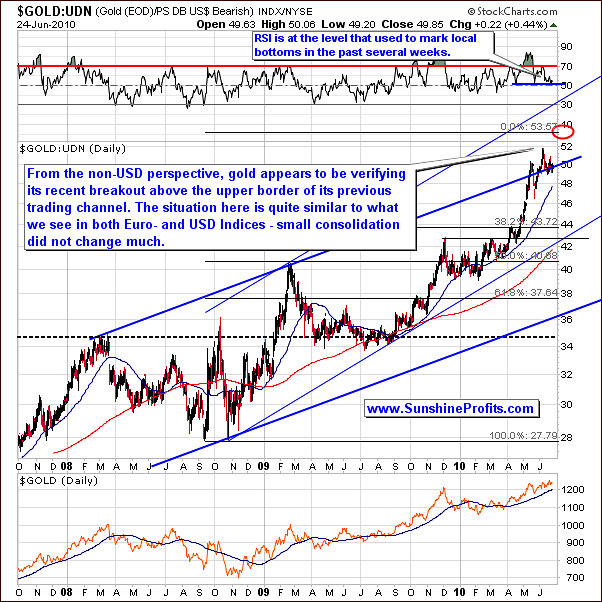
From a non-USD perspective this week, very little has changed. Keep in mind that viewing gold from a non-USD perspective is truly a mix of the gold market itself, and the USD Index (the latter being mostly influenced by the Euro Index.) As you have seen in earlier sections of this update, the USD and euro currency markets are somewhat wavering and gold itself has significantly slowed its upward move. Our target price for gold is still above today's level. This was unchanged from our previous update and the situation from a non-USD perspective is also basically status quo.
The USD Index is likely to move upwards as the euro declines in the near-term. Hence, gold will be worth more also from a non-USD perspective. The RSI is not in an overbought range. In fact, it is at a level, which recently marked local bottoms. Note that it was the case also with the April bottom that preceded a big rally resulting eventually in an overbought RSI level.
Before moving on to silver, a note about gold's recent volume is in order here. Daily levels have been low of late and little movement has been seen in daily closing prices. Still, it doesn't seem to be something to be overly concerned with, as gold did not do much as far as daily closing prices are concerned, so there's no divergence (we would see one if gold moved visibly higher on visibly lower volume.)
Summing up, the implications for Gold Investors and Traders did not change since the previous Premium Update was posted. Gold continues to trade at levels within its current triangle pattern. It is probable that this trend will come to an end soon and gold will move out of this pattern likely to higher levels.
Silver
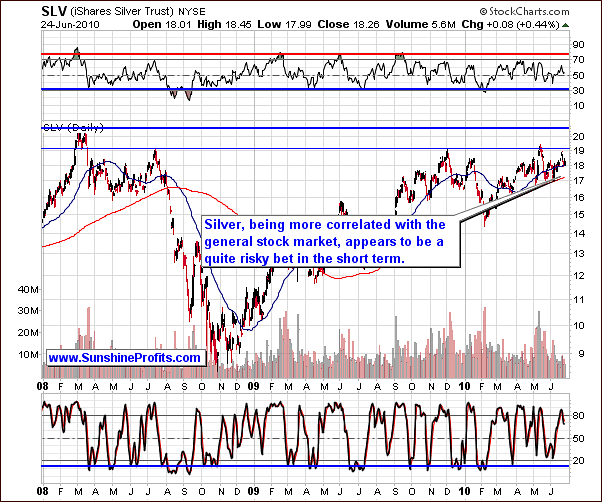
On the long-term chart for silver, we see recent movement in tune with that of gold. Prices dipped slightly and a short consolidation period followed. By nature, silver is more correlated with the general stock market than gold is and this continues to be the case. Due to this fact, betting on higher silver prices at this time is more risky. The recent price movements in the general stock market indicate a likelihood that the recent downtrend is far from over. Further declines will inevitably increase the likelihood of declining silver prices as well. Gold has been and continues to be a much safer speculative vehicle.
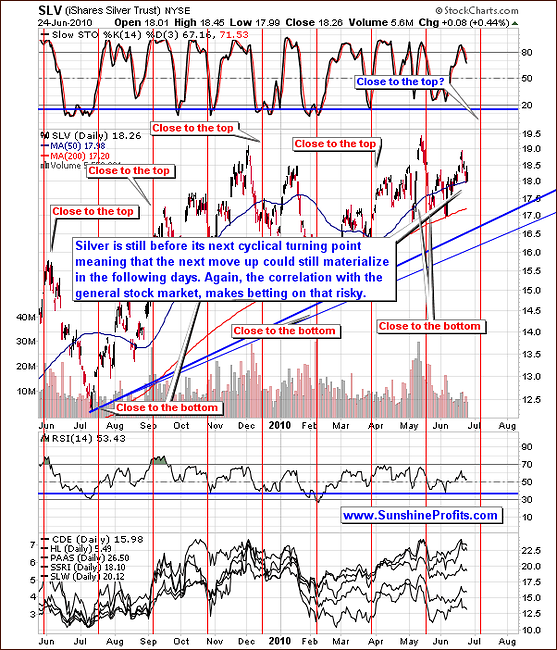
The short-term chart this week clearly appears to be more bearish at the first sight. Volume levels were lower when silver's price rose as compared to volume levels on declining price days. In reality, the movements up and down were so minimal (taking the closing prices into account) they are barely visible on this chart. With an increase of $.08 through Thursday of this week, the move was less than half of 1%. Coupled with minimal volume, this lackluster activity is clearly of little significance. Points made in our previous updates with regards to silver's risk and near-term price trends are still intact.
Summing up, gold and silver present similar investment scenarios with the latter being more risky at this point. We expect gold will consolidate briefly and move upwards to a likely mid-July top. This is consistent with what we stated in our previous updates.
Silver may outperform gold slightly during the final stage of its rally, but gold would have to move out of its triangle pattern and then consolidate before any consideration would be given to preferring silver over the yellow metal.
Precious Metals Stocks
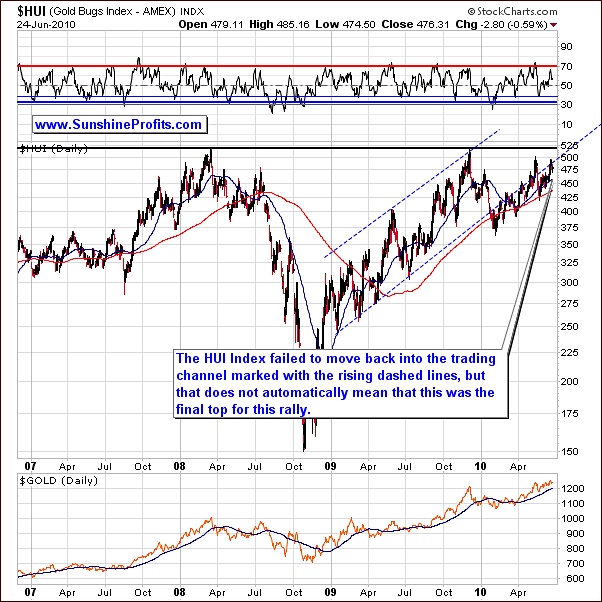
The long-term HUI Index chart this week provides us with some data worthy of a comment here. Note that although the index failed to reenter the trading channel, a bearish sentiment is not warranted.
This can be easily explained. The RSI rarely shows a single spike when reaching a local top. Note that in December 2009 as well as mid 2009 and late 2008, each top was accompanied by an RSI, which first had what could be called a pre-spike prior to the spike marking the true top.
We have recently seen a single move to a near 70-level (not even above it) but wish to emphasize that this does not necessarily mean the top is in. It is likely that the next move, possibly above 70 will mark the top. This is consistent with what we stated last week and earlier in this update. It is still probable that precious metal's price will rise with a local top forming in mid-July.
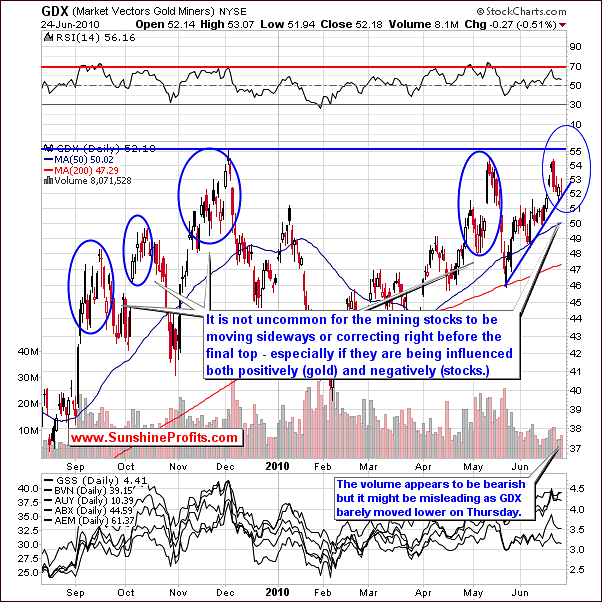
A look at this week's short-term GDX ETF chart confirms what we stated in the previous section. In this chart, several multiple-tops are clearly visible. These are defined by the initial sharp move upward, a correcting or consolidating period, which is quite short, and then a strong upward move.
Note that we have recently seen an initial move close to 70; this is rarely a final top. Points made earlier on this topic are confirmed here by the price level of the GDX ETF itself, which appears to have bottomed at the short-term support line.
Volume levels have been higher recently with price declines than with price increases. This is normally a bearish sign. There is one flaw in this chart, which we wish to make note of here. Namely, the volume will be presented on the above chart as a red bar along with a daily decline regardless of the size of the decline. A simple decline of $0.01 would be noted as a red volume bar as well. Therefore, sometimes, signals coming from the simple analysis of volume might be misleading, as days without virtually any movement might appear bearish or bullish.
The point here is that we are not overly concerned with the signals given here by volume levels as Thursday's move on higher volume was in fact barely visible (taking the daily closing prices into account.)
Additional confirmation of the abovementioned points regarding timing comes from the analysis of the Gold Miners Bullish Percent Index - a market breadth/momentum indicator that is calculated by dividing two numbers: the amount of gold stocks on the buy signal (according to the point and figure chart, which emphasizes strong moves while ignoring small ones) and the amount of all gold stocks in the sector.
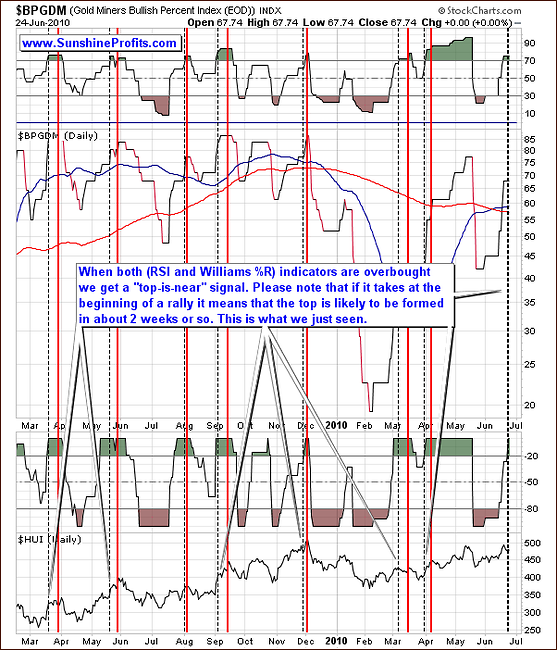
This chart normally gives a good indication of the breadth of a rally/decline and is used as a confirmation of tops and bottoms. This week both indicators (RSI and William's %R) based on this particular index have just turned overbought. Consequently, the above chart suggests that the next local top should occur within two weeks or so, which is mostly in tune with what we've mentioned earlier in this update.
Summary
Little changes of significance were seen in the markets this week (the general stock market being the only exception, as it continued to provide further bearish confirmations.) The frantic developments in Europe directly affecting the euro and the USD have somewhat calmed. Without any extreme headlines reverberating around the globe, the markets were generally quiet as seasonal factors were able to yield some guidance to market direction.
Precious metals are likely to move upwards and the risk-reward ratio of gold continues to be much preferred over that of silver and mining stocks. Gold has been increasingly popular with the mainstream media of late. This will likely cause the PM sector to fail to move much higher or at least prevent any serious rally from developing during the summer months.
Gold is not expected to continue any massive rally from here either. Expectations are that it will not go much above the level of $1,300 or so before declining later in the summer.

