
Gold demand will stay high this year with growing Indian and Chinese appetite for the yellow metal, but fresh buying in developed markets of jewelry will depend on economic outlook, the World Gold Council said yesterday.
In its 2010 Gold Demand Trends report, released on Thursday, the WGC said demand hit a decade high of 3,812.2 tons as jewelry buyers returned to the market after the previous year's near-absence and central banks became net buyers. Early indications this year suggest buying interest in main consumers India and China will stay firm.
Gold is all aglitter for Chinese investors as rising inflation and currency appreciation risks make the metal an attractive alternative, placing the country in a position to challenge India as the world's top gold consumer, according to the report. Chinese gold demand nearly tripled in the last 10 years to around 600 metric tons. Chinese demand for gold bars and coins rose 70% on-year to reach 180 tons, valued at about $7 billion. In less than 10 years, China's gold demand could double.
The World Gold Council said that after reaching a 10-year high in 2010, global gold demand is set to remain strong in 2011 though growth will likely slow from last year's pace.
Investment demand, which surged in 2009 as the global financial crisis gripped markets, leveled out last year. Gold investment eased 2 percent to 1,333.1 tons, while gold buying for physically-backed exchange-traded funds fell 45 percent from the previous year's record level to 338.0 tons.
ETF buying tailed off towards the end of the year, with fourth-quarter demand amounting to only 3.6 tons compared to 38.7 tons in the third quarter and 291 tons in the second.
Central banks turned net buyers of gold in 2010 for the first time in 21 years, as banks in emerging markets added to reserves and sales by the European banks, for many years a key supplier to the market, dried up. The official sector absorbed some 87.2 tons of gold last year, while in the previous year net sales, chiefly from the International Monetary Fund, amounted to 29.8 tons.
Soros and Paulson Still Love Gold
Another report that came out this week is also bullish for gold. The Wall Street Journal couldn’t have put it better in their headline- “Soros and Paulson Go for the Gold.”
In last week’s Premium Update we gave you a head’s up on the release this week by the U.S. Securities and Exchange Commission of the holdings of major hedge funds, and naturally, we were curious to see if the big guns would stick to their gold positions. We suspected they would and it turns out we were right.
Four times a year, investors who manage more than $100 million are required to disclose holdings in certain types of securities, including stocks, within 45 days of the end of a given quarter. These so-called 13F disclosures give us a relatively fresh look inside the portfolios of major money managers.
In fact, some hedge funds increased physical-gold investments during the fourth quarter, with purchases primarily benefiting the exchange-traded fund SPDR Gold Trust (GLD) according to the Exchange Commission filings.
Soros Fund Management and Paulson & Co. both reported higher stakes in the ETF increasing the holdings by 0.5%. Paulson made no change to his holdings of the precious metal. Others, including J.P. Morgan Securities and Franklin Templeton, pared back sharply.
Soros Fund Management slightly increased its holdings of common shares in GLD. Soros, who has said that gold is the "ultimate bubble," boosted his direct ownership stake in the SPDR Gold Trust by 24,800 shares to 4.7 million shares valued at $655 million.
John Paulson, the hedge-fund manager who made his fame and fortune by betting against subprime mortgages in 2007, turned bullish on bank stocks and gold in recent years, and his holdings, current as of Dec. 31, 2010, continued for the most part to reflect those views.
Mr. Paulson kept most of his gold holdings intact, the exception being fewer Kinross Gold Corp., down to 19.5 million, from 33.1 million three months earlier. Other than its largest holding in the SPDR Gold Trust, the next three top holdings of Paulson & Co.’s $29.3 billion hedge fund include AngloGold Ashanti (AU), Citigroup (C) and Bank of America (BAC).
California Here We Come
Soros and Paulson are not the only ones enjoying a gold rush. It seems like the real gold rush is back on. California is where it all started when the discovery of nuggets in 1848 set off the world’s first gold rush.
The New York Times reported that there is such demand in the world for gold that some mining companies are looking at reopening old gold mines in California.
Most of California’s large mines closed after World War II as price controls made mining less profitable. But with controls gone, and gold now selling at more than $1,300 an ounce, the mother lode is beginning to look good again.
The Gold Rush itself peaked in 1852, according to the state’s Department of Conservation, when nearly four million ounces were discovered in California. At the time that the U.S. went off the gold standard in 1971, less than 2,000 ounces were produced in California.
But the rebound in price has led to a rebound in U.S. production. Domestic gold mine production in 2010 increased for the first time in a decade, according to the United States Geological Survey. Nevada is by far the largest gold-producing state, producing roughly four times that of all other states combined.
Before you get a pickaxe, an ore cart and burro and book passage to California, let’s see how gold is performing this week. Let's begin this week's technical part with the analysis of the Euro Index. We will start with the short-term chart (charts courtesy by http://stockcharts.com.)
Euro - USD Indices
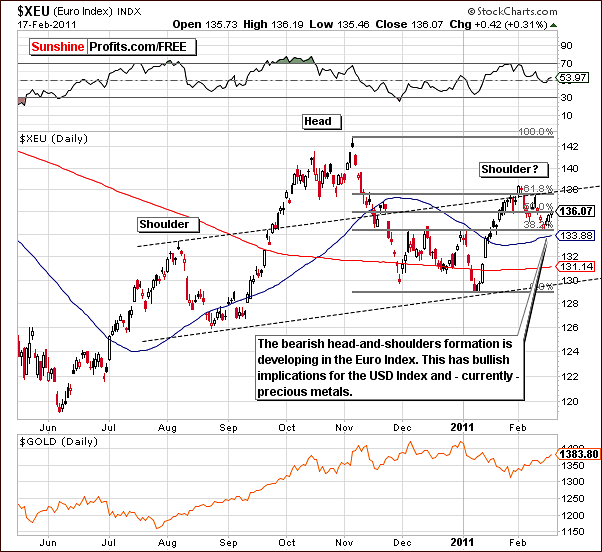
In the short-term Euro Index chart this week, the bearish head and shoulders pattern continues. Nothing has really changed since last week and further development of this pattern gives us a bearish outlook for the euro which is bullish for the USD Index and precious metals overall.
Gold has been moving along with the dollar and has been somewhat “euro weakness driven”. It seems that perhaps many European Investors in the Euro-zone are protecting themselves against the weakness of the euro. This contributes to the bullish outlook for the dollar and also for gold.
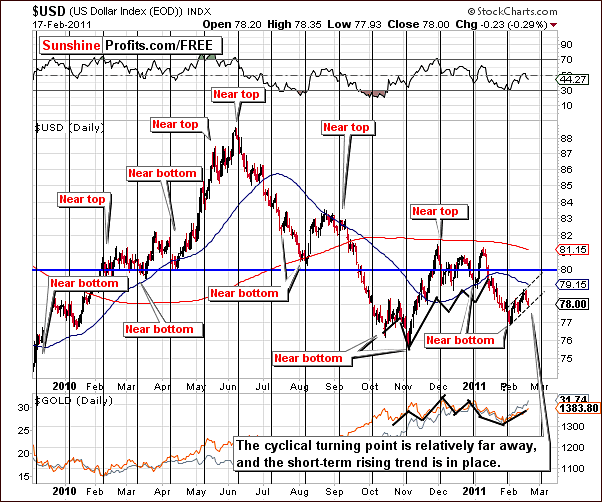
We can see this week in the long-term USD Index chart that the uptrend is continuing here although a bit of sideways movement has been seen within the trend channel. It’s important to note that the short-term trend is up as proven by higher highs and higher lows seen in the past weeks.
Concerning the cyclical turning points, we are just past the midpoint of the two turning points: last local bottom and the next local extreme. No bearish signs have been seen yet which implies we are not likely close to a local top. It will likely be seen in two to three weeks.
Summing up, the currency indices once again provide bullish implications for gold, silver and mining stocks. The outlook is bearish for the euro and bullish for the dollar. The precious metals have been trading in tune with the dollar and the outlook for both is therefore bullish at this time.
General Stock Market
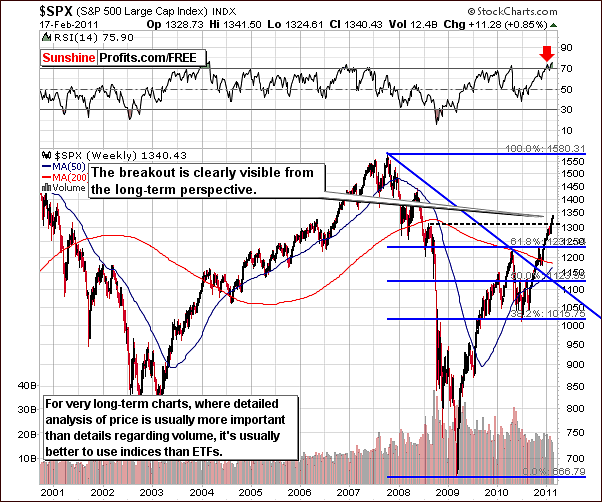
In this week’s S&P 500 Index chart, we see a significant development in that the breakout is clearly visible from a very long-term perspective. In the February 14th Message we stated the following:
The general stock market managed to close the previous week well above 2008 highs (S&P 500 Index above 1313.15). Along with pre-market action on Monday this is what we see as final confirmation of the important breakout in stocks that could push the whole precious metals markets higher…… it seems well justified to move part of your long-term capital back to silver, as high-risk period is over, at least for now.
Hopefully, those of you inclined towards silver took our advantage of the above-mentioned message and, should we say, had a pretty good week. Cha-Ching!
One more point on the long-term chart concerns the RSI level. Note that it is above 70, actually closing on Thursday at 75.90. This is however the only factor that has bearish implications and it is far less useful for the general stock market than for gold, silver and mining stocks. On a number of occasions, it has remained above 70 for some time and stocks continued to rise.
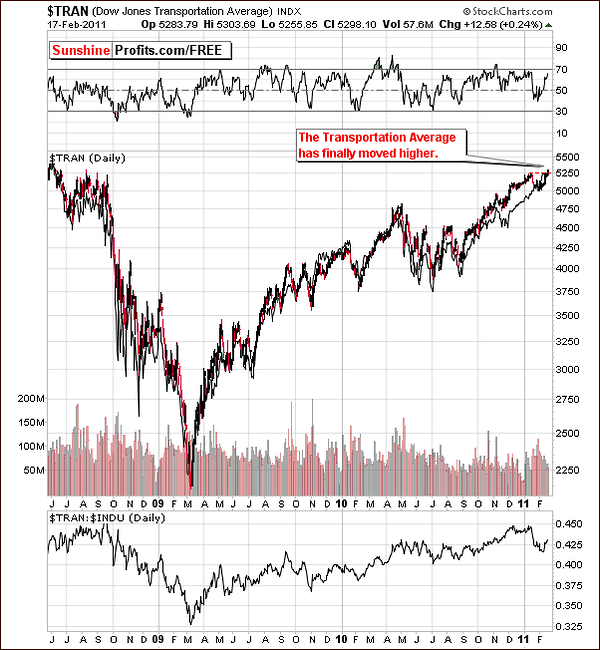
The Dow Jones Transportation Average Index confirms our bullish sentiment for stocks. The index has moved past its January 2011 high, so it seems that instead of dragging other stocks lower, the transportation stocks are simply catching up.
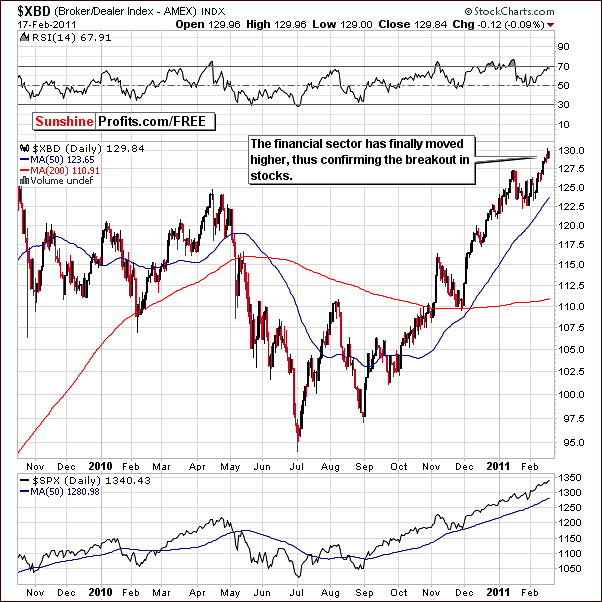
The current Broker Dealer Index value also confirms our bullish sentiment. It has moved quickly higher and usually leads other stocks. The inference here is that higher prices are likely for stocks in general and that the higher risk period for silver is over. Lower prices are not likely from here for the white metal and, as a general rule, when risk is removed, silver thrives.
Summing up, the week saw a rise in stock prices and precious metal prices as well. Silver was the big winner, but the short term also looks bright for gold, mining stocks and stocks in general.
Correlation Matrix
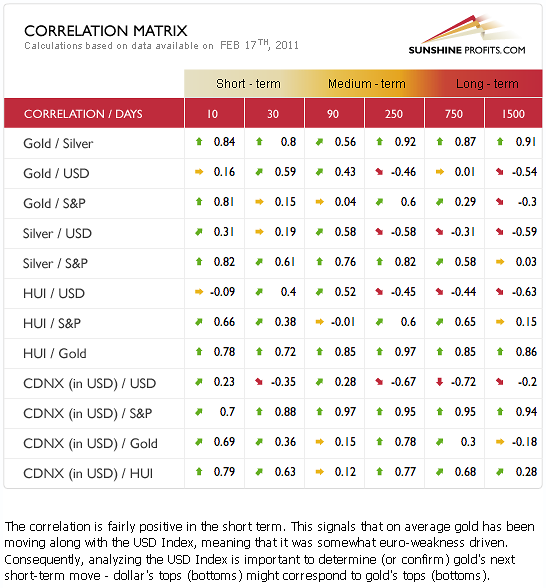
The correlation between gold and the dollar in the short term indicates that the strength of the dollar is primarily driving gold at this time. Note the medium-high 0.59 coefficient in the 30-day column. Similarly, silver is highly correlated with stocks as indicated by the 0.61 coefficient in the same column.
Both metals will likely move higher in price as the dollar and the general stock market continue to rally. Overall, these are bullish signals for precious metals going forward.
Gold
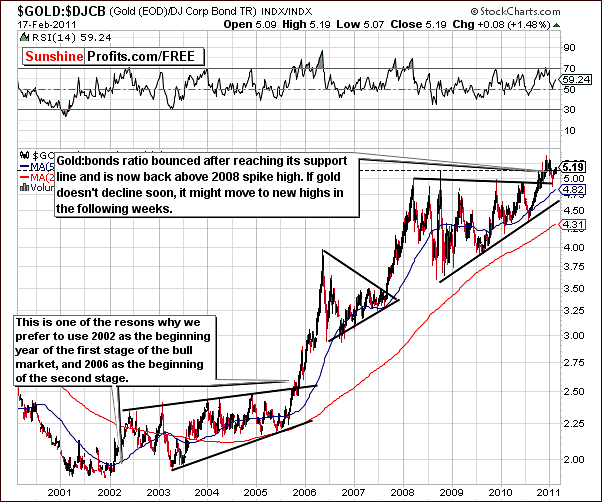
The ratio between the price of gold and corporate bonds once again provides us with some important long-term implications. The index level remains slightly above the 2008 spike high. It seems probable at this time that the medium-term bottom is in and the breakout has been verified. This implies that there is a very good chance for a significant rally to ensue here in the gold to bond index. Higher gold prices are probable in the days and weeks ahead.
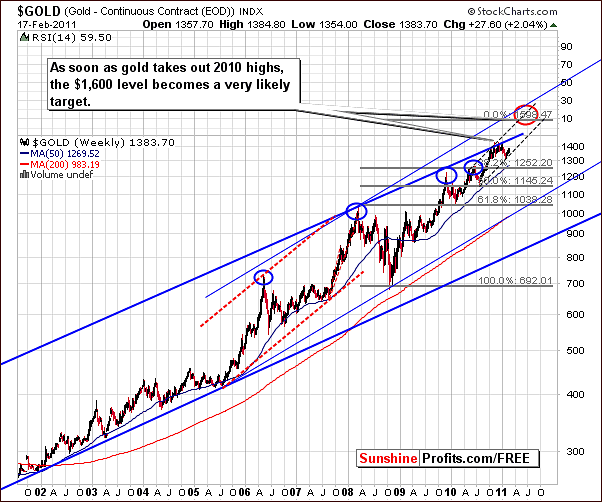
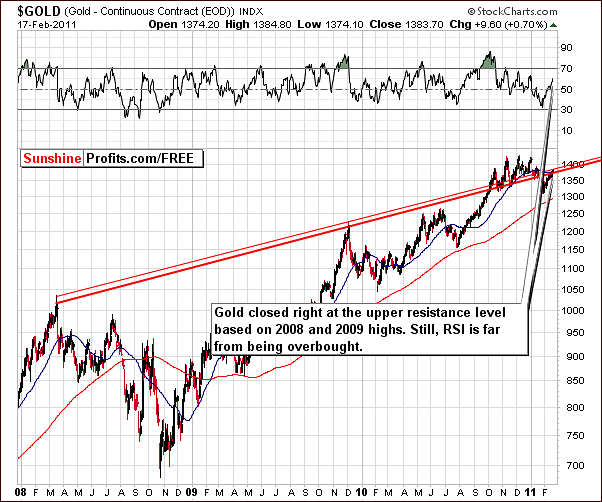
The very long-term chart this week continues to support a target level of $1,600 or even higher during this rally. This is a bit speculative on our part at this time and will move to be more probable once we see the 2010 highs taken out and the move verified. Additional factors will be presented later in the this update and along with the gold to bond ratio will further support the case we have made for the $1,600 level being reached in the months ahead.
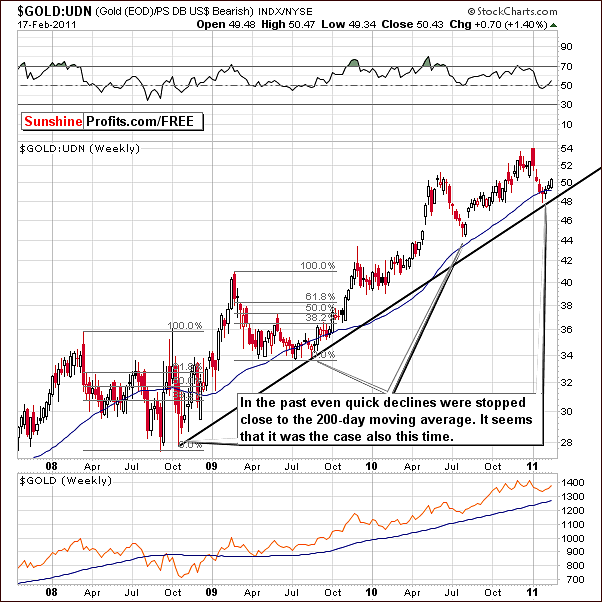
From a non-USD perspective, we see a continuation of the rally this week, though it is quite small when compared to what was seen on the dollar side. Since the USD Index has not shown a significant rally yet, the upswing from a non-USD perspective has been minimal. Once the dollar does rally as we discussed earlier in this update, gold’s price from a non-USD perspective will move much higher and this chart will more closely resemble gold’s USD charts.
Speaking of non-USD charts, let’s take a look at the price of gold from the Japanese perspective.
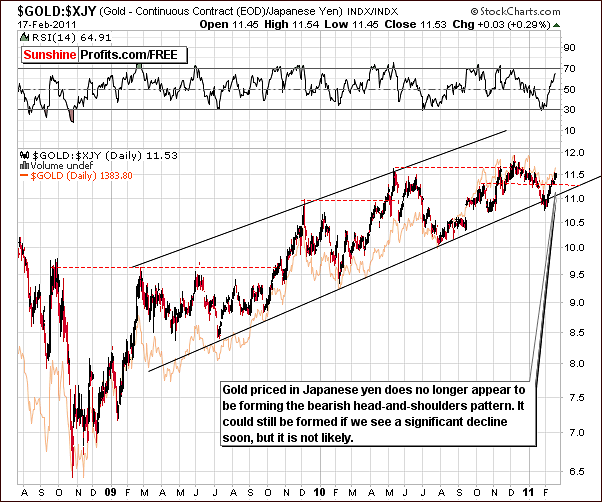
This week’s chart of gold’s performance in terms of the Japanese yen shows us a possible invalidation of what appeared to be a bearish head-and shoulders formation. Because of the upswing seen here this week, it is possible that this pattern is no longer likely to be completed. If however a sharp decline is seen from here, which we believe is unlikely, the pattern could conceivably progress. Our opinion at this time is that a further uptrend is likely.
This week in the GLD ETF long-term chart, we see that the index level has moved to the upper rising resistance line noted in red. This is a slightly bearish signal but is pretty much standing alone with no other signals supporting this outlook. The RSI level is close to 60, nowhere near the local top area which is normally around 70. The close proximity to the resistance line is therefore not currently viewed as a very bearish sign.
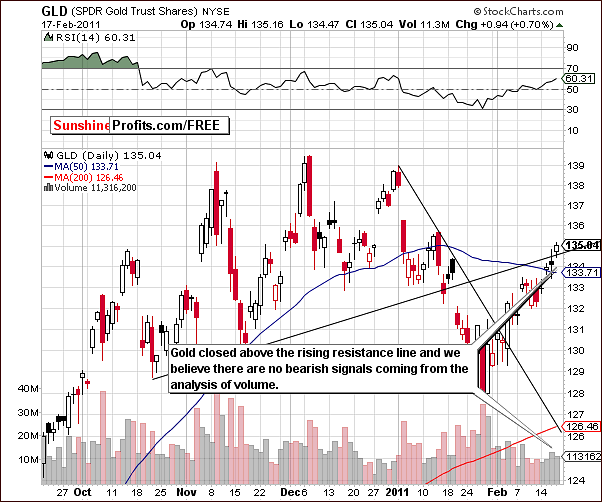
In the short-term GLD ETF chart this week, we do not see any true bearish signals. There has been a move slightly above the rising resistance line which is of course based on the short term. Volume levels have been somewhat average, that is to say, have not been really low. Thursday’s price action should therefore not be taken as bearish.
From here a sizable rally could take place although it may be preceded by a short period of sideways movement. Another possibility is that a slight move below the resistance level could then be followed by several days of consolidation before prices again move higher. Both scenarios are bullish for the short term.
Summing up, the outlook is bullish for the short term and therefore closing speculative long positions does not seem wise at this point in time. Quoting from the message which we sent out on Thursday, It seems that exiting these positions today might still not be the best way to approach the market. Please note that besides mentioning target levels, we also wrote about waiting for a confirmation that the top is in before exiting the speculative long positions. So far, no confirmation has been seen.
Silver
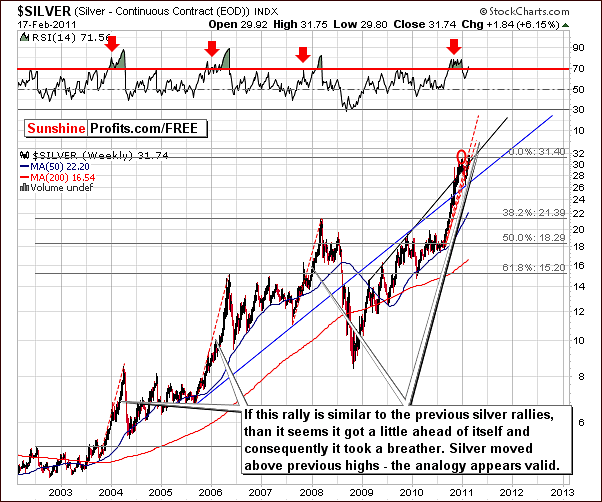
The very long-term chart for silver this week shows that the white metal has moved above previous highs and above previous target level. Thursday’s closing price of $31.74 was more than 6% higher than where it opened the week.
This is very bullish price action but when compared to previous rallies, the implication is that even higher prices are likely to be seen. Analysis of historical trends and this week’s price action indicate that a target level between $33 and $34 (or even higher, we’ll keep you updated as the situation develops) is possible once this breakout is confirmed. There may be a slight pause seen soon as silver may have gotten a bit ahead of itself. A further rally towards the higher target levels will likely follow such a pause.
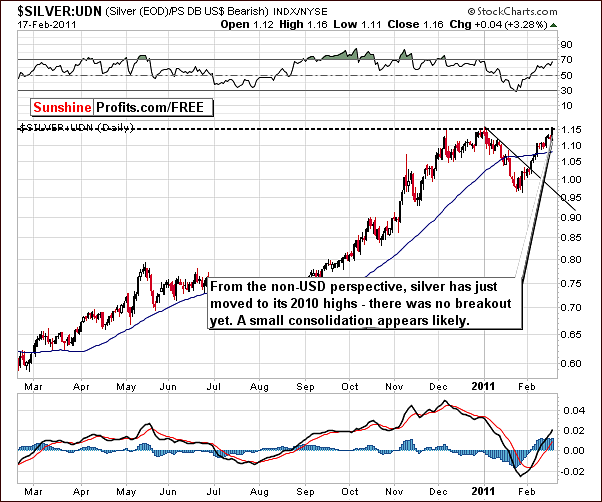
In this week’s non-USD chart, we do not see a confirmation of the recent move to previous index highs. Once again the lack of a significant rally in the USD Index is holding this ratio somewhat in check. It is probable that higher non-USD Index levels will be seen for the white metal once the dollar begins to rally.
If silver’s price moves above previous highs here, it seems that a consolidation would follow. This would be quite bullish if a breather is seen above the level of previous highs but it could also be seen after a slight downward move or a consolidation below the previous highs. In either case it is probable that a rally to new highs will be seen in the weeks following the consolidation at either level.
We will view the breakout from the non-USD perspective as a form of confirmation of the regular-USD perspective breakout. In other words, if silver moves higher in both perspectives and you don’t own any silver at that time, it will be a good moment to complete your purchases.
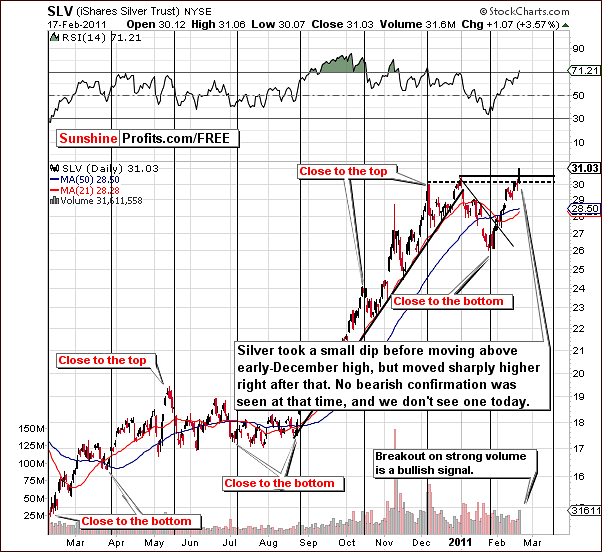
In this week’s short-term SLV ETF chart, we clearly see the recent breakout above the level of the previous high. More than half of this move up took place after mid-week and volume levels have been relatively high. The volume level is a confirmation of the breakout indicating that the breakout will likely be validated.
Higher price levels are probable in the short term although a period of sideways movement may be in the next several days. These possibilities are all bullish in nature and we will notify you if another buying opportunity presents itself prior to the continuation of this rally.
Summing up, silver has rallied this week moving up more than 6%. It seems probable that the rally will continue, possibly to the $33 or $34 level or even higher. The rally may not be resumed for the next several days as a pause or consolidation period is not out of the question. From a non-USD perspective, the rally will gain steam once the USD Index begins to move higher thus providing another confirmation of the breakout.
Silver to Gold Ratio
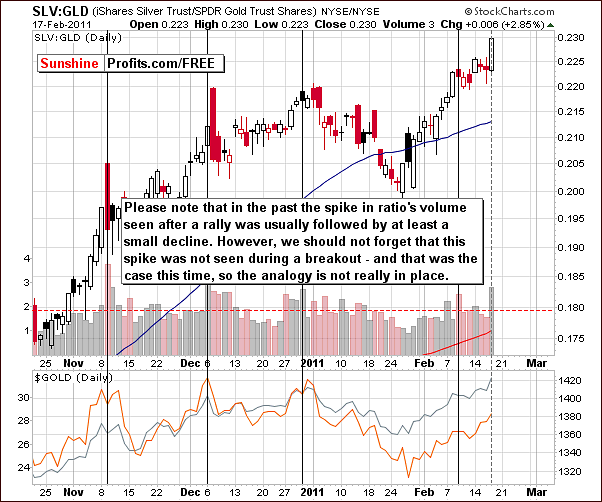
As a follow-up to our previous analysis, we now turn to the Silver to Gold Ratio. We see a spiked high volume in this ratio as SLV ETF’s volume was high compared to that of GLD ETF. This normally means that lower silver prices would be seen soon.
The question in the mind of Investors following our analysis is whether the current rise in silver’s price on high volume is actually a bearish sign. This is due to ratio’s spike high volume.
The answer seems to be no because precisely of the aforementioned breakout. Breakouts are generally a widely watched phenomenon. Many investors participate. Some who bought at previous tops sell without a loss while momentum players move to buy as soon as the price exceeds previous highs. This often results in high volume levels.
The bullish development for silver this past week did not see gold quickly follow but this is not bearish in and of itself. The breakout is the key factor here and in previous silver to gold ratio spikes, breakouts were not an issue. Simply put, this period is not comparable to those seen prior and therefore a bearish sentiment does not appear to be valid.
Mining Stocks
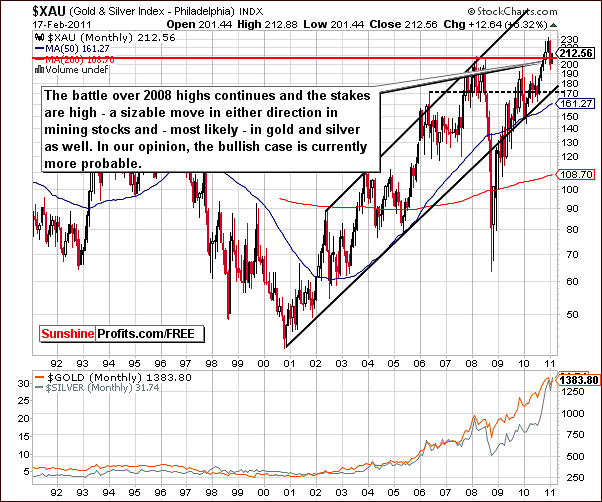
In the very long-term XAU Index chart (proxy for Gold and Silver Mining Stocks), we continue to see a battle for the 2008 highs. Last week we stated that it was unclear as to whether the resistance level would hold the rally.
Based on silver’s price action this week, as well as the performance of mining stocks (closed above 2008 highs), it appears that a bullish move here is slightly more likely.
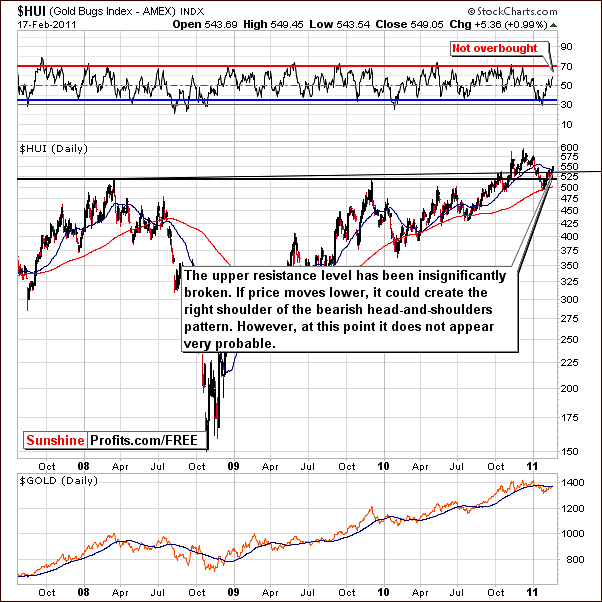
We see a recent upward move in this week’s HUI Index chart and this appears to invalidate the head and shoulders pattern formation. The index level has moved above the upper resistance line and a subsequent move down to continue the bearish pattern is rather unlikely at this time.
The resistance level which has just been passed is important and the RSI level is not overbought. Therefore, it does not seem that a significant local top has been reached nor is one close at hand.
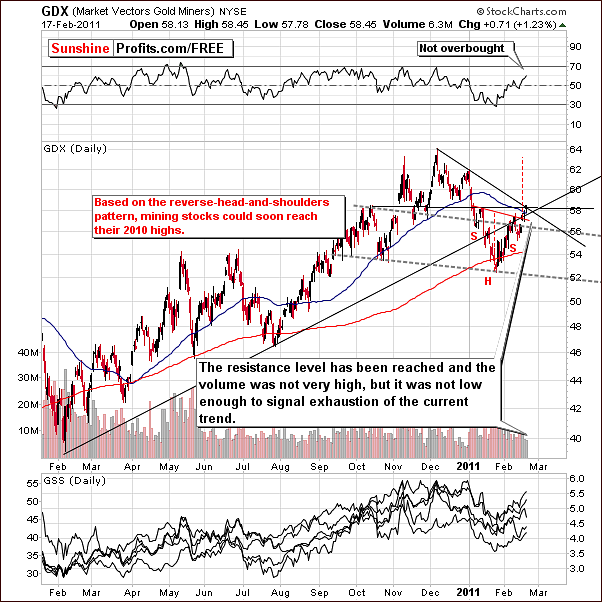
In the short-term GDX ETF chart, a proxy for the mining stocks, we see that volume levels declined insignificantly on Thursday compared to prior days. The levels do not appear low enough to suggest that buying power is drying up and the rally is over.
Several days of consolidation or sideways movement may be seen now or even beginning a few days from now at slightly higher levels. We do not see any confirmation at this time as to which is more likely. At this time, exiting long positions does not appear to be justified, because the short-term uptrend remains in place.
The RSI level is not overbought and it seems that a reverse head and shoulders pattern is in fact emerging (as one of our Subscribers correctly noticed – thank you, Vito). Actually, we find it somewhat ironic that the right part of what was supposed to be a bearish head-and-shoulders formation is by itself a bullish reverse head-and-shoulders pattern.
Either way, a rally to the level of previous highs is likely after confirmation of the breakout above the neck level (marked with thin red line on the above chart) and would appear to equal the amount seen in the head of the pattern which is about $4 in this ETF. The new short-term target area in the $62 to $64 range is based on this theory.
Summing up, the very long-term situation appears a bit clearer now and the implications are now slightly bullish. The medium-term bearish head and shoulders pattern is almost invalidated and analysis of price action and volume levels for the short term is not yielding bearish signs at this point.
True Seasonal Pattern for Gold
In the last Premium Update we have argued that, based on the findings of our new tool – True Seasonals, a rise in the price of gold was possible in mid-February. As a matter of fact, these findings turned out to be accurate in the past few days. After the publication of the aforementioned Premium Update, one of our Subscribers, who was particularly interested in True Seasonals (note that this is not the same pattern as you see on other websites – in fact we don’t know of any other source that provides seasonal patterns while taking into account expiration of options/futures – that’s why we call them True Seasonals), made a request to include the seasonal chart for March in the next Premium Update.
Today, we are pleased to make a positive response to that request. The chart below presents the seasonal pattern corrected for the expiration of derivatives for March. As the price of gold for March 1st, 2011 is yet to be known, we have assumed that this price is equal to the last known price of gold ($1379 – February 17th, 2011).
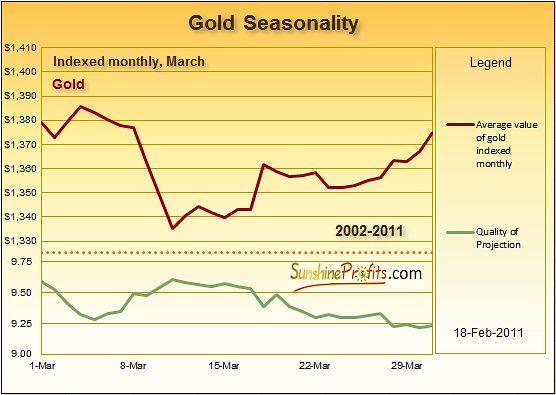
The chart above presents the supposed changes in the price of gold for March (the upper trend line) and the quality of that prediction (the trend line in the lower part of the chart). Basic guidelines for the interpretation of the seasonal chart were outlined in our last Premium Update in the section Seasonal Pattern for Gold. To sum up the most important facts: the whole chart presents the seasonal pattern of the prices of gold adjusted for the influence of derivatives; Quality of Projection typically ranges from 10 to 0, where 10 is an indication of a particularly precise prediction (and therefore suggests that you should include True Seasonals in your analysis) and 0 suggests that the use of True Seasonals is not obligatory.
The use of True Seasonals is particularly important when there are no other market signals about the possible direction gold might go. When there are no clear signals, one should resort to the seasonal pattern. In other words, the analysis of the current market situation and the use of True Seasonals are complementary – when the current market situation is inconclusive, True Seasonals may offer you the clarification you need. Having said that, let us move to the proper analysis.
The seasonal pattern clearly indicates that a considerable slump is possible in the first two weeks of March. On average, gold used to decline by more than 3% from March 1st until March 11th. What is particularly interesting, Quality of Projection reaches its top level in March precisely in the time of the sharpest decline. This suggests that this decline is even more likely, and that the price of gold is likely to be about $40 lower in the middle of the month than it was at its beginning.
The chart also implies that the recovery of gold in the second part of the month might be relatively slow (compared to the possible decline) and bumpy (please, notice the slight decline after March 18th). Another implication is that gold might not be able to reach the price level from the beginning of March by the end of the month.
All of this suggests that you should remain extremely cautious at the beginning of March as a sharp decline is possible. Please note that this outcome would be in tune with the cyclical tendencies present on the USD Index and the fact that the dollar and precious metals have been moving mostly together in the recent months.
On a side note, we strongly believe that providing True Seasonals for April and following months in the above form will not be necessary, as by the time they are needed, the interactive version will be available.
Summary
The USD Index is likely to move higher as the bullish sentiment prevails here. In the Euro Index, a continued downtrend is likely and the outlook is bearish. The general stock market moved higher this week and confirmed a breakout above the highs of August 2008. The situation in the USD Index and the general stock market is positive for the precious metals as a whole.
Those of you who acted on Monday’s message and switched back into silver are surely happy today as the white metal rose a whopping 6% this week. As always we will continue to strive for timeliness and accuracy in our messages to you as situations unfolds on a daily basis.
Gold has recently touched its rising resistance level but no confirmation of a local top has been seen. The current short-term trend therefore has not been invalidated and the outlook remains bullish. Silver has broken out above previous highs on strong volume and this too is a bullish development. Price action for mining stocks has been similar to gold and silver, and the implications are alike as well.
Consequently, we feel that current long speculative positions in gold, silver and mining stocks should be held. No change in long-term capital appears necessary at this point.
Several days of sideways price action may be seen due to resistance levels and in silver’s case, a recent breakout. These should not be viewed as bearish for it is more likely to result in a stronger foundation for the rally to come. As always, we will keep you updated, should anything change.
Our next Premium Update is scheduled for Friday, February 25, 2011.
This completes this week's Premium Update.
Thank you for using the Premium Service. Have a great weekend and profitable week!
Sincerely,
Przemyslaw Radomski

