
Is America going to hell? It certainly seems that way if you read about the "post- American" world and listen to the television news programs that eulogize America's position as the premier superpower. That is the reason why it was refreshing to read a reassuring article in latest issue of Atlantic Magazine.
The writer, James Fallows, claims that if you look at the comforts and abundance of American life, even at a time of recession, you realize that America is still one of the best places in which to live. Even if America is supposedly in a decline, it still has a standard of living that is the envy of most of the world. The simplest measure of whether a culture is dominant is wars, failing schools, failing industries, etc. In fact, America has a tradition of gloom and doom that goes all the way back to the first European colonists. Pick any decade in Amerwhether outsiders want to be part of it, he says. There are still plenty of people around the world for whom an American green card would be a dream come true. You don't see many people clamoring to immigrate to China.
Fallows points out that there have always been periods during which it seemed that America was falling behind or falling apart --presidential resignations, assassinations, race riots, divisive ican history and you will notice the same cycle of despair and renewal that seems to be built into the American psyche. There have been other periods when it seemed that America was falling behind, as, for example, with Sputnik when Nikita Khrushchev said "Whether you like it or not, history is on our side and we will bury you." Later, there were the Japanese, the Germans and now China that serve as standards whose achievements dramatize American decline.
Barack Obama, while he was still campaigning, put this feeling into words.
"The dream that so many generations fought for feels as if it's slowly slipping away, and most of all, we've lost faith that our leaders can or will do anything about it," he said during a campaign speech.
There are many reasons to believe in America's resilience, says a historian that Fallows interviewed. There is the good luck of geography and resources, the First Amendment's success in reducing religious friction, and the decentralization of power and culture. Racial relations, a major problem in American history, have never been better.
Fallows points out that China has about four times as many people as does America and that someday its economy will be larger. That is good for everyone because a business-minded China is likely to be more benign. Besides, China has plenty of reasons to worry about its own future. There is the issue of a looming environmental disaster due to the overly rapid development. Then there is the demographic legacy of the one-child policy, which will leave an aging population dependent on relatively fewer young workers. Politically, tensions between an open economy and a closed political system with constraints on free expression might cause instability.
America, he says, is likely to lead in the development of future industries and technologies that depend on a society that is flexible, open and inventive.
American society is perfectly positioned for such innovation. The American advantage depends on two pillars of American strength-continued openness to immigration and a continued concentration of excellent universities that people around the world wish to attend. Although there are troops of engineers and computer scientists marching out of Chinese universities, China lags behind in scientific discovery and technological innovation. Of the top 20 universities in the world ranked according to scientific research papers, 17 are American. Of the top 100 in the world, none are Chinese.
"What I've seen as I've looked at the rest of the world has generally made me more confident of America's future, rather than the reverse," writes Fallows. "What is obvious from outside the country is how exceptional it is in its powers of renewal: America is always in decline, and is always about to bounce back."
Fallows doesn't ignore the problems facing America, which he sees mainly as a failing of the political system. He ends the article on a positive note.
"America has been strong because, despite its flawed system, people built towards the future in the 1840s, and the 1930s, and the 1950s. During just the time when Frederick Law Olmsted designed Central Park, when Theodore Roosevelt set aside land for the national Parks, when Dwight Eisenhower created the Pentagon research agency that ultimately gave rise to the Internet, the American system seemed broken too. They worked within its flaws and limits, which made all the difference. That is the bravest and best choice for us now."
The positive note is encouraging especially in the face of the very bearish situation on the general stock market, which once again appears to be highly correlated with gold, silver, and mining stocks. Let's take a look on the gold chart (charts courtesy of http://stockcharts.com) for more details.
Gold
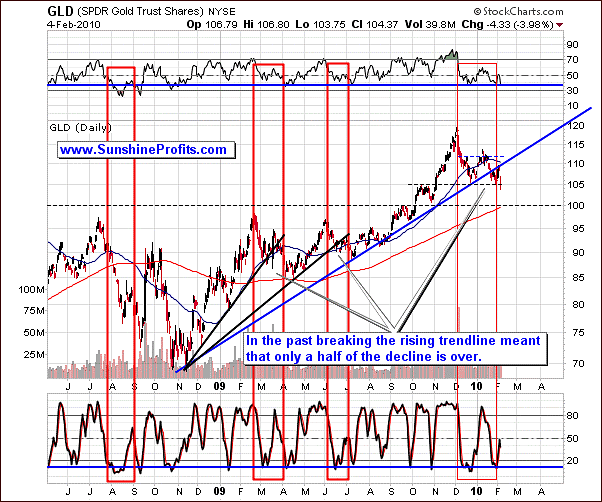
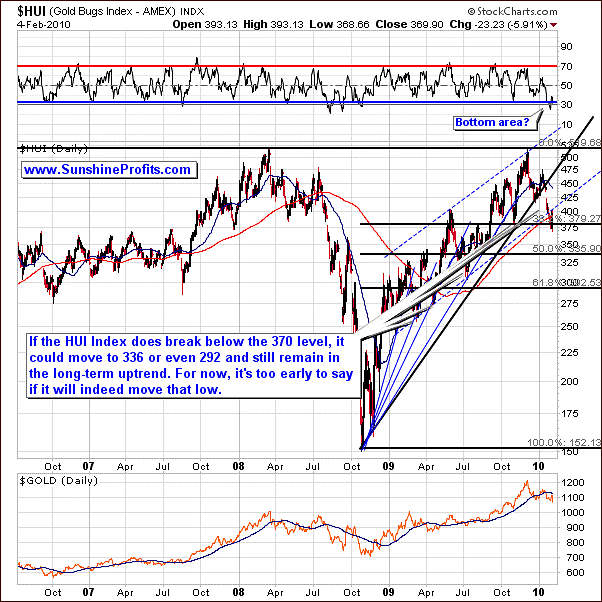
At the first glance, the situation didn't change much from the long-term point of view, but the second look reveals that gold is trying to break below the recent support level ($105). Moreover, gold has recently moved to the rising ex-support line (market with blue color) and verified it as resistance, which suggested that a move lower is to be expected from that point.
The RSI and Stochastic indicators are currently oversold, which by itself is a bullish sign, but these indicators are rather short-term oriented, and the current downswing in the general stock market is likely to be more than just a one-week phenomenon. This means that until the precious metals market disconnects from the main stock indices the situation is not likely to appear bullish.
Another thing that supports the short-term bearish case for PMs at the moment is the fact that several of our colleagues (who are usually much too early in giving the buy/sell signals) have recently issued buy recommendations. In the past, it mostly meant that there are at least a few more days of declines, and this is what we've seen yesterday. Of course, we respect the work of our colleagues, but we also strive to provide you with best analysis possible, so we need to take many factors into account. Generally, PMs appeared to be ready to bottom out about a week ago, but since situation on the general stock market once again seemed to be closely correlated with PMs, caution was necessary.
Let's take a look at the short-term chart for more timing details.
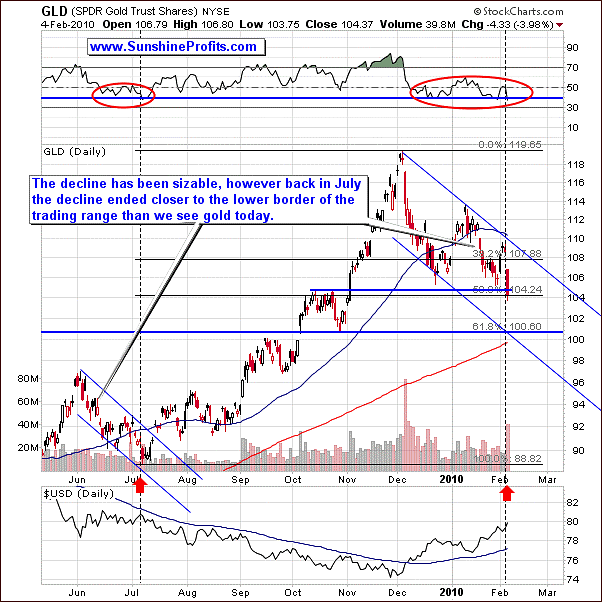
The short-term chart provides us with additional information as it allows us to compare the current decline with the previous one. Naturally, the current decline is bigger than the previous one (about 2x bigger), but it is very similar given the 2:1 scale. The vertical dashed lines along with the areas marked with red ellipses help to understand where are we now with regard to the June - July decline.
The current downswing seems to be a part of the final downswing, which takes gold lower quickly. Still, the size of this decline is not easy to determine based on the historical perspective, because of its rapidness.
In order to get more detailed view, we've drawn trend channels for both declines. The results suggest that gold is likely to move at least a little lower before bottoming. The July bottom took place very close to the lower border of the trend channel and gold is currently more or less in the middle of the trend channel. Moreover, the lower border of the trend channel corresponds to the $100 level in the GLD ETF (previous high; important from the psychological point of view), and it is very close to the 200-day moving average. Therefore, gold may need to move lower before the bottom is formed.
Again, this is only one technique, and we would need to see confirmation from different ones before stating that the bottom is in. One of them is checking if silver and PM stocks confirm the above mentioned points.
Silver
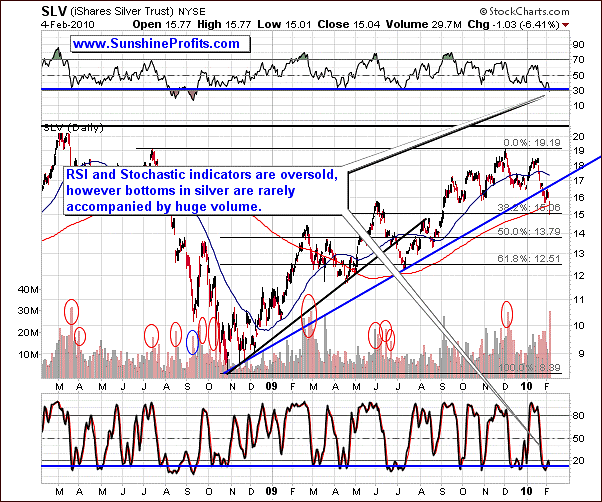
The long-term chart of silver provides particularly interesting details. Silver has just moved below the long-term support level, and verified it as resistance (just like gold did) and is already below its 200-day moving average. The question is if the recently reached $15 level (38.2% Fibonacci retracement level) marked the bottom, which was accompanied by a high volume.
Still, our best guess is that it was not the bottom, precisely because of the high volume. While it is often the case in many markets that the bottom is formed on high volume along with some kind of reversal candlestick pattern (for instance "hammer" or "dragonfly doji" candlesticks), it is not the case on the silver market. We've examined situations when silver declined on volume that was very high on a relative basis, and it marked the bottom only in 1 out of 12 cases. Therefore, high volume along with lower prices generally suggests that silver is likely to go lower in the short-term.
The RSI and Stochastic indicators suggest that the price of silver is likely to reverse soon, but these indicators are based on price alone - they don't take the volume factor into account.
The short-term silver chart lets us check the cyclical tendencies on this particular market.
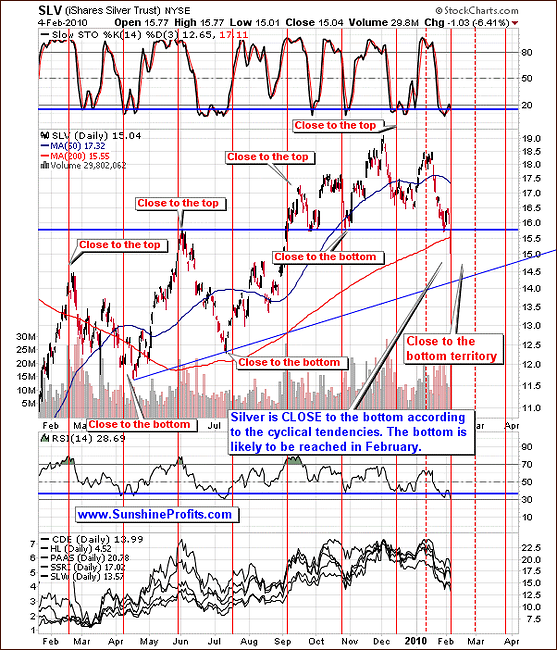
Silver is currently right in the middle of the bottoming area, but please note that although there were times when bottoms/tops formed exactly as these tendencies suggested, it is not the main way of using this tool. It is designed to let one know more or less when the bottom / top is likely to form and what signals to look for during a given time-frame. For instance, during the bullish cycle, one can expect big moves to the upside and corrective small downswings. Naturally, the opposite is true during the bearish cycles - for instance right now. Either way, what we need to look for signs of the coming bottom and we currently expect them to materialize before the end of the month.
Based on the current charts it seems that unless silver manages to quickly move above the recently broken blue horizontal support line, it may need to move slightly below $14.5 before the bottom is reached.
Precious Metals Stocks
The precious metals stocks are trading mostly in tune with gold and the general stock market lately (and inversely to the USD Index) and consequently the situation here is very similar to what we've described above.
The move lower has been very rapid and the RSI Indicator flashed a buy signal recently, but once again, high correlation between PMs and the general stock market is a major factor here, and the latter does not seem to have bottomed at this point yet.
The RSI indicator was just below the 30 level, but that was also the case in August 2008, which marked just a beginning of a major move down. Let's take a look on the short-term chart for more details
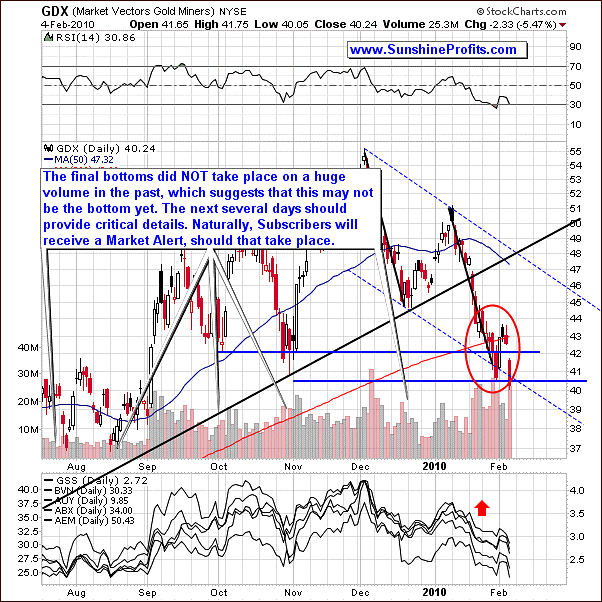
The value of the GDX ETF (proxy for precious metals stocks) has reached the downside target for this rally, but two of the above mentioned factors are in place also for this market - volume (as mentioned while analyzing the silver market) and the high correlation with the general stock market. Consequently, GDX may still move lower, unless we see signs of disconnection between PMs and the general stock market.
Much of what we've written so far in this update revolves around correlations; so let's take a look at the latest version of our correlation matrix.
Correlations
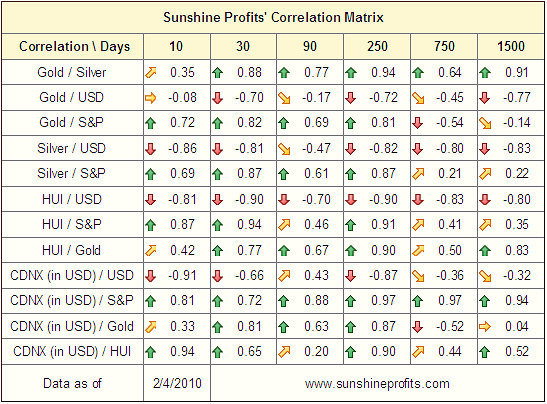
We believe that understanding the current situation as far as correlations are concerned is crucial especially given the current market juncture. The comments that we've made last week regarding the correlation matrix are still relevant today, so we will paste them also into this issue, and make appropriate changes where necessary.
Based on the most recent data, the values of the correlation coefficients have increased for S&P / gold, silver and the HUI Index and currently they are even higher for the S&P and PMs than for USD and PMs. This means that the odds of a simultaneous decline in PMs and the general stock market are relatively high. The value of correlation coefficient between gold and S&P has been high in the 30-day period (0.82), so it suggests that Gold Investors should keep an eye not only of the chart of their favorite metal, but also on the chart of main stock indices.
Consequently, we have to wait for additional signals of confirmation for either of the two scenarios (general stock market plunges along with PMs or without them). So far both markets have been declining together.
The first thing to monitor is the way PMs react to changes in the value of the main stock indices - especially gold, because silver and PM stocks are historically more correlated with the general stock market (silver's industrial uses etc.), so high correlation here is not much of a divergence. If PMs trade very much in tune with the general stock market during both upswings and downswings and we don't have identical moves in the USD Index (as we will see in the main stock indices - but in the opposite direction), then PMs may be in trouble.
If, on the other hand, PMs stop declining or even rise modestly along with falling main stock indices, it will mean that even more declines should not cause serious damage to the PM market.
Additionally, if we see the USD Index move higher and PMs refuse to move lower, it will give us a "probably the bottom is in" signal.
The above mentioned phenomena should be visible for at least several days before we can make decisive calls.
Unfortunately, if the USD Index and the main stock indices trade in tune (but in the opposite directions) - meaning that they will be highly correlated, then the above mentioned technique won't work. Should this be the case, and suddenly this correlation (between USD and the general stock market) disappears, then the market which PMs will follow in the next several days following this "disconnection" is likely to be the market leading the metals in the coming weeks.
The phenomenon mentioned in the last paragraph is what we've seen very recently. USD Index and the general stock market move in tune, so it is impossible to tell which of them actually drives PMs. We will have more information once we see some kind of divergence, for instance if the U.S. Dollar tops and the general stock market continues to slide. Speaking of the former, let's take a look at the chart of the USD Index.
USD Index
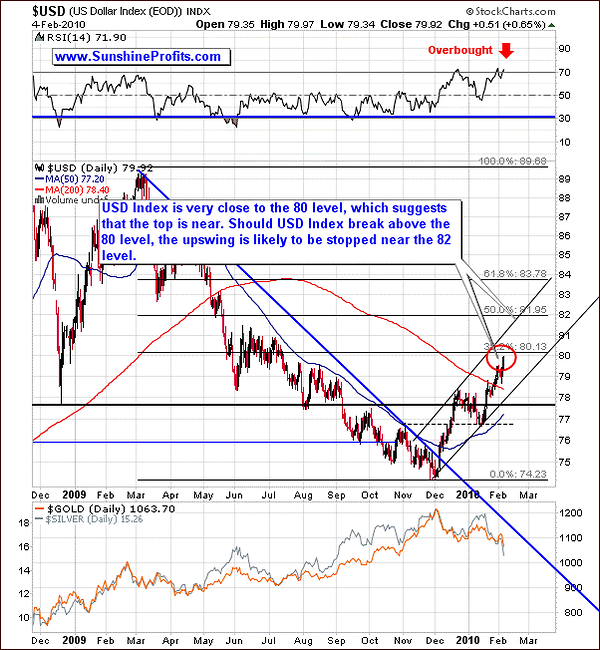
The value of the USD Index moved sharply higher in the past few days, and it is now (not visible on the chart above) trading slightly above the 80 level. This means that the initial target for this rally has been reached.
Naturally, the big question is if the top is in. If it wasn't for the bearish situation on the general stock market, we would state that the USD Index is likely to have formed a top, PMs bottomed, and one can safely open a long position in PMs. However, since the main stock indices are likely to move lower from here, the only thing that the current situation in the USD Index is telling us is that we may have a chance to spot a divergence mentioned several paragraphs above.
If the USD Index tops here and main stock indices continue to slide we will have an opportunity to check which market PMs are likely to follow next. If they move lower, because stocks slide, then they are likely to slide further. If PMs rise along with declining dollar despite plunging stock indices, we will have a buying opportunity.
Short-term chart provides us with more details.
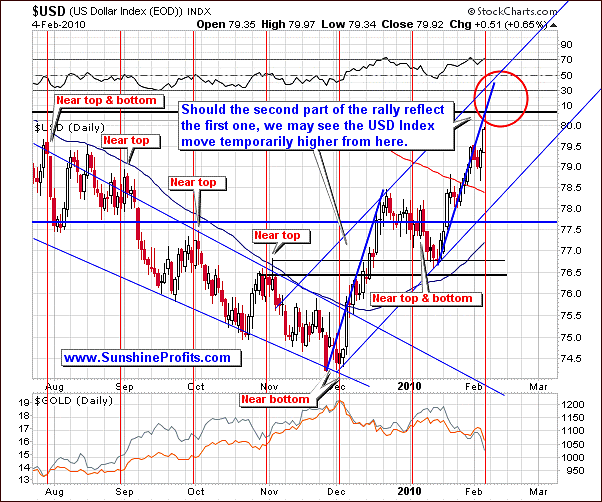
The USD Index has just touched the black horizontal resistance level, but taking the symmetry between two parts of the upswing into account, we may infer that the dollar might rise for a day or two. It is currently right at the "near top" point that we've marked with red vertical line. This - along with previous comments - suggests that we may be only several days away from the point where USD Index disconnects from the general stock market.
Speaking of the general stock market, please take a look at the chart below.
General Stock Market
The situation on the general stock market and its connection (or lack thereof) with other markets is currently one of the most important things to consider while making investment decisions in virtually any market, including the precious metals market.
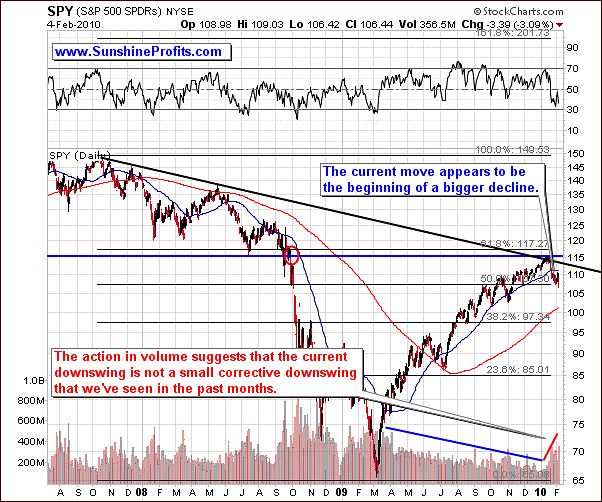
The current move appears to be the beginning of a bigger decline, especially if one takes the volume into account. Please note that the current action in volume is clearly different to what we've seen during previous declines that were in fact just small corrections within the bigger move up. Naturally, the general stock market may move higher from here, but based on the action in volume, we find it unlikely.
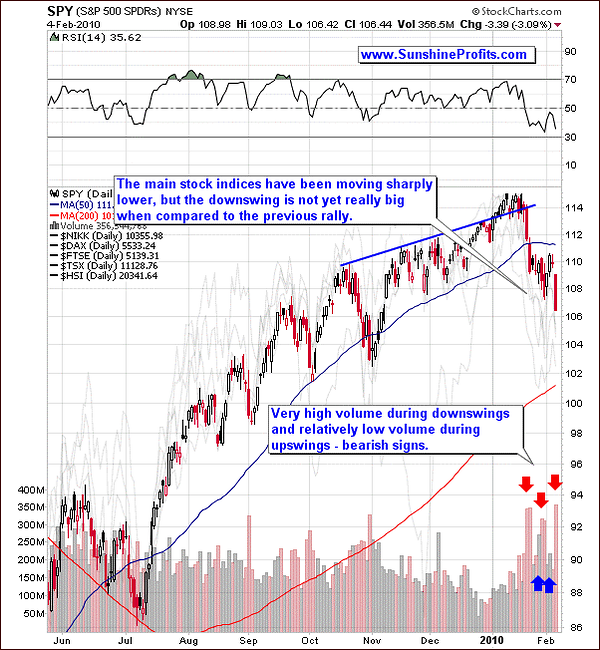
The short-term picture confirms the bearish outlook. The volume is not only much higher since mid-January when the decline began, but it is also particularly high during daily moves lower. The question is how low can the general stock market go during this decline, but it is too early to say. Based on what we've seen so far, it seems that the decline is not even 50% over yet. We will keep you updated, should anything change.
Juniors
As stated in the Key Principles section, the list of top juniors will be updated approximately every 4 weeks, so this is the Update that should contain the revised version of the list.
The tables below feature our favorite junior stocks at the moment of writing these words. For more information on how you can use these lists please refer to the Key Principles section, especially to the part dedicated to juniors.
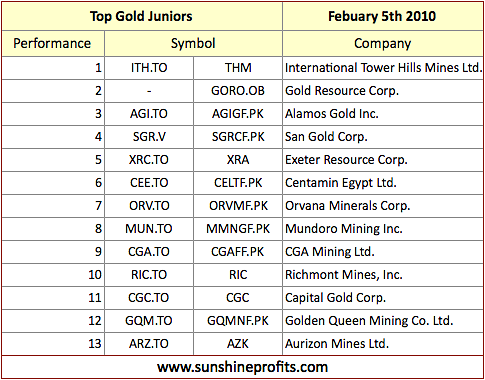
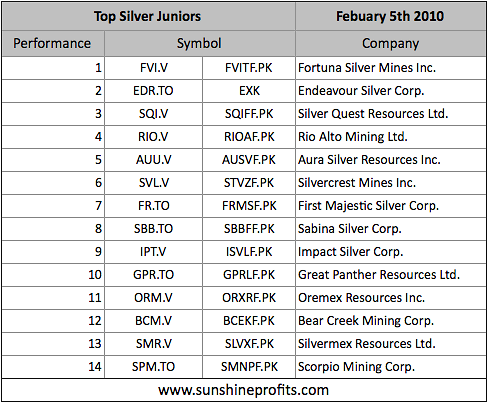
There are no big changes since the previous month. Aquiline Resources (AQI.TO) has been removed from our silver juniors ranking because it has been acquired by PAAS.
Please note that the comments that we've made regarding the junior sector in the January 15th Premium Update are still up-to-date. Since we may still be in the early part of the decline on the general stock market, and the number of our Subscribers is increasing very quickly, we would like to take this opportunity to remind you of our current views on the sector. By the way, if you didn't read the November issues we highly recommend that you do, as they include our very-long-term price projections for this bull market.
There is one more thing that I'd like to comment on this week, and that is the situation in the junior sector. While this is nothing new to you, if you've been following our commentaries for over a year, it seems that it may prove useful to remind this part of our analysis to new Readers. In the essay posted on September 19th, 2008, we wrote the following:
(...) junior/senior ratio is reasonably correlated with the general stock market. This is another thing that justifies the severity of this decline. As the stock market fell, the junior/senior ratio plunged as well. The marked rectangles on the chart are periods where juniors rallied relative to the HUI Index - it was accompanied by a rise in the general stock market. The question is what will happen next on the main stock indices.
The juniors have been rallying recently, but so did the general stock market, which is another confirmation of the points raised over a year ago. Since the general stock market is likely to move lower sooner or later, it may mean that the juniors' outperformance will also disappear for some time.
Please note that the correlation matrix also includes details of influence USD and main stock indices have on juniors (CDNX - the Toronto Stock Exchange Venture index is used as a proxy), and numbers imply that the general stock market has a very strong influence on the junior sector.
Consequently, if you are heavily invested in juniors, you may want to consider switching at least a part of your holdings into big, senior PM stocks, bullion, even cash (depending on your investment preferences). If you are risk averse, switching from juniors into physical gold/silver, seems to be a good idea. For more information about structuring your portfolio, please go through the Key Principles section.
Please note that juniors' outperformance ended just a few days after the update had been posted.
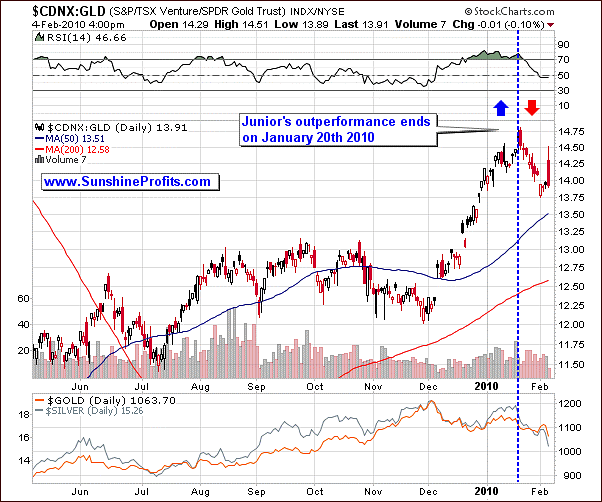
The situation on the general stock market appears to have influenced juniors' outperformance as indicated earlier. Since we don't see sings of strength in the general stock market at this moment, and we are not in the final stage of a rally, we don't think that juniors are the best place for one's capital at this moment.
Summary
The situation on the precious metals market is currently particularly interesting. The USD Index seems to be very close to a top, and the prices of gold, silver and PM stocks have been moving sharply lower in the past several weeks, which should normally create a favorable buying opportunity.
Still, the general stock market is once again highly correlated with PMs (and with the USD Index), which means that one shouldn't ignore the strongly bearish signals that it generates. Yes, that is "only" one factor, but the risk of a severe breakdown in the main stock indices that would take other markets with it (as it was the case in the past) is currently too big, not to monitor this market carefully. In other words, until the precious metals market disconnects from the main stock indices the situation is not likely to appear bullish. It seems that we will soon have more details and we'll report to you accordingly. As always, if no alert is sent, it means that the points made in this report are still up-to-date.
This completes this week's Premium Update.
Thank you for using the Premium Service. Have a great and profitable week!
Sincerely,
Przemyslaw Radomski

