
This past week we saw gold have its biggest two-day drop since February of last year ending the third longest streak of trading above its 50-day that the yellow metal has had since 2000. The first streak ended in 2002 with 124 trading days and the second in 2008 with 143 trading days. No bull market goes up in a straight line.
What was the trigger?
Could it have been investors rebalancing their portfolios for the New Year? Worries that an economic recovery will curb demand for the metal as a haven? Reports that U.S. companies added almost three times more jobs in December than analysts forecast? Was it the dollar rising for three days against a basket of major currencies?
We are likely to see much volatility in 2011 as investors swing from fear to greed and back again. There is a relatively new phenomenon mostly discussed on trading floors and by professional managers. It’s called “Risk On – Risk Off.”
It goes something like this. Investors either believe the future is good and risk appetite is ON; or else they believe the future is doom and gloom and risk is OFF. What is different since the Subprime fiasco of 2008 is that there doesn’t seem to be much of a middle ground. Exuberant optimism and gloomy pessimism oscillate nervously within the markets and the prices of a variety of assets move up and down with them.
On this see-saw, when risk is on, equities and commodities rise and credit spreads narrow and the Japanese yen falls. When risk is off, they switch. Correlations between various asset classes that historically hardly moved together are now highly polarized, either strongly positive or strongly negative. If in normal market conditions the price of any given asset is driven by a variety of forces and factors, in today’s markets many assets are being driven by the Risk On – Risk Off phenomenon.
As far as Risk Off side of the equation, there are plenty of worries to keep even a normally sound-sleeping investor awake at night. We have covered them in previous Premium Updates - quantitative easing, sovereign debt, currency wars, euro zone problems, a housing market where one-in-seven mortgages is delinquent or in foreclosure, inflation, deflation, hyperinflation, etc.
Speaking of hyperinflation, if you want to read something that might keep you awake at night read an article by long-time trader and author Victor Sperandeo in the latest issue of Barron's. Sperandeo has traded for many top investors, including George Soros.
He writes that investors in U.S. debt around the world are growing closer to a "psychological breaking point" that could force a "run on the bank" against Treasuries.
If that happens, hyperinflation will quickly follow and gold will soar much, much higher. We have already seen signals from China that it intends to cut its holdings of US treasuries. Anyone who believes that the United States faces a comparatively mild 1970s-style inflation risk is ignoring history at his own peril, says Sperandeo. He writes:
Hyperinflation has a single cause: It occurs when a government cannot borrow money because its debt has risen so much that investors believe they will never be paid back with close to the same purchasing power. As a consequence of this flight of confidence, such a government is forced to print money to meet its obligations. This further undermines the value of its currency, often culminating in a frenzied collapse. That is hyperinflation, and only governments and central banks cause it.
U.S. government debt is now over $13.7 trillion (not including estimated states’ debt of $2.8 trillion and agencies’ debt of $3.0 trillion). The average rollover period for the debt is 49 months. With recent deficits running over $1 trillion a year, the Treasury issues new debt and refunds old debt at a rate of about $4.3 trillion a year. A nation needs to inspire a lot of confidence to keep that Ponzi scheme alive. Unfortunately, markets know that even the U.S. government will print money to meet expenses when necessary.
Investors know that the tiny gap between what they are paid to hold Treasury debt versus the inflation rate can quickly turn into a loss. If the gap narrows by too much, there is no longer any compelling incentive to hold the debt. Investors will rush for the doors not wanting to be left holding the bag.
"This leads to the question, being asked from Beijing to Brussels: Does the risk match the reward?” asks Sperandeo. “A negative response to that question could lead to hyperinflation."
In our system, the Federal Reserve can buy all the paper the Treasury can issue, and the Treasury can pay the government’s bills with the Fed’s newly printed Federal Reserve notes. But at some point, the scales will tip, and debt investors will decide they won’t be repaid with the same buying power. Historically, that break point occurs when a government borrows an amount equal to 40% of its expenditures over an extended period of years.
Without the support of foreign buyers, government spending will have to be paid with newly printed money, and the inflation consequences will be dire. Historically, nations default when the bulk of the debt is owed to other nations, but the U.S. still owes most of its debt to its own citizens.
If hyperinflation takes hold, expect gold to run quickly higher, Sperandeo writes noting that in hyperinflation, the yellow metal can gain between 2,000 percent and 50,000 percent in value against a hyperinflated, collapsing currency.
Sperandeo notes that gold is trading at more than $1,350 an ounce, despite no appreciable increase in the consumer price index.
Do the gold bugs know something we don’t? In time, the markets will surely say whether this is so. But unless drastic measures are taken to change the trend of deficits, or unless purchasers of U.S. government debt ignore all rational measures of risk, a psychological breaking point is approaching. When this happens, history tells us that hyperinflation is not far behind.
Meantime this week we saw Warren Buffett's Berkshire Hathaway Inc. sell $1.5 billion of mostly fixed-rate debt to retire floating-rate notes at a time when government bond yields are rising. The market watches Buffett's moves very closely and this move seems to indicate that he believes that interest rates in the longer term may go up.
Also this week we saw companies on both sides of the Atlantic embarking on an early-year rush to issue debt in an effort to secure financing before any rise in borrowing costs.
January is typically a frenetic month for debt markets as investors look to put fresh funds to work and treasurers aim to secure some of their funding before entering the “blackout” period around corporate earnings. This year the urge seems to have been made stronger by the economic outlook, which has fuelled expectations that interest rates could rise.
What would rising interest rates do to gold?
On the surface rising interest rates traditionally are bearish for gold since gold does not pay any interest and it actually costs money to store it. But it may be that today’s economic picture is different. Government debt has become bloated, massive, gargantuan. The mountain of debt has been serviced by very low interest rates. What will happen if interest rates go up? The federal debt service costs will skyrocket and the Fed will have to monetize more as a result of higher rates. For debt service costs to skyrocket, interest rates only need to rise marginally.
Rising rates are a bad news for an over-indebted nation since it cripples the economy’s ability to climb out of its debt burden. It can lead to either default or hyperinflation, which basically dooms the currency.
This brings up back to Sperandeo’s article who said maybe “the Gold Bugs know something we don’t.”
For us - Gold Bugs - to learn even more about gold, let’s turn to the technical portion with analysis of the Euro Index. We will start with the long-term chart (charts courtesy by http://stockcharts.com).
Euro - USD Indices
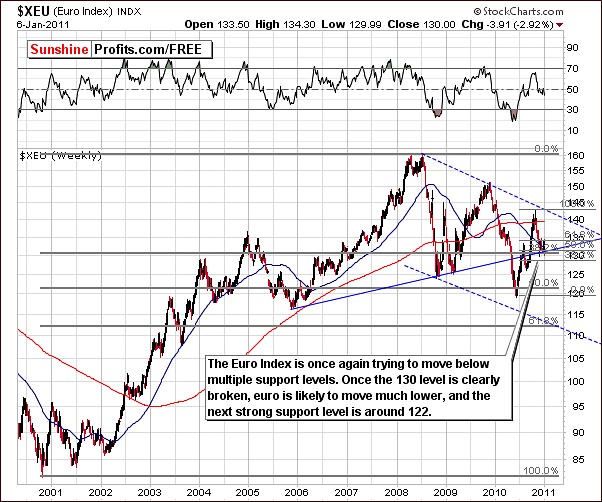
We begin this week’s Premium Update with the very long-term Euro Index chart. No breakdown has been seen yet from a long-term perspective and the index level remains close to 130. Over one month ago we mentioned that several support levels would likely stop the decline or at least pause it for some time. This is exactly what we have seen since that time - a consolidation. Recent signals from the USD Index, however, indicate that further declines are likely in the near-term. The short-term chart below appears to confirm that.
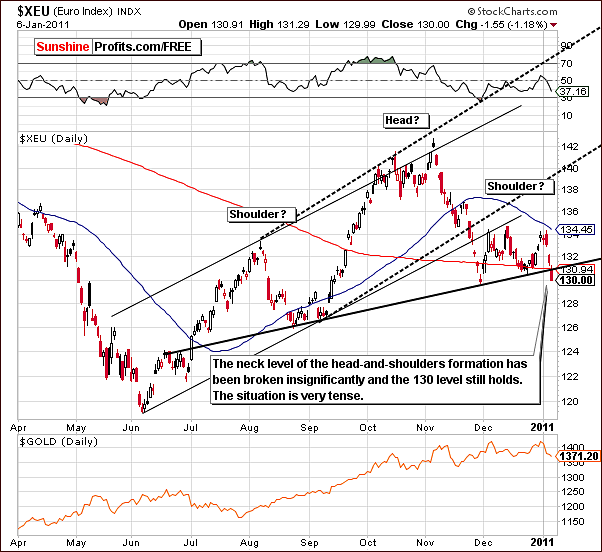
Namely, in the short-term Euro Index chart this week, it is clear that the neck of the head-and-shoulders pattern has been insignificantly broken. With index levels still above the very long-term support levels, the 130 level still holds, however the fact that the neck level has been broken gives the picture a slight bearish bias. This move has not been verified but it is important to note here that whichever way the index moves next will likely determine the direction of the next big move to come. Should it continue to decline, a move toward the 120 level is not out of the question.
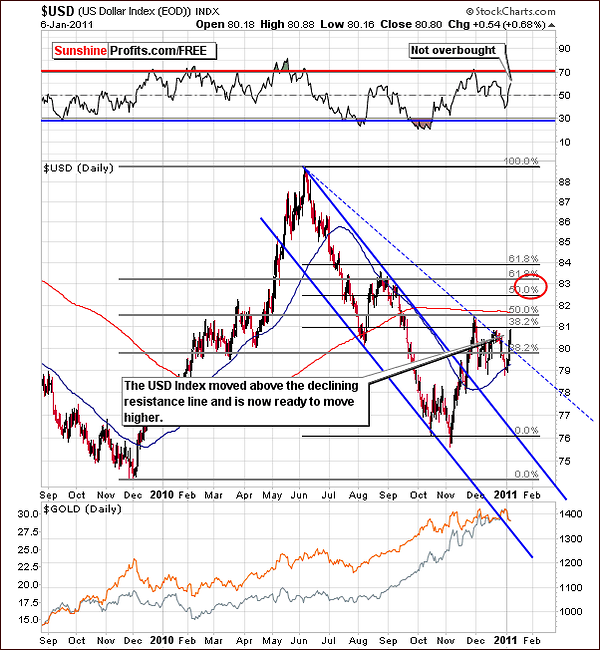
In this week’s long-term USD Index chart, the index level is currently above the declining resistance line. The consolidation has already taken place - in the 79 - 81 range, it is likely that index levels will continue to move up from where they are today - most likely to the area marked with red ellipse on the above chart.
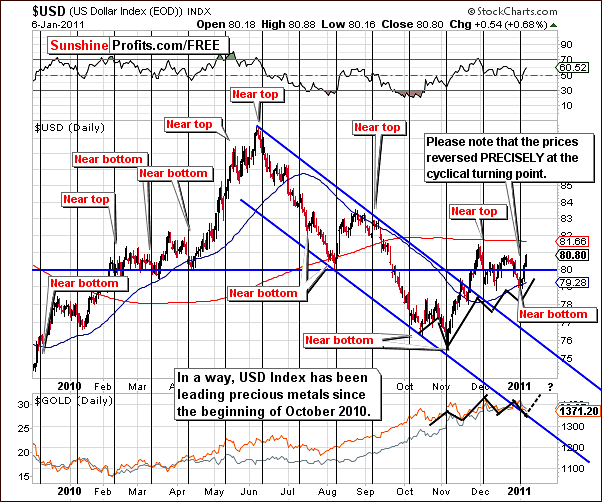
The short-term USD Index chart is perhaps the most important chart in this week’s currency section. Before moving on to the most important observation above, let's take a moment to study the cyclical turning points as they have worked almost perfectly. The recent local bottom is seen to be precisely aligned with the vertical black cyclical turning point line above.
The main point here is the USD influence on precious metals. While it is not visible in the direct way (consequently the Correlation Matrix does not reflect that), the USD Index appears to be leading precious metals. The markets are moving in the same direction although the turnaround is slightly sooner in the USD Index.
In early October, a bottom was seen and gold and silver bottomed as well. The dollar and precious metals declined in late October into early November and then rallied. Tops were reached a bit later followed by a quick decline in the USD Index and subsequent slower declines in the metals sector. Next the dollar rallied and reached a local top and precious metals soon followed.
We now have seen the dollar recover from its December decline and with precious metals having declined also, the suggestion is that they will likely recover as well. This indirect influence from the USD Index is the only real influence seen upon metals from the currency markets at this time.
Summing up, the dollar is likely to strengthen, which would coincide with a decline in euro. The 83 target level still appears valid and recent trends indicate that gold, silver and mining stocks are also likely to trend in the same direction as the dollar - however with a slight delay.
General Stock Market
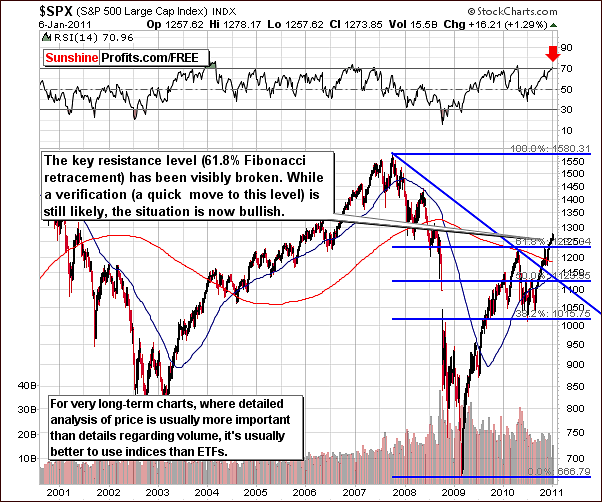
The very long-term SPX S&P 500 chart is the only general stock market chart of real value this week. Although little has changed from last week, it is important to note here that the uptrend has continued and now surpassed 2010 highs. More importantly, index levels are now above the 61.8% Fibonacci retracement level.
With an RSI greater than 70, caution is advised. A recent decline in stocks was not verified and a breakout above previous highs followed. Recent correlation coefficients show little influence from stocks upon precious metals at this time.
Summing up, the implications of the Euro Index and the USD Index are providing a bullish sentiment at this time for gold, silver and mining stocks. The precious metals sector appears to be headed to higher prices and index levels in the weeks ahead.
Correlation Matrix
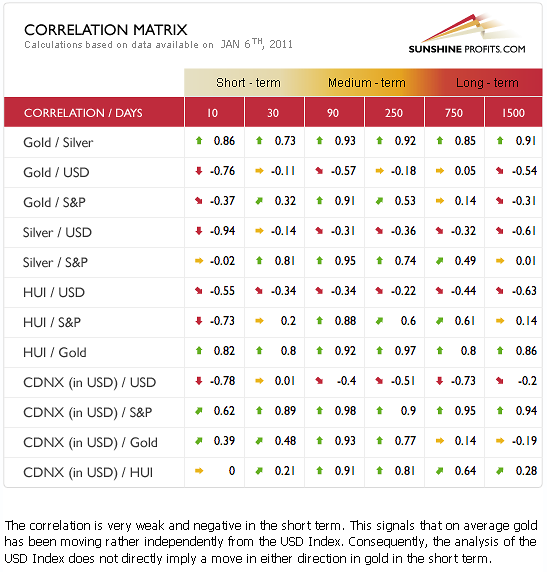
In this week’s Correlation Matrix, the short-term coefficients are quite close to 0 and the dollar appears to have no direct influence on gold and silver. It does show only a slightly negative influence on mining stocks.
The general stock market has a slightly positive influence on precious metals, the strongest being upon silver, which often trends in the same direction as stocks. Still, that has not been the case recently.
Summing up, no direct implications from the dollar or from stocks are seen upon precious metals. There is however, an indirect influence from the USD Index, which was discussed in detail in an earlier section of this update. This provides bullish implications for gold, silver and mining stocks.
Gold
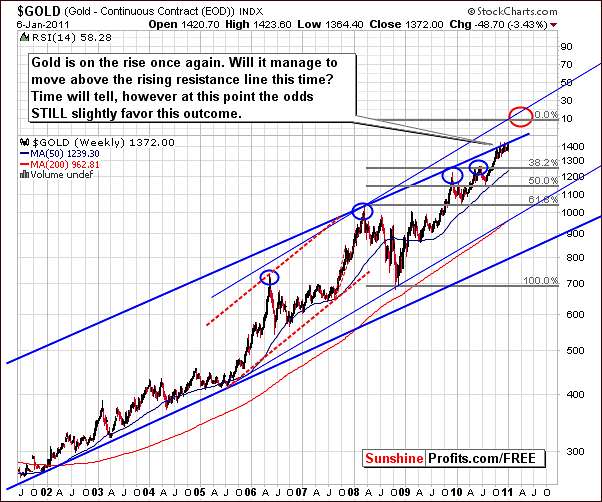
Once again, we begin this week’s gold section with the very long-term chart since it is our most valuable tool for clearly illustrating the true significance of gold’s recent price action. Little has changed this week as gold continues to consolidate along the very long-term resistance level created from previous local tops. Once taken out, a rally to the $1,600 level is likely.
It’s important to re-emphasize (as we have mentioned it in the past) that none of gold’s major rallies in the past have ended with a consolidation period. The normal scenario is for higher prices to follow periods of consolidation. This is clearly seen in late 2009, late 2007 and also in early 2006. The current pause in gold’s rally will quite likely be followed by higher prices. More importantly, no serious breakdown has yet been seen.
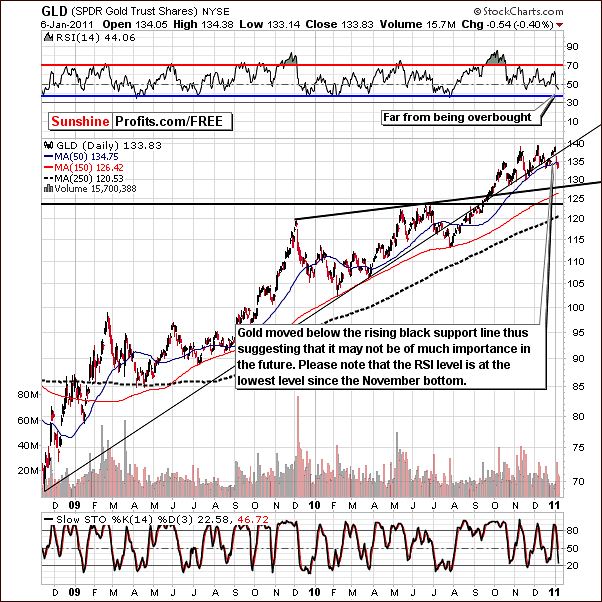
We turn now to the long-term GLD SPDR chart where we see that the very long-term support line has really provided neither support nor resistance in recent weeks. It seems best therefore to focus on other signals in analyzing the weeks ahead.
Volume levels in the past ten days may seem to be on the high side but are in a range similar to those seen in recent consolidations and periods of declining prices.
Gold’s price increase has been stopped by the level of previous low lately and at this time, the RSI indicator is far below the overbought status range.

Another GLD SPDR chart provides a medium-term view back to early 2008. Gold is seen to be holding above the long-term rising support line. This is additional evidence confirming that a price breakdown has not been seen. Higher prices are still likely from here.
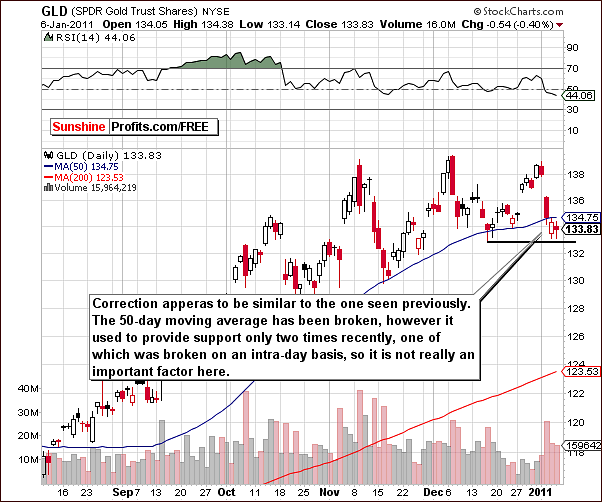
In this week’s short-term chart it can be seen that gold has recently moved below the 50-day moving average. This may be misleading, however, in that this moving average line only provided significant support once in the past. It was in fact broken only on an intra-day basis in December. There now appears to be some consolidation below this level; hence not much weight should be given to this level being broken.
Close to the end of December, high volume was seen with rising prices and low volume seen on declines leading to a bullish sentiment. What followed were slightly higher volume levels along with price declines. This was not alarming because it was closing out 2010 and limited inferences can be drawn from price actions in late December. Historically volume increases are routinely seen once the New Year begins as Investors and Traders get back in the market.
For the above reasons, the sentiment has not turned from bullish to bearish and the price decline was definitely something unexpected. There is always such a possibility, however at this time it can be considered an anomaly.
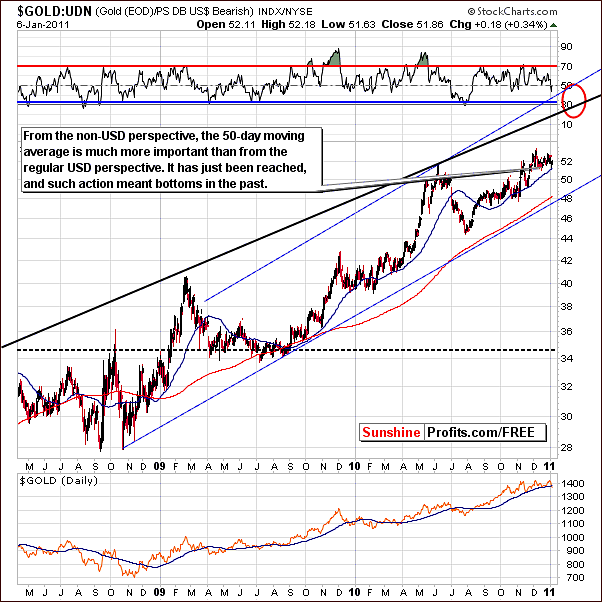
In this week’s Gold:UDN ratio chart (the average of gold priced in currencies other than the U.S. Dollar), we see further confirmation of points made earlier from our regular USD perspective.
In the past month, as in most of last year, the 50-day moving average has provided support, typically being tested at points coinciding with local bottoms for the past 12 months. This is where we find gold’s price today, indicating that a bottom is at hand or is quite close.
The signs are not such that a great deal of excitement should manifest itself at this time, at least not until a breakdown is seen. Since current price levels are not below the levels of recent highs, the breakdown has not yet materialized. Some intra-day price volatility to lower levels has been seen but should not be regarded as significant at this time.
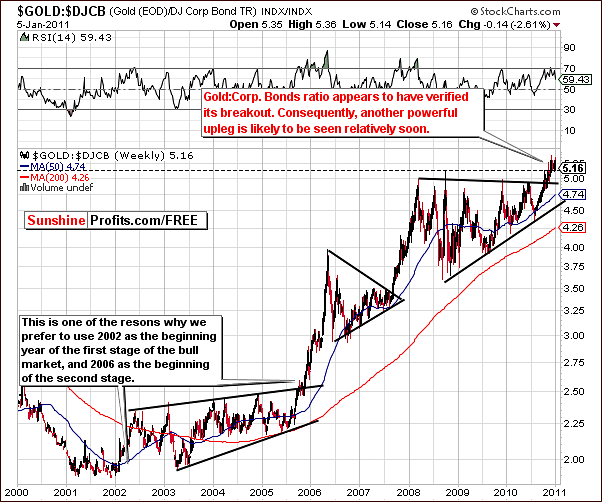
We now look at gold’s price relative to corporate bonds in our final gold chart this week. This index level continues to consolidate at levels above previous highs and therefore the bullish implications which were discussed in last week’s Premium Update still stand.
Summing up, although much has happened this week, the situation and the outlook for the yellow metal has changed little. Although there may seem to be increased risk with volume levels increasing and gold’s price declining, other signals from a technical analysis standpoint appear bullish. The target level of $1,600 still holds and the upside potential is actually even greater than what has been seen in recent weeks. All-in-all, the risk-reward ratio is pretty much unchanged.
Silver
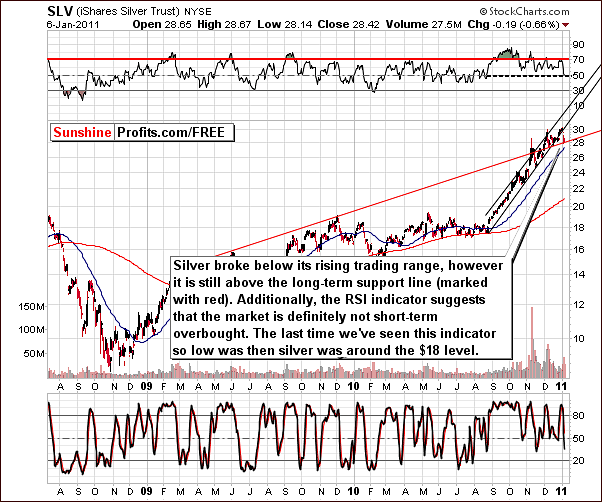
We now turn to the long-term chart for silver to examine its recent price moves in a proper perspective. Silver’s price broke below the rising trend channel. This breakout is not seen as very significant, because the trading channel was broken to the upside several times in the past without profound implications. The price increase was stopped at a rising resistance level, noted in red in the above chart. This line is based on previous tops and is quite important since they are spread out over a long period.
The RSI is presently close to the 50 level, which is worth noting. This was last seen when silver’s price was in the $18 range and a huge rally followed. If a bigger move is still to be seen in silver, then we would want to see RSI close to this level. Consequently, it seems quite likely that bigger moves to the upside will be seen for silver, much as is possible for gold and its $1,600 target. The RSI level certainly makes this option quite feasible.
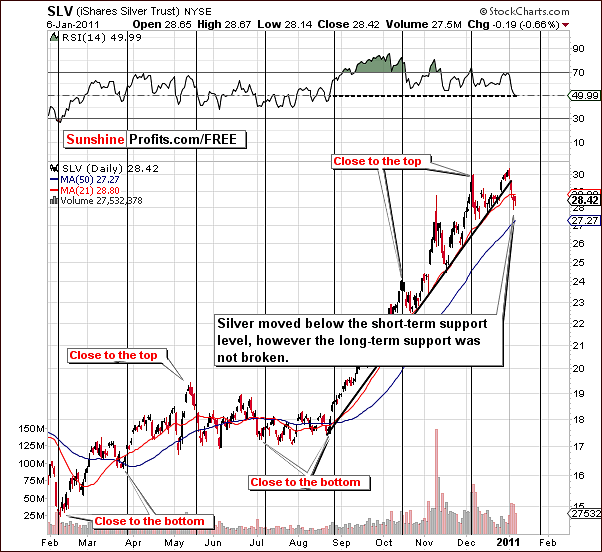
In the short-term chart, it is clearly seen that silver’s price has moved below short-term support levels (including the 21-day moving average). It is important to note here that long-term support levels are far more important.
The recent price decline does not change our overall outlook for silver’s likely trend. Signals from gold, which are always quite influential on silver’s price action, lead us to refrain from any strong bearish sentiment here as well.
Summing up, several mixed signals were seen this week but recent price declines do not appear to have bearish implications. Other factors point to higher prices for silver and the likely influence from gold will be a bullish factor as well. In short, the sentiment remains bullish at this time.
Platinum & Palladium
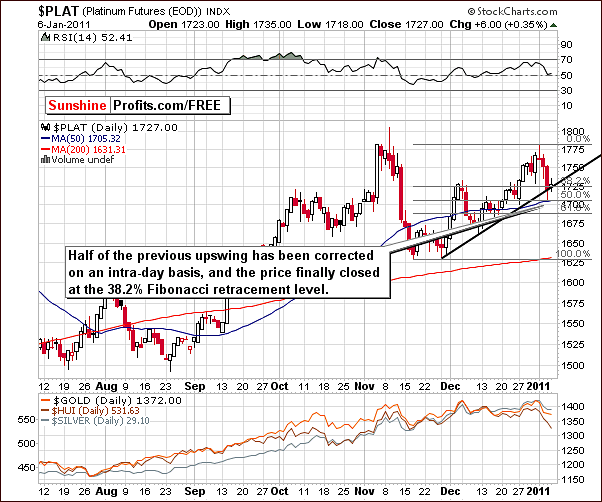
We have included, at our Subscriber’s request, a chart for platinum (and palladium) in this week’s Premium Update. This metal trends in a manner quite similar to gold and the present support level will likely hold recent price declines in check. Although a price decline of nearly one-half of the amount seen in a recent rally, price levels are now back above the 38.2% Fibonacci retracement level and the decline is likely over. Additionally, please note that the rising support line has not been broken.
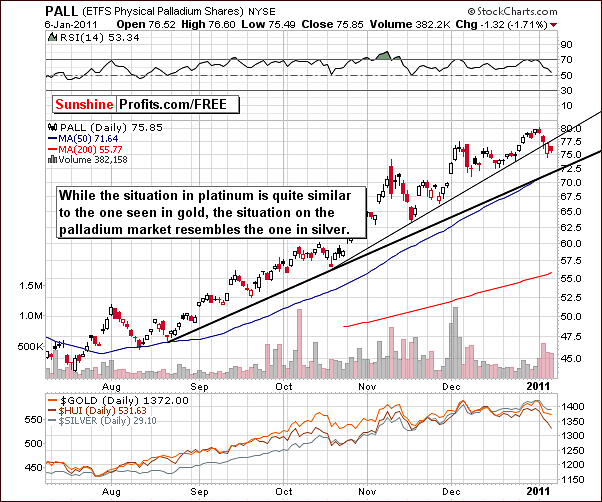
Another new addition this week is the short-term chart for palladium. Being a much smaller market than platinum, similarities are seen here with silver’s price trends. Recent months have seen sharp increases in price levels followed by a break below the short-term support line.
As is the case with silver, signals from other metals (here: platinum) are valuable and influential as coming from larger and more liquid markets. Price movements elsewhere are more significant and the palladium price action is far less reliable in and of itself, similar to what we have often discussed concerning silver.
Summing up, without a bearish confirmation coming from the platinum market, the price action in palladium alone is not sufficient to convince us about the breakdown in these two markets.
Mining Stocks
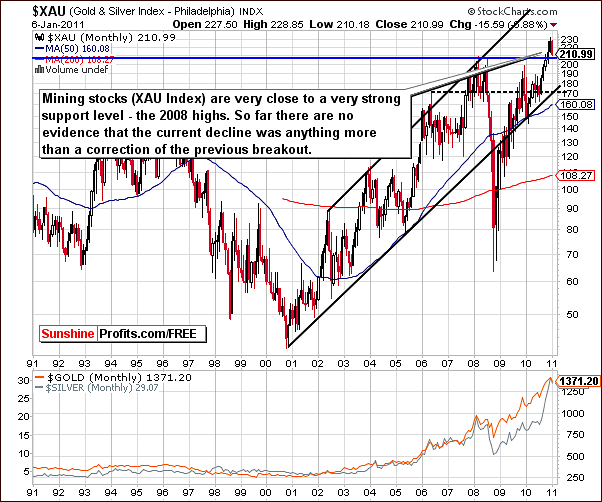
In the XAU chart this week, we see an attempt to verify a breakout - nothing more than that. The index level is presently right at the very long-term support created by the 2008 highs. It appears at this time that the decline will be kept in check. It is quite likely that the bottom has been reached or will soon be in. A new rally will likely be seen beginning fairly soon.
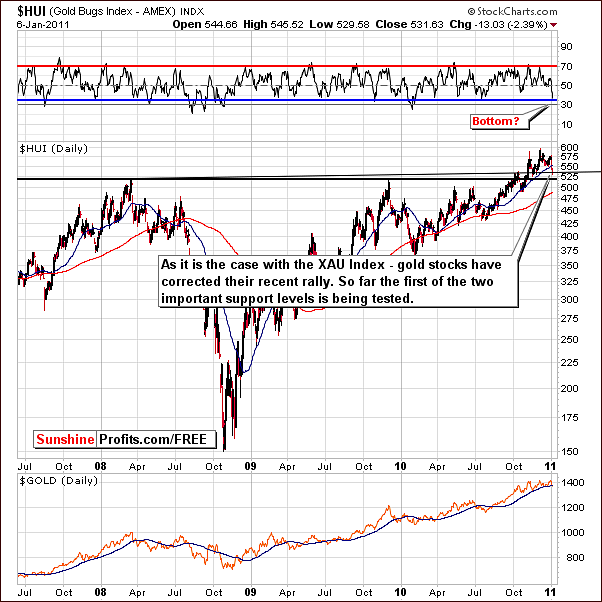
In the HUI Gold Bugs Index chart, two support lines are very much in play. The first of these price levels is presently being verified, although a slight move below was seen. This is not significant and was not verified by three consecutive daily closes.
The situation remains bullish and RSI levels are in line with a local bottom seen six months ago. It is likely that the bottom is at hand or quite close and the situation has not been as oversold since the beginning at the 2010 rally.
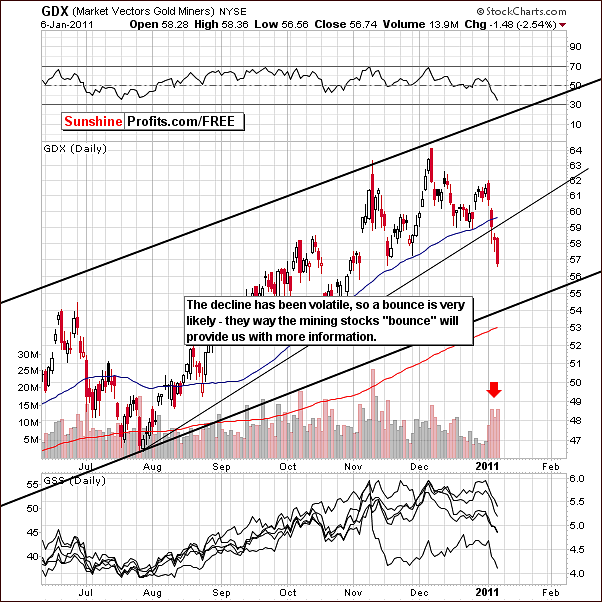
Zooming in and featuring the GDX ETF chart reveals that the recent price decline has indeed been significant on a day-to-day basis. It is probable that a quick move up that is either a bounce or a new rally will be seen very soon. The way in which the price moves in conjunction with volume levels will lead us to develop our expectations for the short-term.
Should volume be weak, more consolidation will likely be seen and exiting long positions could be advised. If volume is strong however, it could be wise to add to one’s long position. Much will be revealed in the days ahead as present price levels are equal to the mid-November low as well as at the very long-term support level (according to the XAU and HUI indices). We will report to you accordingly.
The Gold Miner’s Bullish Percentage Index chart is included this week for the first time in quite a while. Consequently, you might appreciate a quick reminder:
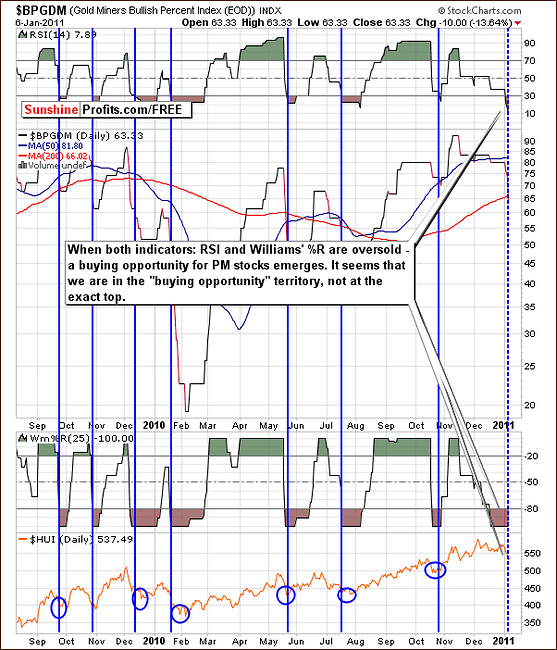
The Gold Miners Bullish Percent Index is a market breadth/momentum indicator and is calculated by dividing two numbers: the amount of gold stocks on the buy signal (according to the point and figure chart, which emphasizes strong moves while ignoring small ones) and the amount of all gold stocks in the sector. If every gold stock is rising, then the value of the index will be at 100%, which raises a red flag as everyone interested in the market is already in, and the top will soon emerge. If we're looking at sentiment, substantial momentum usually corresponds to investors eager to jump in at quickly rising prices because they believe prices will continue much higher and are afraid of being left behind. If we said that at 100% the indicator shows overbought conditions, then you can see on the above chart that at the current 61% level the indicator is not extremely overbought, nor is it oversold. The Gold Miners Bullish Percent Index is no longer signaling that lower prices are to be expected, which was the case several weeks ago. Since the value of the index does not need to be at the oversold levels for a local bottom to form (still it is helpful in timing the major bottoms), we might need to look for additional tools to help us.
If you look closely you will notice two such additional tools in the above chart. The RSI (Relative Strength Index) is a technical momentum indicator that compares the magnitude of recent gains to recent losses in an attempt to determine overbought and oversold conditions.
The RSI also ranges from 0 to 100 with an asset deemed to be overbought once the RSI approaches the 70 level, meaning that it may be getting overvalued and is a good candidate for a pullback. Likewise, if the RSI approaches 30, it is an indication that the asset may be getting oversold and likely to become undervalued. If you look at the RSI indicator in the above chart, you can clearly see that it in fact just moved below the 30 mark.
Another indicator on this chart is the Williams %R, also a momentum indicator that is especially popular for measuring overbought and oversold levels during horizontal trends. Bullish percent indexes take values from 0% to 100% and obviously cannot rise above that level, so it can be viewed as a horizontal trend. Named for its developer, Larry Williams, the scale ranges from 0 to -100 with readings from 0 to -20 considered overbought, and readings from -80 to -100 considered oversold. What I find particularly interesting here, is that the %R indicator has signaled a "temporary oversold" territory only three times in 2009 - and that corresponded to the long-term buying points, and powerful rallies. The last time the %R indicator for Gold miners Bullish Percent index hit the -100 level was during the September bottom - a sizable rally followed. The same signal has just appeared in the recent days, which suggests that we will see PMs higher in the not too distant future.
Currently both: RSI and William's %R indicators suggest that a bottom is in or very close. Consequently, long positions appear justified at this time.
Summing up, mining stock have seen sharp price declines recently but very long-term support lines have held, that is have not been broken. For this reason, the trend appears to be up from here and several signals have suggested that the local bottom is in or close at hand.
Juniors
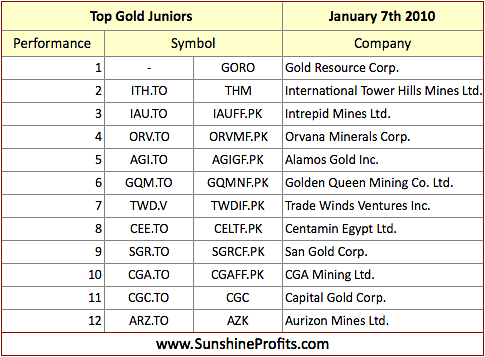
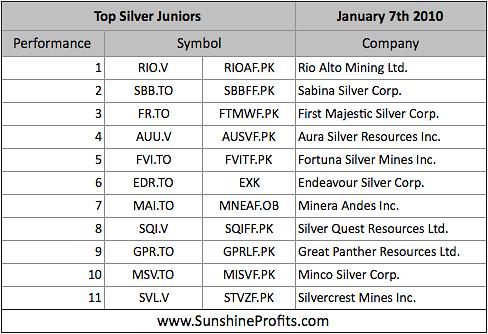
As stated in the Key Principles section, the list of top juniors will be updated approximately every 4 weeks, so this is the Update that should contain the revised version of the list. However, before providing you with details, we would like to comment on this sector's performance in general.
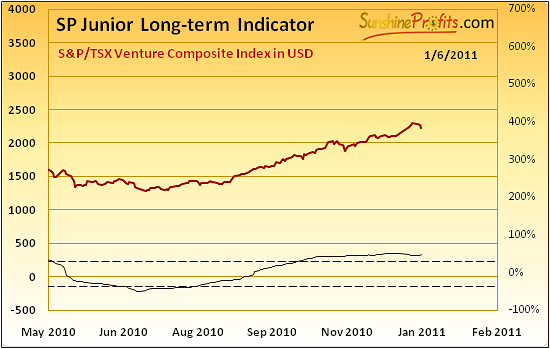
Value of the SP Junior Long-term Indicator has been moving generally in a horizontal fashion - it declined insignificantly and moved slightly back up. Therefore, we not consider the sell signal for juniors to be in, although technically we have seen a slight decline in it (the sell signal for the junior sector is given when this indicator is above the upper dashed line and starts declining). Consequently the situation remains bullish for the junior sector. It might change, but it is not the case yet.
As far as commentary for juniors is concerned, we decided to remove couple of entries from our list. Not that they have performed badly. We simply prefer other stocks to them and the relative outperformance of other stocks (still present on the list) was quite significant.
We have removed the following stocks from our list:
13th position (last) from December's gold junior list, which is AAG.V (Andean American Gold Corp.).
12th, 13th, 14th positions from December's silver juniors list, which are BCM.V (Bear Creek Mining Corp.), IPT.V (Impact Silver Corp.) and USA.V (U.S. Silver Corp.).
At this point you may or may not consider switching from these juniors to the ones that are still on the list. If the transaction costs are significant, then you might want to hold your current investments. If these costs are low, you might be better off by selling the abovementioned stocks and diversifying into other stocks mentioned in the rankings below.
Letters from Subscribers
This week we would like to answer the question about the precious metals "tax paradox". One of our Subscribers wanted to know if there is any way to avoid the following situation:
1. As the government destroys the dollar's value, John buys PMs to retain his wealth.
2. As the dollar collapses, gold's price increases. John's wealth is retained.
3. The government, which orchestrated the dollar's demise, ignores that demise and views John's wealth retention as newly created wealth (a.k.a. taxable "gains" - even though no new wealth was created).
4. The government imposes heavy taxes on John's "gains".
5. The Paradox - whether or not John invests in PM's, the government takes a vast portion of his wealth. The more "gains" John accumulates, the more real wealth he loses via taxes on phantom wealth.
With turbulent times ahead we would not rule out such a scenario. At first it seems that there's not much that one can do about it. At the second thought, though, it appears that they are ways to deal with the situation, however none of them is perfect.
One idea is to take physical delivery of the metal now, and sell it to someone without notifying anyone else. Of course, we have to stress that you will need to be sure to follow the applicable laws in your jurisdiction.
Another idea is to prepare for this situation and diversify geographically. The best way would be to buy physical gold and store it with independent storage services around the world. That's the most difficult way.
There is also somewhat middle way - purchasing some of your metals in the physical form, and spreading the rest of it in several funds that hold the real metal (no pool accounts nor "unallocated" gold/silver whatsoever here) might be a good way to go. The important part here is that these funds are governed by different jurisdictions. It will be likely that such a tax would not be imposed in all jurisdictions at the same time. Probably, it would not be imposed in all of them at all.
Generally, there is a trade-off between security and convenience. The more risk-averse you are, the more diversified and more difficult-to-implement approach you should take.
Please go to our Key Principles section for more information about purchasing bullion, and read our comments on the main ETFs for additional information.
Summary
It may sound very strange, but it appears that the USD Index has been leading the way for precious metals and suggests higher prices are likely to be seen soon. The general stock market may enter a consolidation phase in the near-term but has had little influence on gold, silver and mining stocks recently.
Recent declines in precious metals prices have been clearly seen from a short-term point of view. This may appear scary to some. Note, however, that if price declines are short lived, this means little to speculative long positions. Also, please keep in mind that in the past none of the major upswings ended in a consolidation pattern, which makes it less likely that the rally is completely over now.
Many signals suggest that the trend is up. Long-term support lines have only been touched not broken. Although there may seem to be increased risk with volume levels increasing and gold’s price declining, other signals from a technical analysis standpoint appear bullish. The target level of $1,600 still holds and the upside potential is actually even greater than what has been seen in the previous week. It's associated with bigger risk, so the risk to reward ratio did not change much, and consequently only a small long speculative position seems justified at this point.
Our next Premium Update will be published on Wednesday, January 12. We will continue to monitor the situation on the precious metals markets and report to you when significant developments are seen.
This completes this week's Premium Update.
Thank you for using the Premium Service. Have a great weekend and profitable week!
Sincerely,
Przemyslaw Radomski

