
I don't know about you, but my e-mail inbox is inundated every week with so many financial newsletters with contradicting advice that it is no wonder that some of my readers get confused even when we send out clear buy and sell signals. Last week we sent out a Market Alert with a buy signal for precious metals just a day after the regular issue of Premium Update was posted.
Nevertheless, we received a few emails from Readers who were hesitant or confused. Naturally, we canÕt blame them. Without a doubt it has been difficult for gold bulls to watch the price of gold tumble since the heady first few days in December when gold reached its high.
Also, there is so much contradictory information and noise out there. On one side you have people like Jim Rogers, who say gold will hit $2,000, Peter Schiff, President of Euro Pacific Capital, who predicts $5,000 and James Turk, author of GoldMoney, who predicts $8,000.
On the other hand, you have Alan Heap, a senior analyst at Citi Investment Research, who came out with a bearish prediction last week that gold prices could sink to $820 an ounce by 2014. Another article in my inbox said that the Chinese government wants gold price to plunge to the $800 per ounce level so they can buy more gold at a better price and build up their reserves. After all, China has the world's biggest "long dollar" trade with a mountain of dollars sitting in its reserves. It needs the dollar to firm so it can dispose of it in exchange for more tangible assets. It also needs gold prices to go lower so it can buy more to build up its reserves. In short, China wants to get the best price on the dollars it sells and the metal it buys.
So, when you read so many contradictory newsletters it's easy to get confused. It's also easy to get frightened by news reports of the latest Crises of the Day. Last month's flavor was Dubai, this month's flavor is Greece. The world is undoubtedly facing grave problems, the most recent may have begun in Athens, but it is spreading to Lisbon and Madrid. A Financial Times columnist yesterday pointed out that it would be a grave mistake to assume that the sovereign debt crisis that is unfolding will remain confined to the weaker Eurozone economies. It is a fiscal crisis of the western world and its ramifications are far more profound than most investors currently appreciate. All these things add variables to our equation that may confuse and frighten some precious metals investors.
There are other mistakes that we can make as investors and one of them is lack of patience. We want immediate results. Thirty years ago, the average holding period for stocks trading on the New York Stock Exchange was five years. Today, the average holding period for NYSE-traded stocks is just six months. On average, investors are willing to wait just six months to make money. As gold investors we also need to learn patience and know that the trajectory for gold prices is never going to be a straight line. If we believe that we are right and that gold is ultimately in a bull market, we need to be able to ride out the corrections.
In the last Premium Update we wrote about the bearish outlook for the stock market, saying that it is one of the most important things to consider while making investment decision in virtually any market, including the precious metals market.
The current move appears to be the beginning of a bigger decline, especially if one takes the volume into account. Please note that the current action in volume is clearly different to what we've seen during previous declines that were in fact just small corrections within the bigger move up. Naturally, the general stock market may move higher from here, but based on the action in volume, we find it unlikely.
I would like to remind you that back in March 2009, stock market investors were terrified, which is when the market began its upward trend. Investors went from "terrified "to "greedy" in just 10 months. Today, speculation is popular in the general stock market, which indicates a good time to be afraid.
The American Association of Individual Investors conducts a weekly poll to gauge the overall sentiment of their membership. They ask their members where they think the market will be in six months, and group the responses into three categories: bullish, bearish or neutral. In a recent poll, just 23% of individual investors called themselves bearish. Individual investors, according to AAII, now have a bigger portion of their money in stocks than at any time since 2000.
Options traders, who are supposed to be more sophisticated investors, bought 2.5 call options for every put option they bought, another indicator of optimism. Another AAII Sentiment Survey tracks the bullishness and bearishness of 140 different advisory newsletters. The latest figures show that bullish sentiment among newsletter writers is currently at 34.1%, which is the lowest level since March 2009. In the previous survey the bulls took 49%. The big change in sentiment is after a 7.5% drop in the S&P 500 from the January high. It seems that the bulls are beginning to head for the hills.
In conclusion, we understand that these are frightening and confusing times for investors. Since this is exactly what we specialize in, it's easier for us to filter out the noise and hear the loud and clear signals that we receive from studying the charts and indicators, and report to you accordingly. We believe that you might have found our last year's record outstanding and if the technical analysis' principles prove correct once again, and the history repeats itself, we hope to justify your trust this year as well.
Let's begin this week's journey through charts with the general stock market (charts courtesy by http://stockcharts.com.) After all, it was this market that provided key signals last week, and which needs to be currently monitored with great caution.
The General Stock Market
The reason for the particular caution needed while analyzing the general stock market is that we have strong reasons (sentiment, technical, etc.) to believe that the current downleg is a beginning of a more significant move down. This means that the emotion that we need to deal with here is fear, not greed, which would be the case if prices were rising. From a psychological point of view, fear is much stronger emotion than greed, and taking a look at virtually any chart reflects that. Declines are usually steeper than upswings, mostly because of the abovementioned psychological reason. Consequently, the general stock market needs to be monitored very carefully, because another move lower is likely to be sharp.
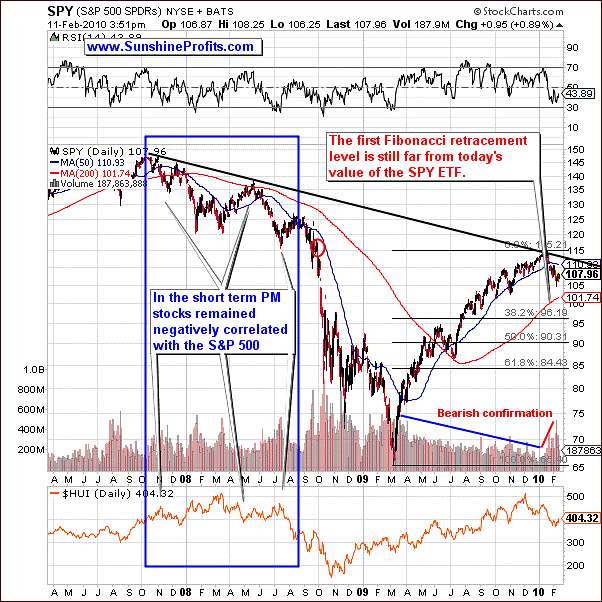
First thing that comes into mind after looking at the above chart is that if this move is indeed a beginning of a serious decline, then we are still in its early stages. Please note that the Friday intra-day low was still much above the 200-day moving average, not to mention the first Fibonacci retracement level of 38.2%. Actually, the SPY ETF would need to move lower by a similar amount of dollars to what it already declined in order to reach the first retracement level.
Naturally, the question here is how low can the general stock market go during this plunge. Last week, we mentioned that it is too early to say, and that it seems that the decline is not even 50% over yet - and we don't have much to add this week, besides stating that the first Fibonacci retracement (around the $96 level) is likely to stop the decline at least temporarily.
One of the questions that we've received this week from our Subscribers was about the probability of the S&P and the Dow heading back to the lows of March 2009, and the time frame, during which it could take place.
Again, it is too early to provide highly probable estimations, but since it seems that you would like us to speculate on that matter anyway, we will do our best. Before we proceed, let us digress for a moment. It may appear strange that we can regularly make successful calls without being sure (or even without having a highly probable estimation) what's going to happen in 6 months or so. It is possible because we get additional information along the way and are able to adjust our analysis accordingly. One of the best analogies here would be driving a car at night through the area with which you are not familiar. In this case, you cannot see further than your headlights allow you to, but you can safely stick to the road and reach your goal anyway.
Having said that let's "guesstimate" how probable it is that the general stock market would go to a given level. Based on today's data:
- 10% that the decline is over,
- 30% that it will be stopped at the first Fibonacci retracement level (around $96),
- 10% that it will be stopped at the second Fibonacci retracement level (around $90),
- 10% that it will be stopped at the third Fibonacci retracement level (around $84.5),
- 20% that it will move to March 2009 low,
- 20% that it will move below March 2009 low.
In other words:
- 10% that the decline is over,
- 40% that it will be stopped above or at the first Fibonacci retracement level (around $96),
- 50% that it will be stopped above or at the second Fibonacci retracement level (around $90),
- 60% that it will be stopped above or at the third Fibonacci retracement level (around $84.5),
- 80% that it will be stopped above or at the March 2009 low.
This leaves the 20% chance that the general stock market would move below its March 2009 low. Should that take place, we would expect it to take place in about 10 months, possibly close to the 2nd anniversary of the 2007 high. Let us once again emphasize, that these are not very probable calls, and we provided them just to put the current daily moves into bigger perspective.
The action in volume is clearly negative, as the volume increased visibly along with lower prices and this is the most important technical reason why we believe that there is a 90% probability that this was not the final bottom for this decline. Still, the point made in the latest Market Alert, is still up-to-date:
The general stock market is likely to move temporarily higher and the corrective upswing may take several weeks. It's much too early to say if the main stock indices will move above the January high - for now it doesn't seem likely.
There is one more thing that we would like to comment on before providing you with the short-term chart - namely, the fact that during the early part of the 2007-2009 downswing, precious metals stocks were negatively correlated with the general stock market. Please take a look at the area marked with the blue rectangle on the above chart. For over 10 months PM stocks were trading in the opposite direction to the general stock market - if one takes short time-frames into account. Please note that tops in PM stocks were reached along with bottoms in the main stock indices and vice-versa. Still, taking the long-term perspective - both markets plunged dramatically.
The reason why we mention this phenomenon in this update is that it shows just how tricky relying on the stability of a given correlation can be. Today, we see that the main stock indices are closely positively correlated with PM stocks and PMs in general, but that doesn't mean that over several months these markets must go in the same direction. We will keep our eyes open for additional clues, and report to you accordingly.
Having said that, let's move to the analysis of the short-term chart.
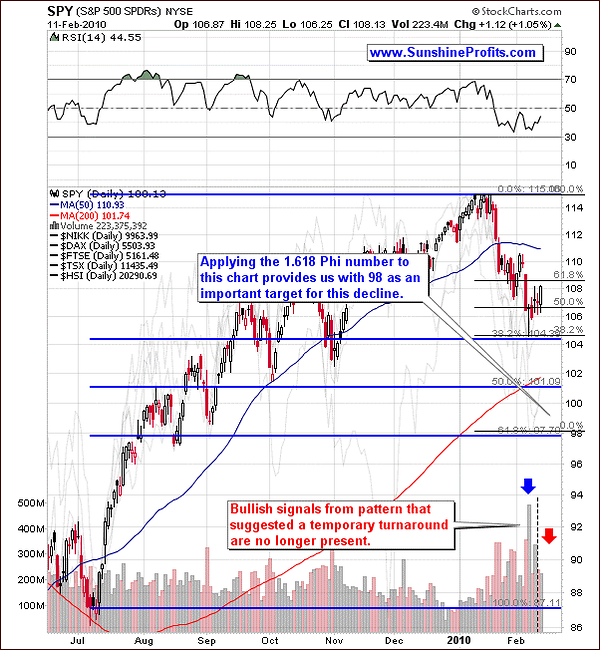
Contrary to the overall bearish confirmation from the volume, the short-term signals were quite bullish not too long ago - please note the time frame marked with a blue arrow. Volume declined during the move lower, and increased along with higher prices, which suggested a reversal. In fact, that was one of the reasons for sending out the latest alert. However, the signals coming from the analysis of volume ceased to be bullish on Wednesday, and yesterday's action confirms it. During the last few days we have not seen any confirmation suggesting that stocks are to move higher from here. It currently seems that the consolidation will take more than just a few days, but the lack of positive signals indicates that the main stock indices are not necessarily likely to move much higher during the next few days/weeks.
Moving back to the long-term chart, please note that the consolidation after the first part of the downswing in late 2007 took over one month, so this consolidation is not necessarily just a few-day phenomenon either.
The analysis of the short-term chart provides us with an additional target for this decline - namely the $98 level (which is close to the abovementioned $96 level, thus creating a strong support area) created by applying the 1.618 number to two moves - the current decline, and the preceding upswing.
Please note how these two techniques point to virtually the same level. The reason is that the recent low was formed very close to the 38.2% Fibonacci retracement (1 - 61.8%) of the previous move, and that the Phi number has many particularly interesting properties. Here: (1-0.618) * 1.618 = 0.618.
Since we began this update by describing one of the key drivers of PM prices, we will now provide you with the analysis of the second market driving prices of PMs - the U.S. Dollar.
USD Index
The largest component of the USD Index (57.6%) is the Euro - and given EU's recent problems - Greece debt problems (Spain and Portugal are also at risk) it seems that this currency may lose some of its appeal in the coming weeks, as investors dump it.
There are several ways, in which the powers that be can deal with Greece's debt, and each of them is bad for the Euro in a way. Since EU pledged support for Greece, it may be the case also for other countries that will face similar problems in the future. This will either burden the EU taxpayers directly or indirectly (by monetization of debt in this way or another.) Additionally, it doesn't send out an encouraging message to Ireland, which chose to cut down their budget instead of requesting a bailout - this can influence negatively the political stability of the Eurozone in the future.
Markets discount all of the abovementioned information and predictions and it puts a downward pressure on the value of Euro, which in turn is a positive factor for the USD Index.
The question now is whether or not this is bearish for gold - after all, PMs tend to move in the opposite way to the U.S. Dollar, so one might expect the current situation in the Eurozone to be bearish for the precious metals market.
In order to answer this question, we need to consider why does the USD's decline cause a rally in PMs (all other things being equal.) The short answer is - because that is the currency they are price in. In order to explain it in a more detailed way, we will quote what we wrote almost two years ago:
The undeniable reason is that gold is priced in the USD and, therefore, virtually has to respond to its up- or downswings, by moving in the opposite direction. If the value of gold was perceived as constant by the investors from all over the world and the value of the currency in which it is priced, falls, then in order for the price of gold in their respective national currencies to be stable, it has to rise in terms of US Dollars. If the price of gold did not rise as the US Dollar falls, then foreign investors would see price of gold fall in their national currencies. Unless foreign investors changed their mind about the value of gold, they would start buying gold, as it now is cheaper for them than it was when they thought the price reflected gold's value. As they would purchase, the price of gold in all currencies would go up (including USD). For people, who make transaction in the US Dollar it would seem as if the price of gold has just went up out of the blue, when in fact it would be their Dollars that lost value, while gold's ‘real' price was not affected.
The first point that we would like to make here is that the "USD flight to safety" is being recognized as a joke for more and more investors, who take a look at fundamentals and also trends present in the USD and gold markets. Investors are waking up to the fact that it is gold and silver that can protect their wealth in times of economic turbulence, not the U.S. Dollar, which has been losing value for years now (taking the big picture into account). Moreover, precious metals are (and always were) the ultimate form of cash, so the true flight to safety will mean much higher gold prices, in virtually all currencies.
Therefore, "foreign investors are changing their mind about the value of gold" - please compare that to the text written with bold font above. Part of the money that would be switched from Euro to the U.S. Dollar will most likely be used to purchase PMs, and this is likely to result in higher prices of gold along with higher values of the USD Index. Going back to the explanation quoted above - gold is not declining in the USD in order for its value to remain the same in other currencies. Instead, gold is rising along with rising/trading sideways dollar, as the PM purchases from investors holding Euro are more than offsetting the dollar influence.
We can see that happening right now - please note that during the last several days gold managed not to decline along with higher USD value. Please take a look at the chart below for details.
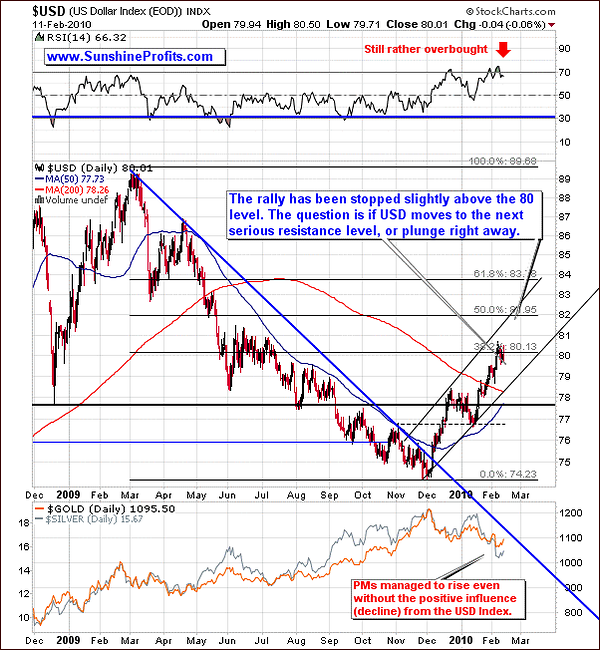
Silver and gold managed to rise without the positive influence from the dollar, which is generally a bullish sign. Moreover, it suggests that PMs may move higher even if the USD Index rallies as well. Just a few days of data are not enough to get over-excited about this phenomenon (that's why our Correlation Matrix doesn't reflect that), but it serves as a subtle clue that if we saw another upleg in the USD Index we would not need to be very afraid that PMs would tumble dramatically.
Let's take a look at the short-term chart for details.
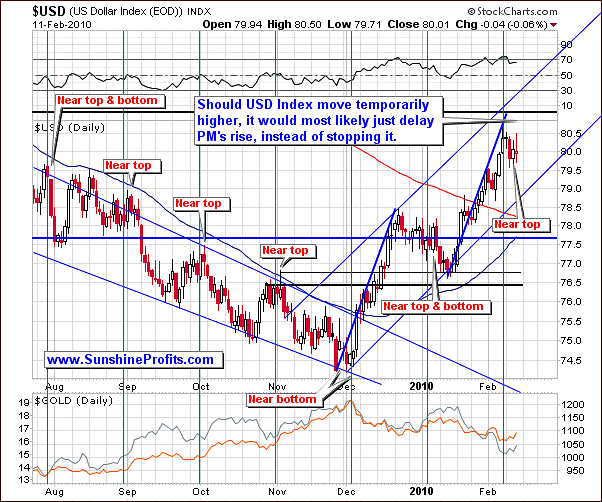
Although every technique and tool requires a healthy does of skepticism before one applies it, the cyclical tendencies have once again proven to provide key signal weeks before the final top was reached.
The price alone doesn't provide many clues for the short-term direction, in which USD Index may move, so let's take a look at the chart of the PowerShares DB US Dollar Index Bullish Fund (UUP), which allows us to analyze volume.
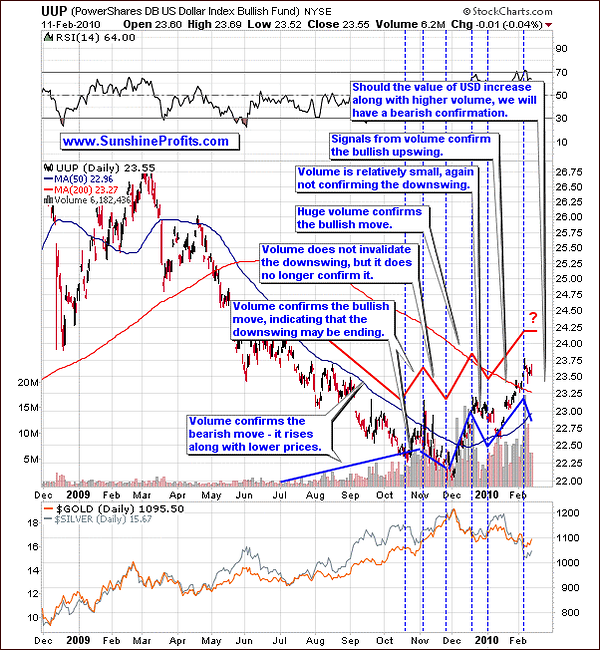
Signals coming from the analysis of volume are neutral so far - USD Index is consolidating and the volume dries up. This is normal during consolidations / corrective downswings, but should that take place along with higher prices (for instance if USD tries to move above the recent high), it will serve as a bearish sign.
Gold
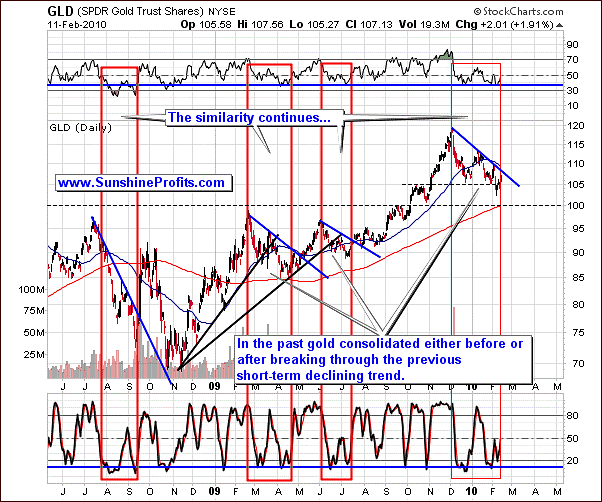
Moving on to the gold market we see that the similarity that was present during the latest decline is still present after gold bottomed. This time, however, it suggests that gold may soon need to consolidate for a week or so - just like it took place in the past. Please take a look at the areas marked with red rectangles - gold paused when it moved to the declining short-term resistance line (April 2009), or it broke above it and then verified it as support (October 2008, July 2009). Should history repeat once again, we can see a similar pattern also this time, which would correspond to points made while analyzing the USD Index.
The short-term chart provides us with more details.
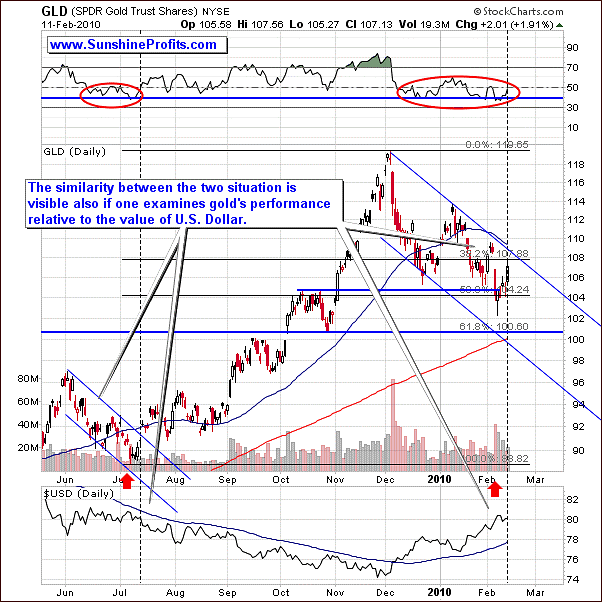
The short-term chart allows us to see that points made just a few paragraphs above (similarity of patterns) are confirmed also by gold's performance relative to the USD Index. Please note that the previous significant rally in the yellow metal began when USD was trading sideways, which is also the case today.
We did not make detailed projections for the short-term moves, because there is too much contradictory influence coming from the USD Index and the general stock market at the moment, and we believe these are the key issues that we need to focus on. Once we get a clearer picture, we will be able to provide you with more detailed short-term price projections.
Before moving to the analysis of the silver market, we would like to mention the fact that if you bought on Monday (after we sent out the Market Alert on Saturday), you were able to get in at more favorable prices than you would get by buying at the end of the session on Friday.
Silver
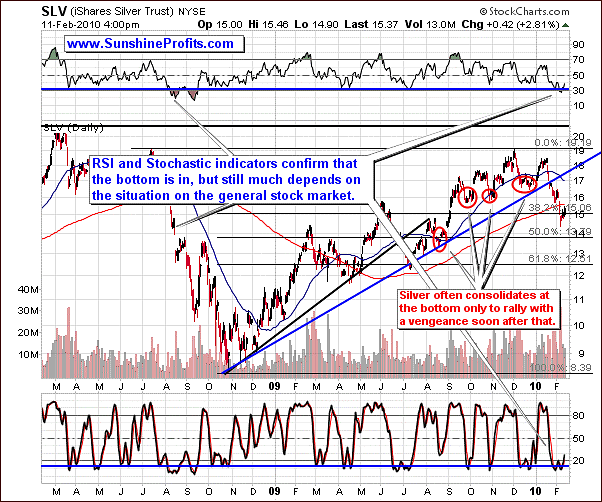
Silver moved down very sharply, which is nothing new to investors following this market for years. After all, the price of silver is known to be very volatile. Fortunately for the silver bulls, there is also another side of the coin meaning that the white metal moves fast also on its way up.
Given that fact it may seem strange that silver (the SLV ETF) is currently hovering around $15 instead of rallying strongly. However, taking a second look at the above chart reveals that this is the way that silver used to behave shortly after it had bottomed. We've marked these situations with red ellipses. Please note that if that pattern is to repeat itself once again, silver may move much higher soon.
Still, based on the recent high correlation between silver and the general stock market, it seems that we will need to wait for additional confirmation before stating that the major bottom is behind us. We've had a buying opportunity just a few days ago, but it's too early to say if that was indeed the final bottom. We will keep monitoring markets for any signs of weakness and report to you if anything suggests that another move lower is in the cards.
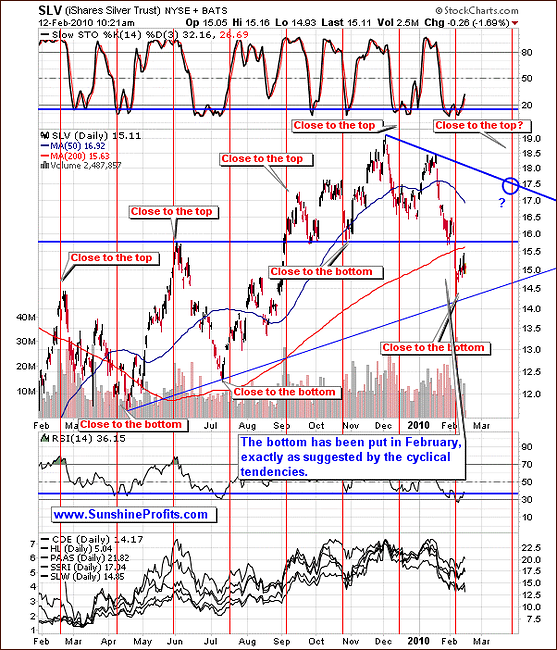
The next target for the SLV ETF is at the $17.5 level and silver is likely to reach it within a month or so. Naturally, much depends on the general stock market and on the USD Index.
Please note that the Stochastic indicator has put a double bottom, which is characteristic sign on the silver market. This, along with the situation on the RSI indicator and most of all - the cyclical tendencies, suggests that the bottom is in.
Speaking of high correlation between PMs and the general stock market, let's take a look at our correlation matrix.
Correlation Matrix
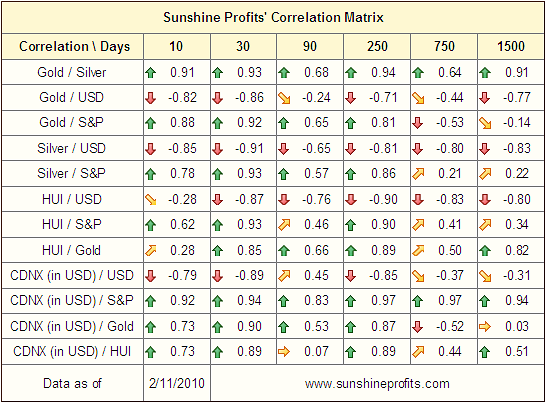
Numbers in the correlation table have changed slightly from the last week, in the predicted direction. Namely, the PM market is now very highly correlated with the general stock market (correlation numbers of 0.92, 0.93, and again 0.93 for gold, silver, and the HUI Index respectively), which confirms points raised in the above part of this update. Consequently, the general stock market still needs to be taken into account.
An interesting fact is that the very-short-term (based on just 10 trading days) influence of the HUI Index is stronger for the general stock market than it is even for gold. In other words, during the last 10 trading days, gold stocks were more closely following main stock indices than there were following gold.
Speaking of the HUI Index, let's take a look at its long-term chart.
Precious Metals Stocks
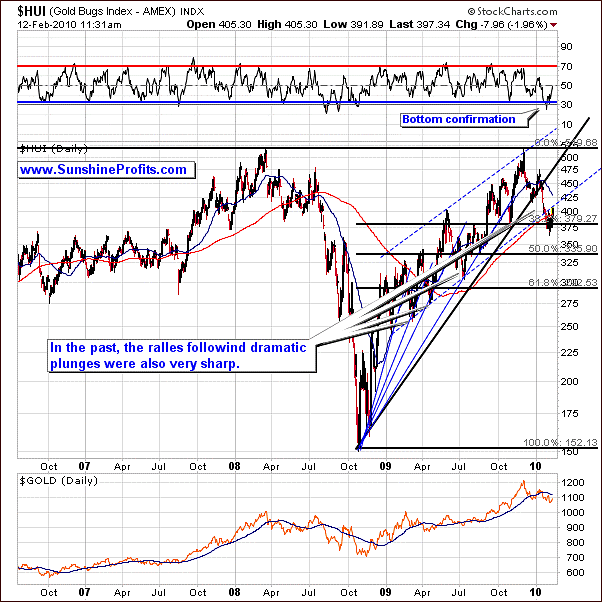
The HUI Index bottomed right below the 38.2% (100% - 61.8% or 61.8% / 161.8%) Fibonacci retracement level, and is now moving higher. Please note that in the past rallies following dramatic plunges were also very sharp. Extrapolating this tendency to the current situation suggests that gold stocks are to move higher from here.
That outcome is certainly possible based on how the situation in the RSI indicator, which is currently far from being overbought - no wonder, gold stocks moved only slightly higher so far.
Let's turn to the short-term chart for more details. Here, we will use the GDX ETF as it allows us to analyze volume.
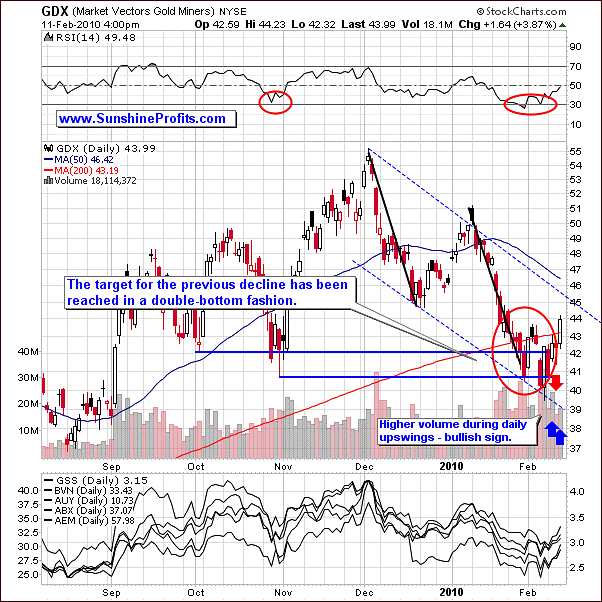
The volume in the GDX ETF provides us with additional bullish signals, as it - contrary to the situation in the SPY ETF - is higher during days when the price rises. Moreover, the RSI indicator moved higher after having bottomed around the 30 level, which often served as a confirmation of a bottom in the past. One of such examples comes from late October, when GDX started an almost $15 rally.
It is too early to say when will the next top materialize, as currently much depends on the main stock indices. For now, it seems that the general stock market will consolidates for some time, which will allow PM stocks to rally along with higher PM prices.
Again, please note that by purchasing this ETF on Monday one would get a far better price than near the end of the session on Friday.
The final chart that we would like to provide to you in this week's Premium Update is the chart of Gold Miners Bullish Percent Index. As a brief reminder - the Gold Miners Bullish Percent Index is a market breadth/momentum indicator and is calculated by dividing two numbers: the amount of gold stocks on the buy signal (according to the point and figure chart, which emphasizes strong moves while ignoring small ones) and the amount of all gold stocks in the sector.
The Gold Miners Bullish Percent Index
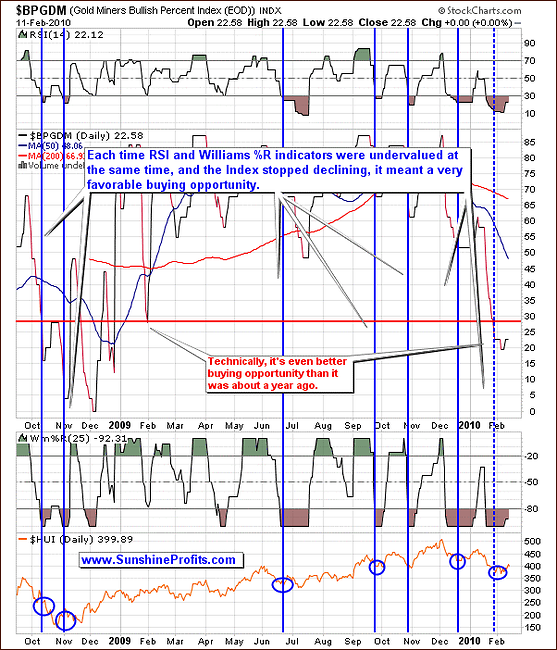
The buying opportunity is signaled when the value of the index stops declining and at the same time both indicators from the above chart (RSI and Williams %R) are in the oversold territory. Sometimes this technique suggests getting back to the market too early, but it definitely does not suggest buying at the top.
The latest signal was given recently, during the first of the two bottoms PM stocks have formed. Since that time the value of the index moved even lower (below 20), and has now moved slightly higher, thus confirming that the bottom is indeed in.
The thing that we find particularly interesting is that this index moved very low during this decline. It is now at the levels that were not reached during the whole previous year. In a way, this implies that we are now in a better situation in PM stocks than it was the case even during the January 2009 low. This is very encouraging for anyone holding PM stocks as a long-term investment, but again, the general stock market still needs to be monitored.
Juniors
One of the e-mails that we've received from our Subscribers this week included a suggestion for us to cover the GDXJ ETF, as it seems to be a way to analyze the whole junior sector. Additionally, it would allow us to analyze volume. Generally, that is a very good point, but since this ETF was introduced relatively recently (started trading on Nov 11th, 2009), we wanted to "wait and see" for ourselves if it is indeed a good proxy for the sector. If you are not familiar with this fund - Junior Gold Miners ETF seeks to replicate as closely as possible, before fees and expenses, the price and yield performance of the Market Vectors Junior Gold Miners Index.
You can find more information here about this ETF on the Van Eck ™ Global website.
As mentioned above - GDXJ has been trading for only a few months (since Nov 11th, 2009), so there's not much that we can comment on in technical terms, but if you wanted to own juniors, but wasn't sure how to diversify, this might be a good way to go.
Please note that we don't advocate investing in juniors at the moment because of the bearish situation on the general stock market.
Summing up, the GDXJ looks promising as a proxy for the junior sector - at least so far, but we believe only a few months of data is not enough to make conclusive calls here, and to include it in our Premium Updates on a regular basis. It is highly probable that we will get back to this issue in the future.
Summary
The USD Index seems to have formed a top, but that may prove to be just an initial one. Additional signals will be provided when USD does in fact move higher. Should that take place on a low volume (UUP), it will mean that the dollar is likely to resume its decline rather soon. On the other hand, move up on higher volume means that what we've seen so far was not necessarily a bottom. Fortunately, based on their recent performance, PMs may not plunge along with higher USD values.
The general stock market seems to have put a local bottom, which is likely to begin some sort of consolidation before the move lower is resumed. This action provides a chance for PMs to rally, and it seems that they are already taking advantage of it. The situation on the general stock market can change very quickly (just like it was the case a week ago), so one has to monitor it for important clues. Naturally, we will send out a Market Alert, should anything important (from the Precious Metals Investor's point of view) emerge.
This completes this week's Premium Update.
Thank you for using the Premium Service. Have a great and profitable week!
Sincerely,
Przemyslaw Radomski

