
The year 2010 was the year (in no special order of importance) when:
· Poland's leaders were killed in a plane crash on their way to Russia to observe the 70th anniversary of the Katyn massacres in which the Soviets murdered some 22,000 Polish officers and blamed the crimes on the Nazis,
- A group of 33 miners trapped for 69 days in a northern Chilean mine were dramatically rescued from the abyss,
- The war in Afghanistan continued into its ninth year with not much good news,
- The American combat mission in Iraq ended leaving behind a government in limbo,
- Greeks took to the streets to protest government austerity cuts after the European Union bailout,
- Facebook founder Mark Zuckerberg was named Time Magazine's Person of the Year,
- Frustrated American voters sent a message to Washington in the mid-term elections and put Republicans in charge of the House of Representatives,
- A leaking oil well gushed for three months fouling the Gulf of Mexico,
- A major earthquake struck Haiti leaving some 250,000 dead,
- The Shanghai exposition marked China's new economic power,
- A volcano with a rather unpronounceable name (Eyjafjallajokull) erupted in Iceland and brought air travel across Europe to a near standstill for almost a week,
- Julian Assange and his WikiLeaks embarrassed the powerful,
- Gold went up approximately 28% and silver approximately 80%.
It's instructive to look at the end of the year financial magazines and see their analysis of the past year and their projections for the future. For example, the special issue of Fortune Magazine Investor's Guide 2011 had a glimmering stack of gold coins on the cover with a headline “Gold Gone Wild.”
The article noted that people are rummaging through their dressers for gold jewelry to sell and that gold vending machines are selling out in Abu Dhabi and Germany. Exchange traded funds have made it easier for average people to invest in gold. More people have come to realize this year that gold is not just a commodity, but also a currency. The sole issuer of gold is Mother Nature and she follows a tightfisted policy. The article noted that all the gold ever mined would fill up fewer than four Olympic-size swimming pools.
As we all know, especially approaching the round of New Year's Eve parties, after an epic size binge comes an epic size hangover. The world is still reeling from an enormous headache caused by the real estate and subprime binge.
If 2008 was the year of the financial crisis, and 2009 was the year of the recovery and the introduction of the new catch phrase, “The New Normal,” then 2010 was marked by indecision—repeated rallies undone by fears over the sustainability of the economic recovery. Another catch phrase was “printing money out of thin air,” in reference to the Fed's quantitative easing. The term “currency wars” also made headlines, as did the term “sovereign debt.” The world's banking system had lived through the equivalent of wartime, a consequence of bankers who borrowed 50 times their capital to gamble on bad mortgages.
Things seemed stuck in 2010—the economy, Chilean miners, the accelerators of 2.3 million recalled Toyotas and 1.2 million European airline passengers stuck in airports by the eruption of the Icelandic volcano.
The Green shoots that Fed Chairman Ben Bernanke had promised never seemed to break through the hard ground. By May hopes for a quick recovery were dashed when the stock market tumbled 10 percent and unemployment did not improve, getting stuck at around 10 percent. The European Union bailed out Greece where workers retire at age 55, and in 2010, Irish eyes were not smiling. China's economy, by stark contrast, grew by an impressive 9.6 percent in the third quarter.
For ordinary Americans the rise of China is increasingly associated with job losses and a challenge to American wealth and power. During the more prosperous times there was a win-win world where the U.S. and the euro zone enjoyed prosperity and China, India and other emerging countries felt themselves getting richer. It is likely that 2011 will bring protectionism, anti-immigration sentiment and tensions in the European Union. There could be worsening relations between the U.S. and China over China's keeping the yuan undervalued against the dollar by as much as 40%.
In 2011, according to the Economist, investors will get a much clearer idea of the eventual outcome of the inflation/deflation dilemma. Either the economy will start returning to normal, in which case short-term interest rates will rise and the bond markets will suffer, or, it will become clear that the recovery is stalled and there will be talk of a Japan-like deflation. Governments will have to walk a tight-rope in 2011 trying to show enough budgetary austerity to reassure the markets without overdoing it and damaging their recovery.
According to the Economist, in 2011 currencies will take center stage and dominate the headlines. With countries trying to use exports as an engine to recovery it is hard to imagine any wanting to see their currency appreciating. China, under intense criticism for its undervalued yuan, did move to allow the yuan to rise against the dollar, an increase too small to be significant or satisfactory.
There is likely to be choppy trading in 2011 as countries try to keep the value of their currencies down with the possibility of growing protectionism.
Interestingly enough, the currency that went up the most against the dollar this year was the Mongolian Tugrik supported by the country's gold, copper and coal deposits.
Bloomberg Businessweek Magazine did an analysis of gasoline prices that rose 9 percent from late 2009 to 2010. The reason for the increase was that consumers had to pay for their gasoline with depreciating dollars. If you had to buy gasoline with euros there would be no change in the price. If you paid with gold, it would cost you 7 percent less, with silver, 26 percent less.
Also in 2011, the amount of maturing sovereign debt in the U.S and the euro zone will be even bigger than this year-- some $3.5 trillion, compared with $3.1 trillion, according to Bloomberg. Governments that have committed themselves to deficit reductions, Greece, Ireland, Great Britain, will be under close scrutiny. Writing in the Economist magazine, Pimco's Mohamed El Erian says the shrinkage in rich-country finance in 2011 will contrast sharply with an expansion of finance in emerging economics. According to him, financial institutions headquartered in emerging markets will gradually capture global market share.
One article in the Economist displays cautious optimism. In 2011 the US economy will surprise the pessimists and will grow faster than 3% and unemployment will fall to 9% and probably lower. Over time the head winds of consumers paying down debt will begin to fade. Already personal savings have risen to 6% of income from under 2% in 2005.
The one thing we can safely predict is that 2011 will be unpredictable. Let's hope for the best and at the same time be prepared for the worst by holding our physical gold and silver holdings intact.
To see how gold is performing towards the close of 2010 let's begin this week's technical part with the analysis of the Euro Index. We will start with the short-term chart (charts courtesy by http://stockcharts.com).
Euro - USD Indices
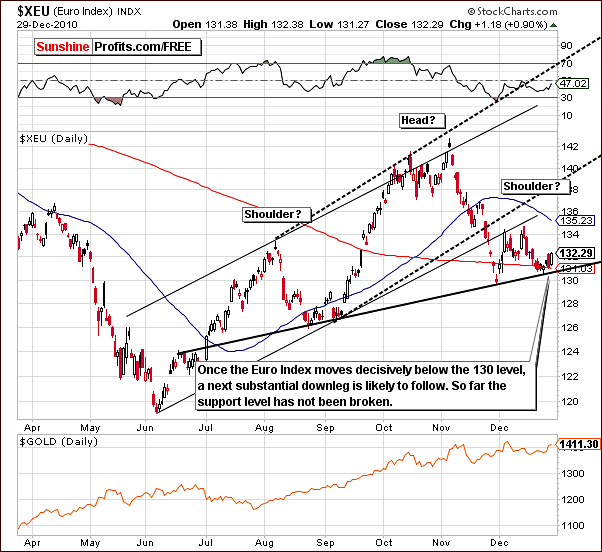
Last week we discussed the head and shoulders pattern and how its completion would likely bring the Euro Index level down close to 120, that is, close to the 2010 bottom level seen in June. This would have been quite positive for the USD Index.
At this point in time, the breakdown below the neck level of the formation is yet to be seen. Recent consolidation has taken place above this point and it might be the case that such a breakdown may not happen at all. Should this be the case, the very strong USD rally will likely be replaced by a continuous slide. This also coincides with several short-term resistance levels, mainly Fibonacci retracement levels based on previous rallies and declines.
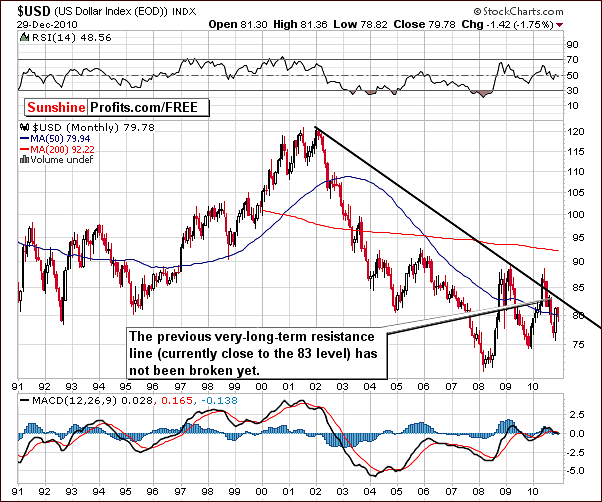
In this week’s long-term USD Index chart, we once again see that the index failed to move above the declining support line. And because of that any rally in the USD Index is still likely to be capped by this particular level.
The euro situation is only slightly bearish and therefore we hesitate to be overly bullish here with respect to the dollar. It does not seem warranted to make any conclusive calls at this time. A breakout is needed in order to clarify the likely near-term direction in the currency markets.
Speaking of breakouts, we did not see one in the USD Index either - so far the index is trading below the declining dashed line. Until such an action is seen, we should not bet on a rally to the 83 level. Instead, we could take into account the fact that the USD might not rally at all.
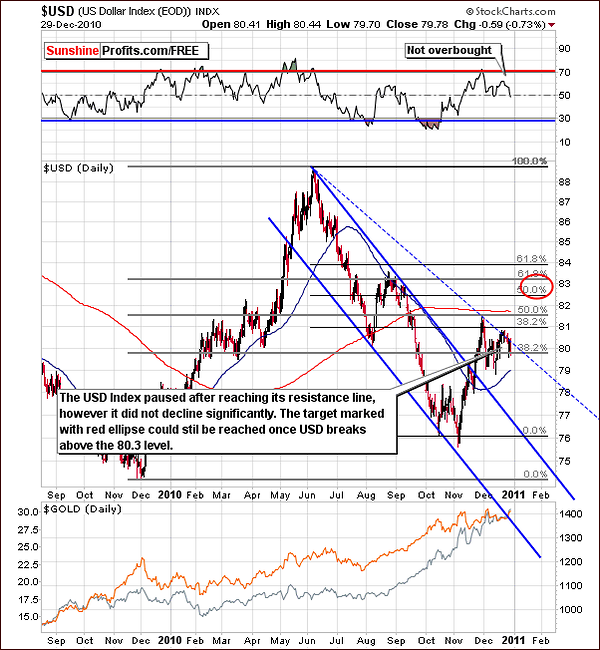
The implications for precious metals seem to be rather nonexistent at this point. They have recently moved higher during both: USD Index rallies as well as consolidation periods. A move lower from here in the USD Index would seem to be only slightly more bullish for gold, silver and mining stocks as opposed to a move up.
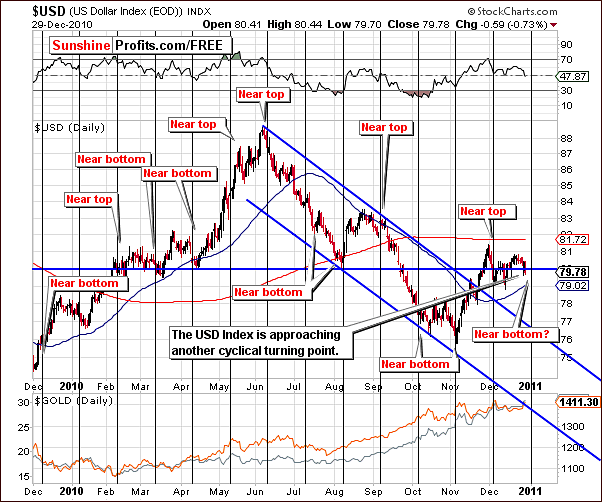
In this week’s short-term USD Index chart, we are approaching a cyclical turning point. Given that this may be a local bottom, a rally would be seen thereafter for the dollar. This could negatively impact gold, silver and mining stocks but this is not a certainty. There is a possibility that the precious metals sector may move along with the dollar, that is, to rally at the same time. This would furthermore have an additional profound (bullish) effect from a non-USD perspective.
Summing up, the situation for the dollar is rather unclear at this time. The USD Index is approaching a cyclical turning point, which appears slightly more likely to be a local bottom. Until a breakdown is seen in the Euro Index, it is unlikely that any breakout for significant gain will be seen in the USD Index.
Since the USD Index is close to a resistance level, the uncertainty of its next move should be removed soon. Either a decline or a breakout will likely be seen fairly soon and the likely implications upon precious metals will likely also become more easily read.
General Stock Market
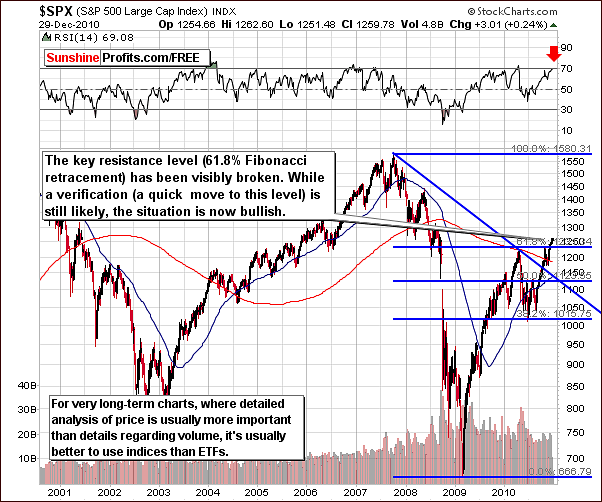
In this week’s very long-term S&P 500 chart, a breakout above the key retracement level from a previous 2010 high can finally be clearly seen.
With the RSI close to 70, that is, near the overbought area, it is likely that a consolidation will be seen rather sooner than later. Verification of the previous breakout is therefore quite likely. This would be a decline to the level of the previous high followed by an additional rally.
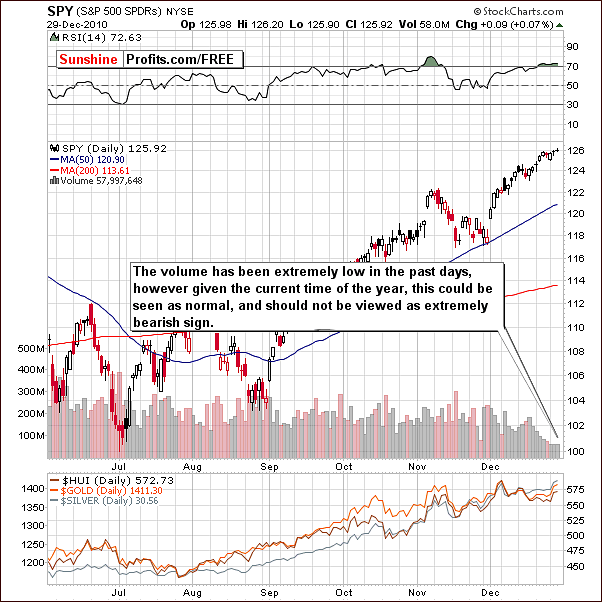
The short-term SPY ETF (proxy for the S&P 500 Index) this week provides us with details regarding volume. Even though volume levels have been low, this can be attributed to the holiday season (Investors and Traders are taking some time off). The general rule at this time of year is that average volume should be regarded as though it is high and low volume regarded as average. Therefore, the low volume levels seen recently are not bearish signs.
Summing up, the situation in the general stock market has turned slightly bullish. If and when the breakout above previous 2010 highs is verified and the 61.8% Fibonacci retracement level holds, great buying opportunities will be at hand for both stocks and precious metals.
Even though the economy is still rather weak, the stimulus money finds its way to the stock market, which helps push prices higher. This goes double for precious metals as investors find them particularly valuable during such inflationary periods.
Correlations
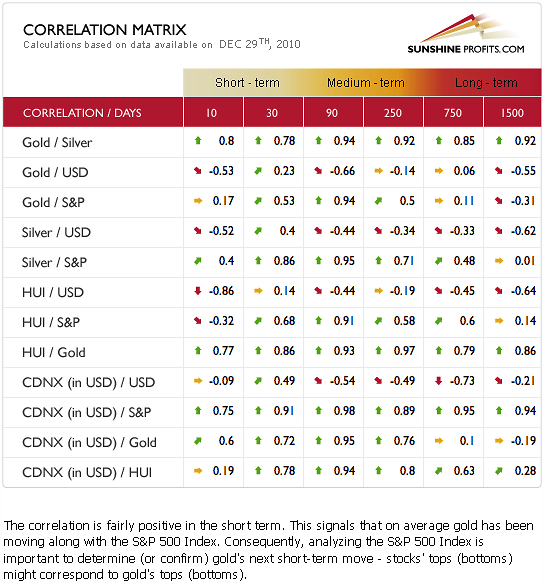
In this week’s Correlation Matrix, the situation remains quite similar to what we published last week. The coefficients between precious metals and stocks continue to weaken but are still significant. This means that for precious metals analysis, we must continue to take stocks into account. In addition, bullish sentiment for the general stock market likely implies the same for gold, silver and mining stocks. Consequently, it means that the fact that stocks are now visibly above their key support/resistance level is bullish also for precious metals.
The correlations with the dollar are mixed once again. The 10-day column indicates that the relationship between precious metals and the dollar is weakening further. Overall the influence from the currency sector upon precious metals is rather weak. It appears best at this time to independently analyze gold, silver and mining stocks and then check the correlation matrix. At this point, the implications from other markets are generally bullish for the precious metals sector.
Gold
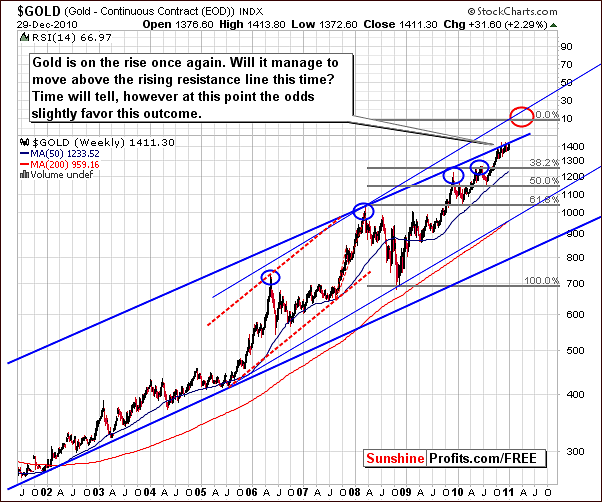
We begin this week’s gold section with the very long-term chart, which allows us to see the true significance of recent price moves. For some time, gold has attempted to break out above the upper border of the rising trend channel. Since October 5th, we have seen gold’s price waver between $1,340 and $1,423 with a general upward slope, often falling just a fraction below the ever-elusive rising trend line.
There are signs however, that such a breakout could be seen soon. Taking into account the historical pattern of gold being quite bullish at the onset of a new year, we are somewhat optimistic that it will rally and move above this resistance line sometime soon. The $1,600 target level seems realistic for the early part of 2011.
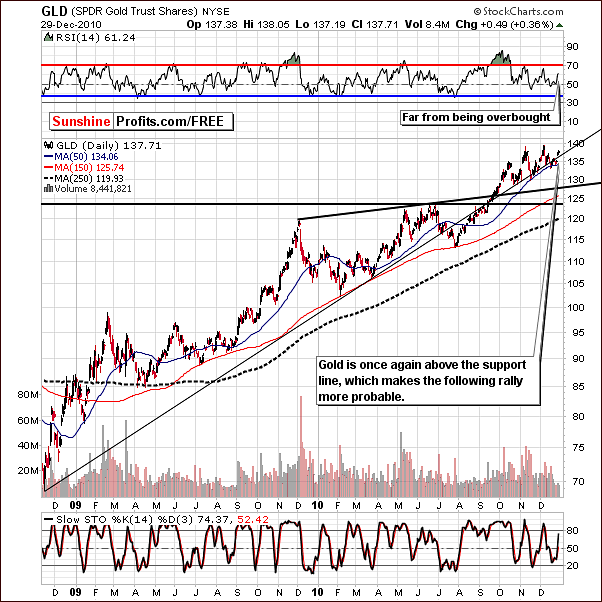
The long-term GLD ETF chart, which gives us a close look at current trends with respect to resistance and support levels, clearly shows how the rising line created from previous lows is now providing support. This is a bullish signal and with the RSI well below overbought levels indicates that further upward moves are quite likely from here.
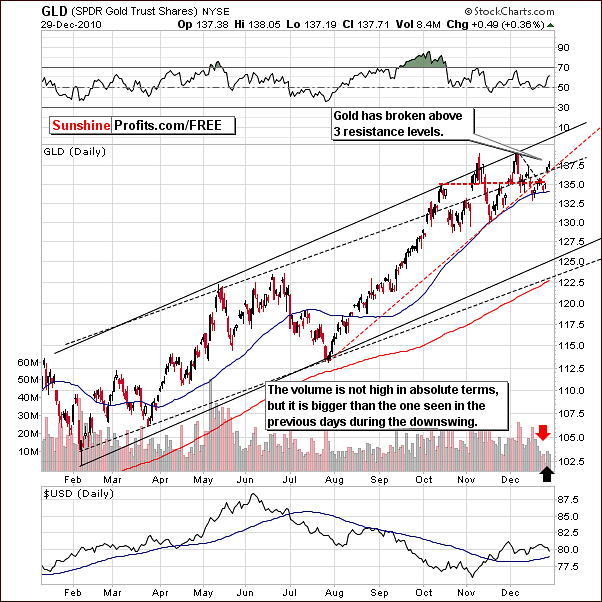
Our third chart provides a short-term view and here we can see that additional resistance lines have been broken and this has been done with rather significant volume as well. This is quite important and should not be ignored. Furthermore, such volume levels are significant on a relative basis and this is somewhat extraordinary for the holiday season. As mentioned in Wednesday’s Market Alert, this development is quite profound.
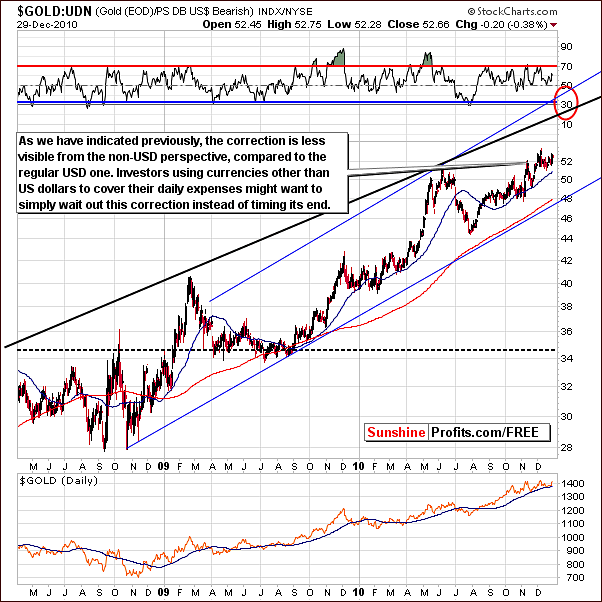
In this week’s gold:UDN ratio chart (gold seen from the non-USD perspective), we continue to see less volatility. This is a topic, which we mentioned in last week’s Premium Update and is commonly the case. It does, however, seem that if we see breakouts in both: USD Index and gold, then more volatility will likely be seen in the above chart.
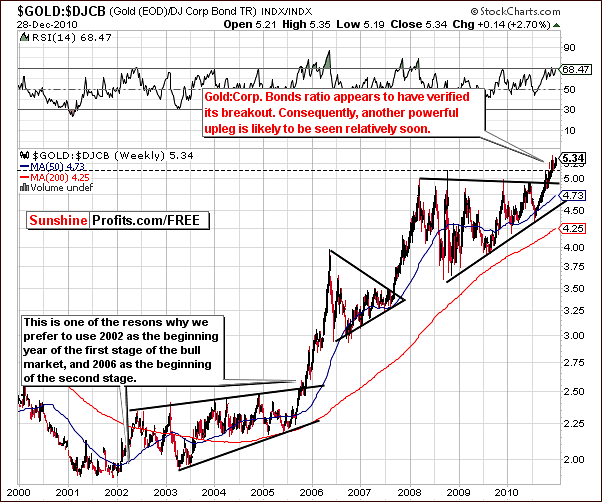
Our final gold chart this week features gold’s price relative to corporate bonds. This index level has broken above previous highs and indicates that a substantial rally is likely, just like it was the case in the past when the ratio has broken above its trading range. The breakout has been confirmed as the index level returned (declined) to the level of previous highs and then moved even higher. The signals here are clearly bullish.
Summing up, the situation for gold has changed significantly this week. We have moved from a slightly bearish sentiment to a bullish outlook for the near and medium term. As we have stated in the recent messages sent to you, the implication for Traders was to cancel shorts and possibly open small long speculative positions.
Silver
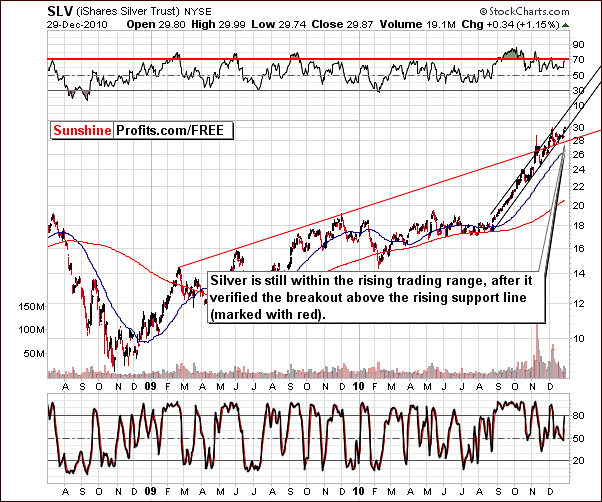
We now turn to silver, which was at a very critical point last week. It appears that silver took the exit to the upside.
On the long-term chart above, we can see that silver has remained above the lower border of the rising trend channel and also above the red resistance line created from two 2009 tops. Once again we have seen silver move higher this week and this current rally does indeed appear to have some strength. We expect it will continue for some time.
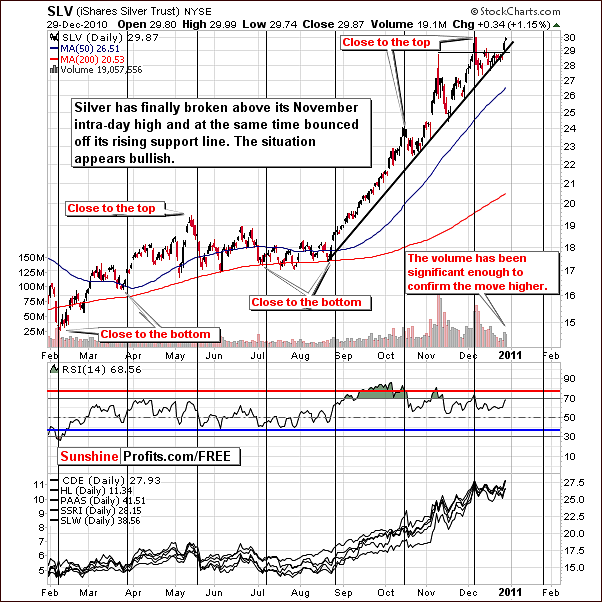
In the short-term chart, we see that silver has bounced off the support line and then it moved quickly above November intra-day high (marked with thin black line on the chart). This action is particularly significant because silver was consolidating below this high more most of the month.
Volumes level accompanying the move higher has been even more impressive than it was the case for gold. Here, the volume would be significant even if it wasn't adjusted for the fact that we currently have the final week of the year and the volume is traditionally low.
The final point that we would like to make while commenting on this chart is that we have adjusted our cyclical turning points so that they better reflect the current tendencies present on the silver market. As far as the nearest implications are concerned, it seems that it will be the second half of January when we will see the next local top for silver and other precious metals as well.
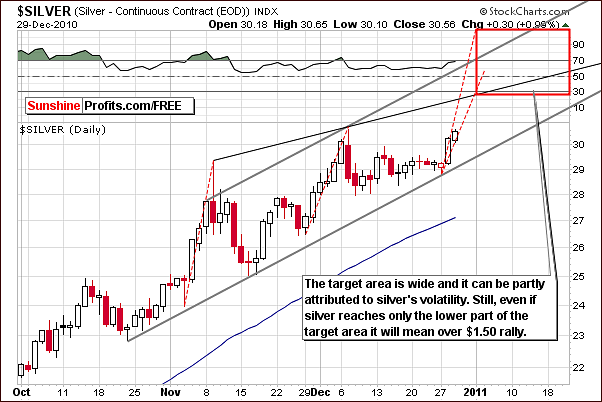
Turning to the very short-term chart, it seems that the white metal’s price could move well above the $31 level to the target area of the red rectangle in our chart. A significant move is likely based on previous volume levels and analysis of this week‘s technical signals. The target area is quite wide, however it doesn't change the fact that the rally that is likely to be seen soon appears to take silver at least $1.50 higher.
Summing up, the situation appears bullish for silver at this time. The white metal is likely to take out previous highs and further increases are likely based on current signals. At this time, it seems best for Investors to stay with current holdings and perhaps open small speculative long positions.
It could be the case that metals, especially silver, rise with the general stock market but then consolidate when stocks verify their breakout (as mentioned earlier in this update). Sunshine Profits will continue to monitor this situation and advise Subscribers accordingly.
Mining Stocks
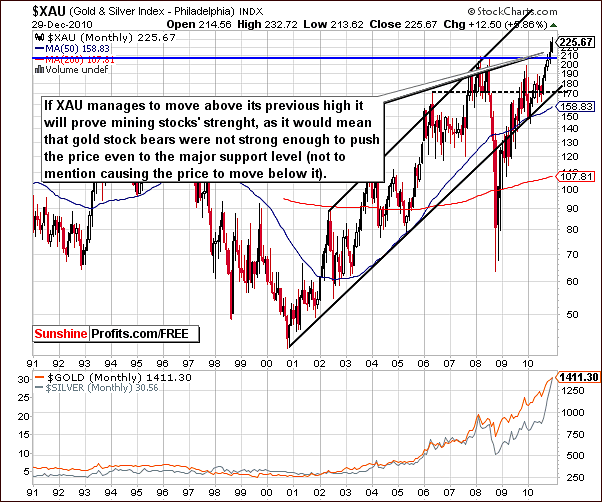
In this week’s XAU Index (proxy for gold and silver mining stocks) chart, note that index levels have moved back up without first moving below the level of the 2008 tops. This is a sign of particular strength. Anytime index levels decline and then reverse and move upward while staying above support levels, a bullish sentiment not only prevails - it manifests that the following rally could be huge.
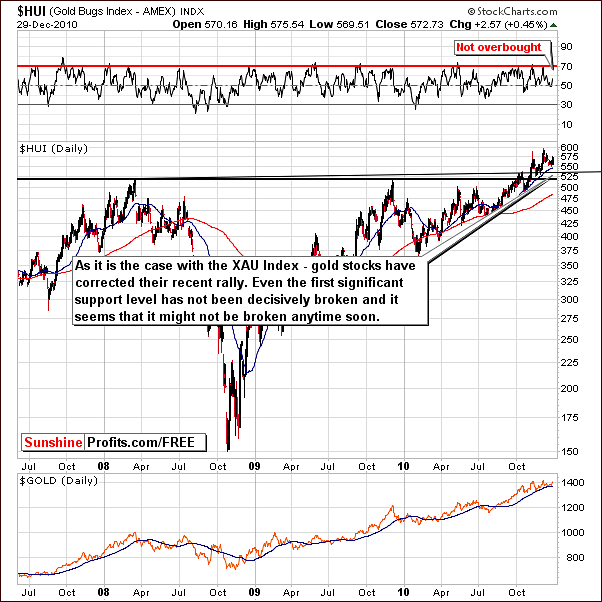
In the HUI Index chart, the correction is clearly visible. The recent breakout period has been confirmed twice (we've seen two declines to the previously broken highs and none of them managed to push prices below them) and is therefore verified. Mining stocks are likely to continue their recent uptrend.
Additionally, the RSI is not overbought nor is it close to this range. There surely appears to be room for additional rally from here.
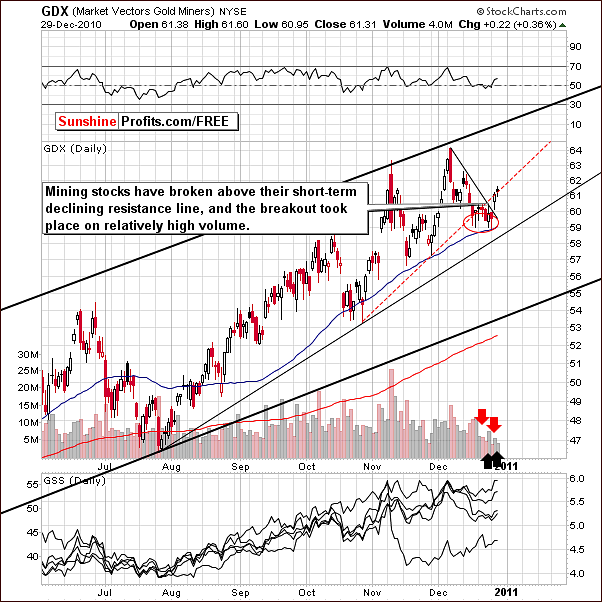
In this week’s GDX ETF short-term chart, which is a proxy for the mining stocks, note that a move above the rising resistance line (red) was not seen. Price levels, however, are above the declining resistance line (black) and volume levels have been higher on recent upward moves as compared to volume levels seen on declines. This is a bullish sign and indicates a possible rally from here.
Generally mining stocks have not been rallying to the extent of gold and silver in recent weeks. They have corrected about one half of their previous decline but have been underperforming. This could worry some Investors, so we decided to take a closer look on the situation and check if that is indeed a bearish signal. Let's take a look below for details.
Chart featuring HUI-Gold ratio - gold stocks' performance relative to the price of gold
Our final chart for the mining stocks section this week compares the performance of gold stocks with gold itself. Generally, the HUI Gold Stocks Index is influenced by both the general stock market and gold itself, so we've added the former in the lower part of the chart.
The red blocks indicate the times where gold stocks were underperforming gold and when it had no bearish implications whatsoever. If that was the case, we would not be able to find 4 situations which invalidate this thesis for just several months of data.
One could argue that mining stocks were influenced in one way or another by the general stock market, which caused it not to be reliable in the past, but it will be this time. However, taking a look at the performance of the ratio and the general stock market, we see that the ratio had no bearish effect on gold price no matter what happened in the main stock indices. In fact, we have seen stocks rally, decline and trade sideways in the areas marked with red blocks, but the underperformance of mining stocks relative to gold still failed to indicate a decline in gold.
Summing up, even though we have not seen a breakout above all resistance lines, it appears that a bullish sentiment can still be maintained for the mining stocks based on recent price action with respect to volume.
The final point to be made in this section is that gold’s rally will likely not be hurt by underperformance of the mining stocks.
Ratio Analysis
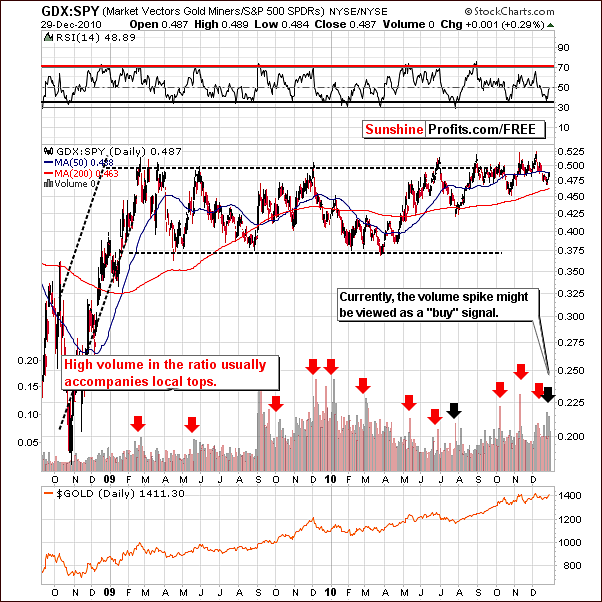
The GDX:SPY ratio appears to have flashed a buy signal. This is only the second time we have seen this. Normally the signal is to sell. The spike in volume, the local bottom, and the RSI close to 40 are all pointing towards an imminent rally and therefore a good time to buy.
Repeating what we stated in our message sent on Tuesday:
(…) However, there was an exception from that rule in late July. At that time, we notified you about the possible upturn in the market. That was based on the fact that the ratio itself has moved considerably lower, touching its 200-day moving average, and the RSI indicator based on this ratio moved below the 40 level. The 200-day moving average has not been touched yet, but it's very close, and other abovementioned signals are in place, so the normally-bearish signal appears bullish at this point.
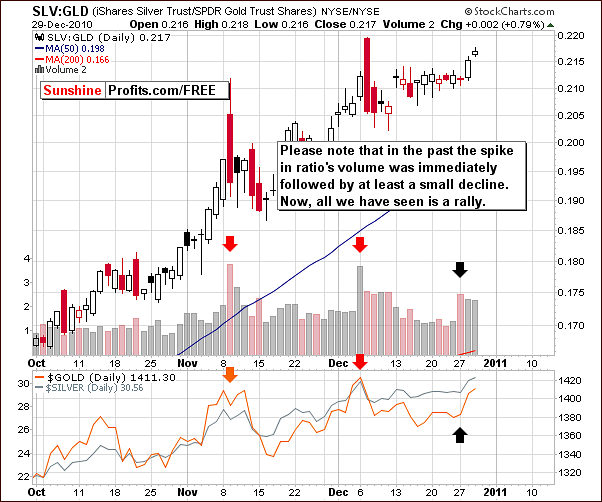
Another ratio that we've mentioned back then was the SLV:GLD ratio.
On Tuesday we wrote the following:
(...) the SLV:GLD ratio (another form of the popular gold:silver ratio) suggests lower prices - we've just seen a spike in volume for this ratio, precisely as it was the case at the November top and the one seen in early December. The implications are clearly bearish.
Please note that in the past, when spikes in volume have appeared for this ratio, that is silver’s volume was greater than gold’s, lower prices immediately followed. This time, however, gold and silver have both risen in price recently and this bearish sign is therefore invalidated.
Summing up, with bearish signs invalidated and bullish signs quite prevalent, it appears that the bullish case made earlier in this update, is being confirmed also by the analysis of ratios.
Letters from Subscribers
One of our Subscribers asked if it wouldn't be valuable if we added the analysis of copper to our reports. To some extent, it has been a part of our reports, however not directly.
We have commented on a similar issue in the past, please take a look below:
Generally yes, but what we would be looking for in copper is the "general stock market influence" in order to apply that to the analysis of silver market. It would be imperative to do so if we didn't have any other measures available. However, since we can analyze the main stock indices or even check volume trends through ETFs, we are not missing much information by analyzing them directly.
Should we see a clear divergence coming from the analysis of the copper market, we would include it, however that is not the case at this point as copper tracks the general stock market to a very big extent.
Summary
The situation for gold has changed significantly this week. We have moved from a slightly bearish sentiment to a bullish outlook for the near and medium term. The implications for investors this week were to cancel shorts and possibly open small long speculative positions.
Silver appears likely to take out previous highs and further increases are likely based on current signals. At this time, it seems best for investors to stay with current holdings and - again - perhaps open small speculative long positions.
An important development this week is the rebirth of optimism for the general stock market. Also, looking at the price moves and volume levels of the precious metals themselves yields apparent buy signals and these are confirmed in our ratio analysis. Since there are not yet sufficient confirming signs that the rally will indeed be seen, these positions should remain small for the time being. Further confirmations will likely reduce the risk factor, improve the risk-reward ratio and prompt Sunshine Profits to be more aggressive in suggestions concerning adding to the current speculative long position.
As always, we will let you know should the situation change and the abovementioned points are no longer up-to-date.
This completes the final Premium Update of 2010.
Thank you for using the Premium Service. Happy New Year to you and your families!
Sincerely,
Przemyslaw Radomski
PS. There was a small error in the previous update. In the closing paragraph of last week's report we included a quote from A Christmas Carol by Charles Dickens. The words that we quoted we're in fact not said by E. Scrooge, but by his nephew, Fred Holywell (thanks, Leo, for spotting that mistake). Again, all the best to you and your families in 2011!

