
Investing your money in a long-term position can be likened to navigating a ship to port. The compass (fundamental and technical analysis) points you in the right direction as you head out to sea. Even if your ship is sturdy (you have made the right call and are heading in the right direction) every once in a while a big, unexpected wave seems to push you off course.
And without question, since the beginning of the economic crisis, the seas have become especially turbulent.
One such wave was the announcement this Wednesday by the IMF that it would begin phased open-market sales of the remaining 191.3 tons of gold it plans to sell under a program launched last year to raise money for lending. The price of gold dropped 1 percent on the news.
To remind you, this comes nearly four months after India purchased 200 tons from the IMF, news that helped push the price of gold up. So what is the difference?
The IMF had announced last year that it would sell 403.3 tons of gold, about one-eighth of its total stock. Until now, the gold has been made available only to central banks on a first-come-first-serve basis. So far, India - the world's biggest consumer of gold - Mauritius and Sri Lanka have purchased a total of 212 tons of IMF gold. The average price for the three sales was a little over $1,050 an ounce, generating about $7.2 billion in proceeds.
In a carefully worded press release, the IMF said that "in accordance with the priority of avoiding disruption of the gold market, the on-market sales will be conducted in a phased manner over time."
The press release further noted that this does not preclude off-market sales directly to interested central banks.
It is well known that China is interested in increasing its gold reserves. China is sitting on top of a huge mountain of dollar reserves. In fact, a day before the IMF announcement, the US Treasury Department released data showing that Japan overtook China to become the world's biggest foreign holder of U.S. Treasury debt, reclaiming the title for the first time in more than a year. China shed more than $34 billion in long-and-short-term Treasury debt in December, while Japan added $11.5 billion, according to the monthly Treasury International Capital report.
So, it wouldn't surprise anyone if China steps in and buys some of the IMF gold. Perhaps, as was mentioned in last week's Premium Update, China is waiting for a better price.
We believe that the IMF announcement will have a negligible effect on the long-term price of gold. The IMF said it would stagger the sales. But even if it were to dump all the tons at once, it seems that they would be almost immediately absorbed by China, Russia, Middle Eastern sovereign funds and other central banks.
The IMF announcement also had a negative impact on the Euro, prompting purchases of the U.S. dollar against the commodity. The Euro was already in trouble because of the economic mayhem in Greece. A Wall Street Journal report this week posited that Greece's fiscal problem could spread to other parts of Europe. The WSJ said Wednesday that derivative contracts taken out by Italian municipalities could threaten local public finances for decades. This has given more credence to the speculation that Greece isn't the only fiscally embattled country in Europe and put a spotlight on the troubled economies of Portugal and Spain as well.
Nobel Prize winning economist Paul Krugman calls it the "Euromess." In his recent New York Times column, Krugman says that the main source of Europe's troubles is not just lack of fiscal discipline by some of its member states.
No, the real story behind the euromess lies not in the profligacy of politicians but in the arrogance of elites - specifically, the policy elites who pushed Europe into adopting a single currency well before the continent was ready for such an experiment, he says.
He cites as an example the case of Spain, which on the eve of the crisis had low debts, a budget surplus and exemplary bank regulation. Spain had experienced a huge housing boom due to its warm weather and beaches. But along with the rapid growth came significant price increases: between 2000 and 2008, the prices of goods and services produced in Spain rose by 35 percent, compared with a rise of only 10 percent in Germany. Thanks to rising costs, Spanish exports became increasingly uncompetitive, but job growth stayed strong thanks to the housing boom.
When the bubble burst, unemployment soared and the budget went into deep deficit. But now, according to Krugman, there is not much that Spain can do to make things better. Spain's core economic problem is that costs and prices have gotten out of line with those in the rest of Europe. If Spain still had its old currency, the peseta, it could solve the problem quickly through devaluation, says Krugman.
So the inflexibility of the Euro, not deficit spending, lies at the heart of the crisis, says Krugman...None of this should come as a big surprise. Long before the Euro came into being, economists warned that Europe wasn't ready for a single currency. But these warnings were ignored, and the crisis came.
While we don't necessarily endorse "flexibility" of the currency, which is another way to say that governments can use printing presses to "take care" of economic problems by stealing from people holding cash and its equivalents - the above does say something about the future of gold.
If the Euro is going to hell, and if the Dollar is no more than the best of a bad bunch, and if the Western world remains in economic trouble... Where will people turn for safety? The place where they always turned for safety throughout the history - the precious metals. We don't think we need a confirmation in the form of the news that George Soros charged into gold during the fourth quarter even despite the fact that gold prices had already run up substantially. He doubled the stake of his fund in the world's largest gold ETF, becoming the fourth- largest holder in the SPDR Gold Trust. As of December 31, gold is Soros's largest single investment.
Meanwhile, we have just seen Fed increasing the interest rates that banks pay for emergency loans. You may read the full story here. In short (quoting from Yahoo! Finance and adding additional comments):
The Federal Reserve decided Thursday to boost the rate banks pay for emergency loans. The action is part of a broader move to pull back the extraordinary aid it provided to fight the financial crisis.
The move won't directly [What difference does it make if it affects them directly or indirectly if at the end of the day they will have less cash in their wallets? Banks may ultimately increase their margins in order to offset this negative factor. Still, this isn't the point here, as mentioned in the following part of this weeks update - PR] affect borrowing costs for millions of Americans. But with the worst of the crisis over, it brings the Fed's main crisis lending program closer to normal.
The Fed decided to bump up the so-called "discount" lending rate by one-quarter point to 0.75 percent. The increase takes effect Friday.
The central bank said the action should not be viewed as a signal that it will soon boost interest rates for consumers and businesses. Record-low borrowing costs near zero are still needed to foster the recovery, it said. It repeated its pledge to keep interest rates at "exceptionally low" levels for an "extended period."
The Fed had signaled for weeks that an increase in the discount rate was coming. It portrayed its action Thursday as moving its emergency program for banks closer to normal.
In after-hours trading, the dollar strengthened on the expectation [expectation is an emotional phenomenon - it is based on one's perception of current events, which is highly influenced by emotions. Consequently, this tells us something about the market sentiment, not about the direction in which the U.S. Dollar is likely to head next - PR] of higher rates.
After the sell-off in stock futures, Pimco Managing Director Bill Gross warned investors not to overreact.
"I'd accept the Fed at its word -- that this isn't a change in monetary policy or in the timing of it," he said. "Calmer heads may prevail tomorrow."
[Agreed, this is just a 0.25 rate hike that affects directly only banks, and it doesn't seem like a big deal right now in terms of decreasing the disposable income of the U.S. Consumer. Conversely, it appears that this decision (which has been heralded for weeks, which means that it was discounted in the price anyway) was supposed to make everyone think go back to the "the crisis is over and everything's back to normal! Let's spend everything we can!" attitude. Please take a look at two first paragraphs of the quoted text once again with the above thought in mind. - PR]
(...)
The Fed has kept the target range for its main interest rate -- called the federal funds rate -- at between zero and 0.25 percent since December 2008. [No changes in the stuff that's really important, and the number that increased, did so by just 0.25. In other words, this is a big deal only taking into account the fact that there was no interest rate hike whatsoever for a long time and we have just seen one - that's it. It may appear that this is a beginning of a new approach toward interest rates, but we're having a hard time finding any evidence for it. - PR]
After the Fed's action Thursday, economists said they continued to believe it won't start to boost borrowing costs for Americans until later this year. Some don't think that will happen until next year, given the fragile economic recovery.
Chairman Ben Bernanke last week signaled the Fed is in no rush to boost rates. [...And we don't think that Mr. Bernanke has plans for increasing interest rates at this point given the fact that the main stock indices appear to have topped. Instead he is "reloading his guns" by increasing interest rates that are supposed to make one believe that the worst is over on one hand and on the other hand give him one more thing "to do" (to lower this rate) when things get uglier. - PR]
Summing up, it seems very doubtful that this increase will have any effect on any market - including the precious metals market.
Moving back to the analogy from the beginning of this update - we have set our course and we will keep a close eye on the charts to get us safely to port.
Let's begin with the gold market (charts courtesy of http://stockcharts.com.)
Gold
In the previous issue we wrote the following:
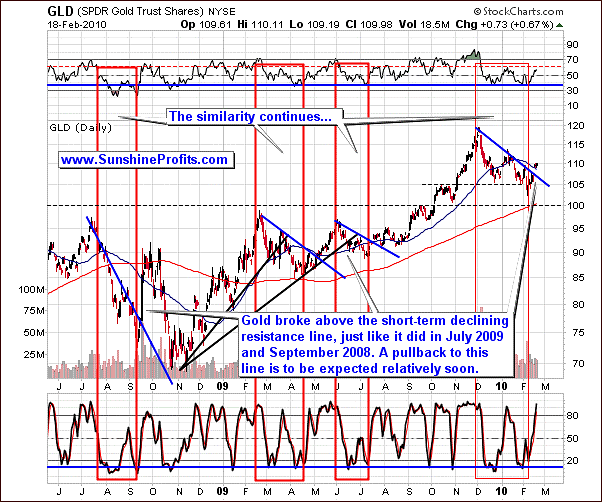
(...) we see that the similarity that was present during the latest decline is still present after gold bottomed. This time, however, it suggests that gold may soon need to consolidate for a week or so - just like it took place in the past. Please take a look at the areas marked with red rectangles - gold paused when it moved to the declining short-term resistance line (April 2009), or it broke above it and then verified it as support (October 2008, July 2009). Should history repeat once again, we can see a similar pattern also this time (...)
These comments are up-to-date also this week, only this time we already know that gold moved above the declining resistance line, just like it did in July 2009 and September 2008. This means that gold may need to form a temporary top here, which would take gold lower, most likely to the $105 - $107 area in the GLD ETF.
Is gold likely to have topped right now? Not necessarily, based on the situation in the RSI indicator. In the past this particular indicator needed to move to the level marked with the dashed red line before the temporary top was in. Currently, the RSI indicator is visibly below it, so we may see additional several days of higher prices before gold declines significantly.
The Stochastic indicator is above the 80 level, just like it was the case in the past during local tops, but it has also stayed there for some time before the top has been put, so it is a necessary factor, but not sufficient one. In other words, if Stochastic wasn't above 80 level, we would be reluctant to say that we may see a temporary top soon, but since it is above 80 it doesn't mean that the top is in.
Given the historical performance of the yellow metal, we might expect the consecutive decline to be rather small (the preceding downswing is not even close to being as dramatic as the 2008 one), so it seems that it is not much of an opportunity for shorting the precious metals market, unless we see a confirmation that general stock market's decline can cause PMs to plunge.
Let's move to the short-term chart for more details.
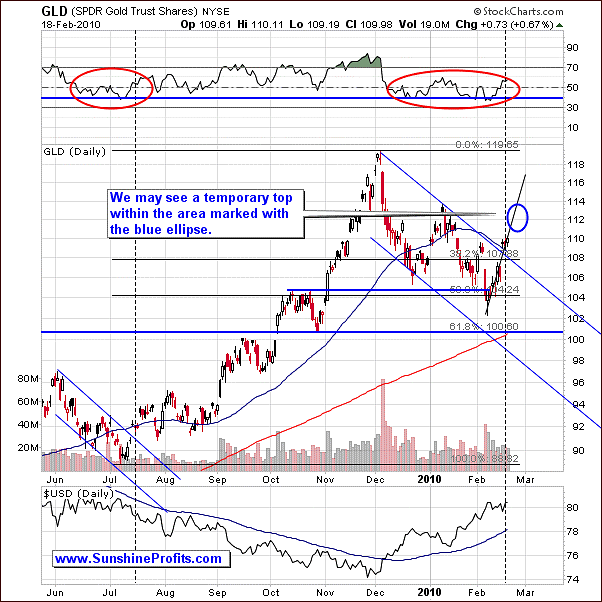
The analysis of the short-term chart suggests that the temporary top may be formed relatively soon. Two weeks ago we wrote the following:
The short-term chart provides us with additional information as it allows us to compare the current decline with the previous one. Naturally, the current decline is bigger than the previous one (about 2x bigger), but it is very similar given the 2:1 scale. The vertical dashed lines along with the areas marked with red ellipses help to understand where are we now with regard to the June - July decline.
Additionally, we provide you with the dashed vertical line, which helps you see this where we are now according to the historical extrapolation. Consequently, the price of gold is likely to put in a temporary top and decline modestly - just like it was the case in July 2009.
Gold consolidated briefly around the $92 level, which at that time corresponded to the 50-day moving average. Please note that gold is currently also very close to the 50-day moving average (the blue slope on the chart). Keeping in mind the whole analogy, and the way price of gold / volume shaped in the past it seems that gold will need to move a little higher (to the area marked with blue ellipse) before topping. Once it does form a top, it is likely to move to the previous resistance level ($105 - $107 in the GLD ETF), thus verifying the previous resistance level as support - as was the case in the past.
Silver
Two weeks ago we mentioned that "the RSI and Stochastic indicators suggest that the price of silver is likely to reverse soon, but these indicators are based on price alone - they don't take the volume factor into account." This is relevant also today, as the volume during the upswing that we've seen in the past few days, is not really impressive.
In the latest Premium Update we wrote the following:
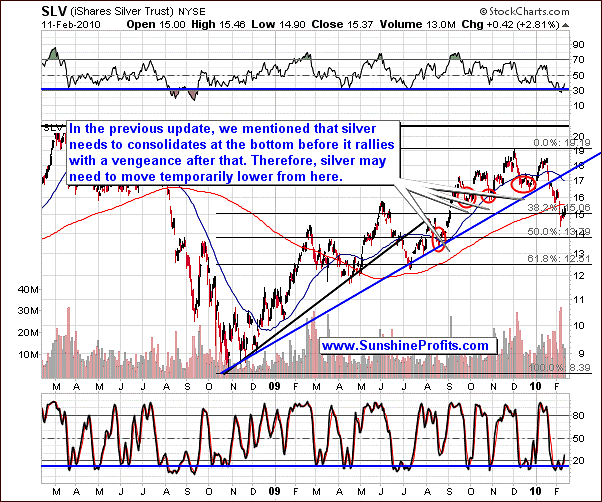
(...) it may seem strange that silver (the SLV ETF) is currently hovering around $15 instead of rallying strongly. However, taking a second look at the above chart reveals that this is the way that silver used to behave shortly after it had bottomed. We've marked these situations with red ellipses. Please note that if that pattern is to repeat itself once again, silver may move much higher soon.
This is the case also today, as the SLV ETF around $15 is not really much higher than it was when the latest bottom was formed and the volume during upswings is relatively low. Instead of rallying, silver is more or less trading sideways and moving insignificantly higher. Still this is a normal behavior for silver during the bottoming process, and it confirms that the last chance to get back on the long side of the market is not behind us.
The Stochastic indicator has formed a double bottom, which in the past signaled that the bottom is in. But let's not forget that it moved very briefly lower at the end of December 2009, when silver declined as well - back then it meant the final downswing before the $1+ rally.
The RSI indicator moved below the 30 level and bounced, but this is not necessarily a sign that the ultimate bottom is in. The historical high correlation between silver and the general stock market suggests that caution is still warranted.

The short-term silver chart reveals that silver does indeed confirm that at least a brief correction is likely from here. Please take a look at the April 2009, July 2009, and November 2009 bottoms - once the bottom was put in around the date suggested by the red vertical line (as was the case recently), in silver corrected at least briefly before rallying significantly. Should that be the case also today, one might expect silver to move lower relatively soon.
Additionally, please take a look at the pace of growth of the price of silver since its early-February bottom. Should it be sustained it would move to the next strong resistance level very quickly and put in a temporary top much before the cyclical tendencies suggest.
Of course, it is possible that the resistance level marked with the blue declining line doesn't hold silver and it will move much higher without stopping at $17.5 - $18, however we don't find that outcome very likely. Instead, we see silver consolidating at least for a while, and reaching a temporary top within a month or so.
Moving on to the analysis of the precious metals stocks, let's begin with the long-term HUI Index chart.
Precious Metals Market
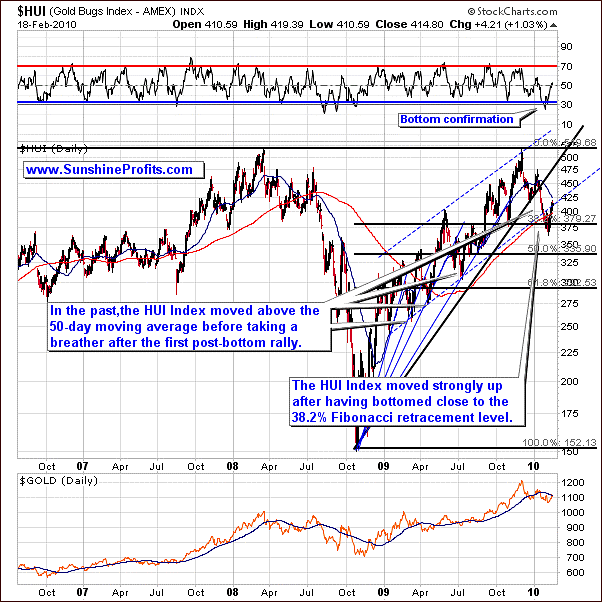
The analysis of the long-term HUI chart suggests that gold stocks may need to move a little higher before forming a temporary top. In the past, local tops have been formed after HUI Index moved above the 50-day moving average which hasn't been the case yet.
Short-term chart provides us with more details
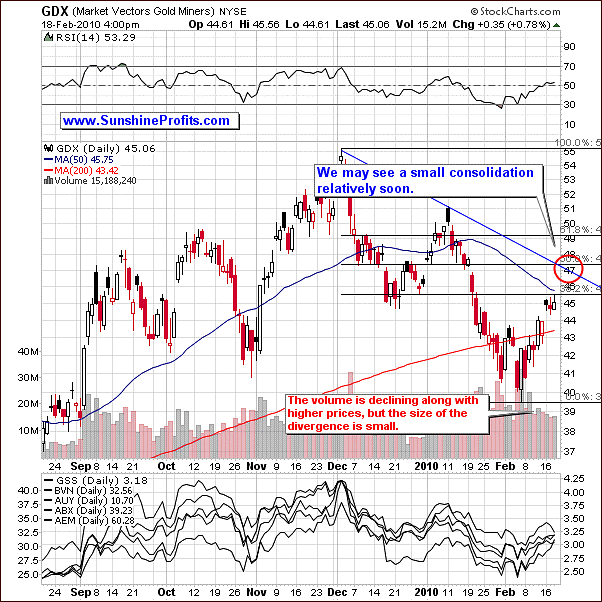
The above picture provides us with a short-term target for the current rally - marked with red ellipse on the chart. The $46 - $47.5 area is clearly above the 50-day moving average (blue slope on the chart), and it contains two important resistance levels - the declining blue resistance line, and the 50% retracement of the December - February decline.
Given the strength of the current rally and the previous performance of PM stocks after the bottom, it seems that the coming correction is likely to be relatively small. Naturally, that is the case if the general stock market doesn't begin a massive plunge soon.
Speaking of the general stock market and its influence of the prices of precious metals, please take a look at the current version of the correlation matrix.
Correlations
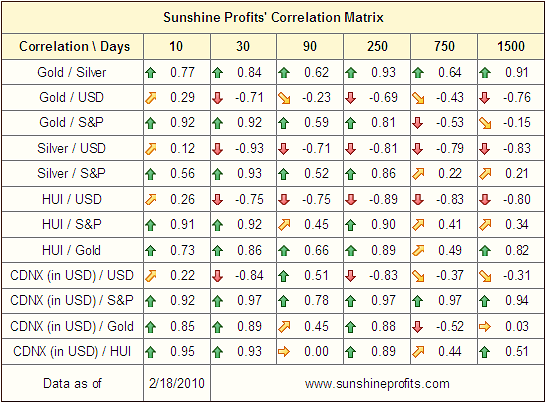
The above numbers don't look too encouraging for precious metals bulls given the situation on the general stock market. In the previous Premium Update we wrote the following:
An interesting fact is that the very-short-term (based on just 10 trading days) the HUI Index will be more strongly influenced by the general stock market than it will be by gold. In other words, during the last 10 trading days, gold stocks were more closely following main stock indices than they were following gold.
Not only is this tendency still present, but it is also much more visible in other parts of the precious metals market. The correlation coefficients for S&P and gold, silver, and juniors are currently very strong. This means that if we don't see signs of a disconnection between these markets in the coming weeks, it will become much more likely that the next medium-term (months) move will be down, not up.
For now, we are waiting for a disconnection between the main stock indices and the USD Index, to estimate which of these markets PMs are likely to follow next. We wrote about this phenomenon two weeks ago, but since it is relevant also today, we quote a part of the previous update below:
(...) we have to wait for additional signals of confirmation for either of the two scenarios (general stock market plunges along with PMs or without them). So far both markets have been declining together.
The first thing to monitor is the way PMs react to changes in the value of the main stock indices - especially gold, because silver and PM stocks are historically more correlated with the general stock market (silver's industrial uses etc.), so high correlation here is not much of a divergence. If PMs trade very much in tune with the general stock market during both upswings and downswings and we don't have identical moves in the USD Index (as we will see in the main stock indices - but in the opposite direction), then PMs may be in trouble.
If, on the other hand, PMs stop declining or even rise modestly along with falling main stock indices, it will mean that even more declines should not cause serious damage to the PM market.
Additionally, if we see the USD Index move higher and PMs refuse to move lower, it will give us a "probably the bottom is in" signal. The above mentioned phenomena should be visible for at least several days before we can make decisive calls.
Unfortunately, if the USD Index and the main stock indices trade in tune (but in the opposite directions) - meaning highly correlated, then the above mentioned technique won't work. Should this be the case, and suddenly this correlation (between USD and the general stock market) disappears, then the market which PMs follow in the next several days after this "disconnection" is likely to be the market leading the metals in the coming weeks.
The phenomenon mentioned in the last paragraph is what we've seen very recently. USD Index and the general stock market move in tune, so it is impossible to tell which of them actually drives PMs. We will have more information once we see some kind of divergence, such as the U.S. dollar topping and the general stock market continuing to slide. Speaking of the former, let's take a look at the chart of the USD Index.
The situation is becoming more and more difficult each day, because the general stock market doesn't appear to have bottomed, which means that each day we are getting closer to the next downleg. On the other hand we didn't get the above mentioned confirmation so far, which means that it is not certain which actions should the long-term Precious Metals Investors take if/when the general stock market declines. If PMs are to follow the main stock indices, then it seems it would be a good idea to limit one's exposure to metals for a few months or so. On the other hand, if PMs prove to hold well despite weakness on the general stock market it will indicate that gold and silver are a strong buy at the moment.
Therefore, monitoring this correlation is one of the most important things that PM Investors need to focus on. Naturally, we will keep you updated.
Moving on to the analysis of the general stock market, let's begin with the long-term chart.
General Stock Market
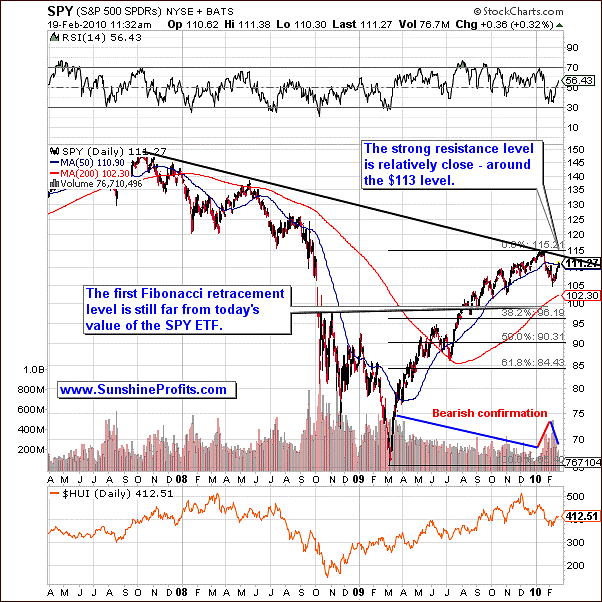
There are no big changes on the long-term chart of the SPY ETF since we wrote about it last week. The values of the main stock indices are rising, but the volume doesn't confirm that direction - it is declining, which suggests that this is just a consolidation within a bigger move lower. Either way, it seems that the rise of the general stock market will be stopped relatively soon, as it is relatively close to the strong resistance level (black declining line on the chart based on three key tops).
Let's turn to short-term chart for more timing details.
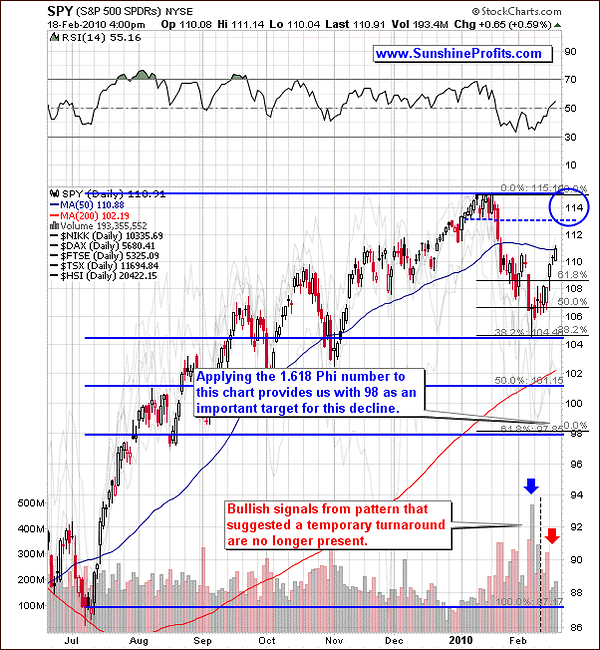
The above mentioned resistance level ($113) appears important also from the short-term point of view. In fact, it already proved to be a support level in the first half of the January. Additionally, it is very close to the middle of the big bearish candlestick (Jan 21st), which by itself (middle of the big candlestick) is also a support/resistance level.
Should the value of the SPY ETF move above that level, it is very likely to stop at its previous high of $115. We wouldn't recommend trading this move up from here in the main stock indices because the action in volume (the divergence caused by the fact that it is declining along with higher prices) is much more visible than it is the case in the GDX ETF.
Again, we believe that it is not really the time/price of the top in the general stock market that is the most important thing to focus on - that is the way the precious metals market reacts to changes in the main stock indices.
USD Index
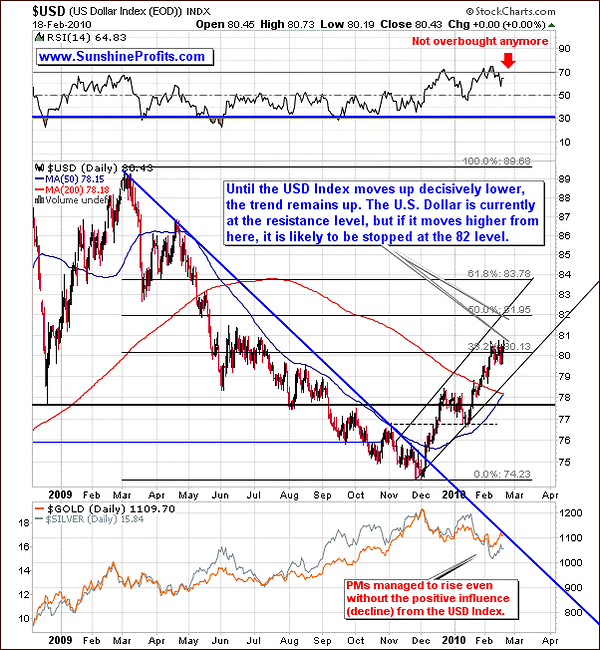
The situation on the above chart is virtually exactly the same as it was the case a week ago.
Silver and gold managed to rise without the positive influence from the dollar, which is generally a bullish sign. Moreover, it suggests that PMs may move higher even if the USD Index rallies as well. Just a few days of data are not enough to get overly excited about this phenomenon (that's why our Correlation Matrix doesn't reflect that), but it serves as a subtle clue that if we saw another upleg in the USD Index we would not need to be very afraid that PMs would tumble dramatically.
PMs continued to show strength despite the fact that USD Index did not tumble. Still, this is not really encouraging piece of news, because it is a small indication that PMs are following the general stock market more than they are following the U.S. Dollar.
Let's take a look at the short-term chart for details.
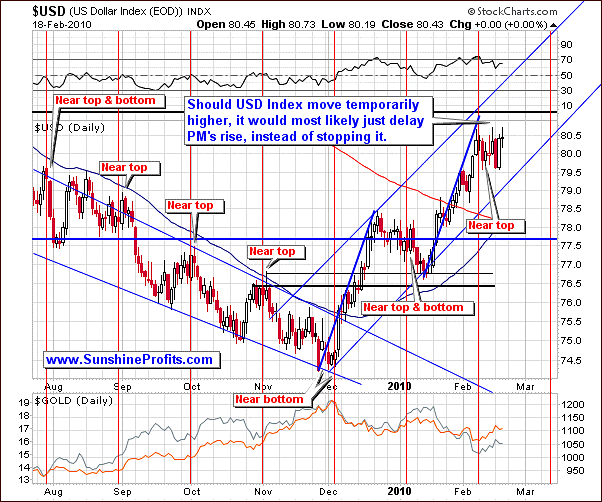
Once again, there are virtually no changes on the above chart. The additional information that we can infer by analyzing it is that the USD Index is likely to form a top or a bottom in the second week of March.
There are not many clues on the USD chart this week, but given the fact that PMs have been rising even without a positive impact from the declining USD, gold and silver Investors don't need to worry about the dollar's impact.
The last chart that we would like to feature this week is the one featuring one of our own indicators - the SP Gold Bottom Indicator
The Sunshine Profits Gold Bottom Indicator
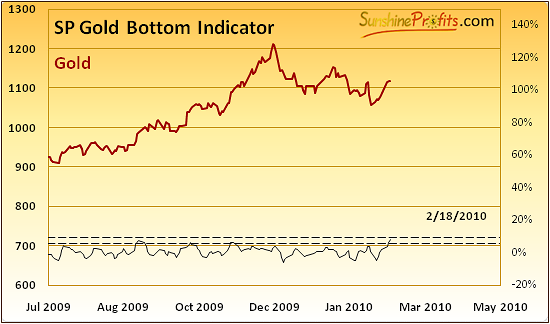
According to its name, the above indicator provides buy signals for gold. The buy signal is given, when indicator breaks down below the dashed line, or when it breaks up through the upper dashed line. Since it has just moved above the lower line, it means that it will move below it sooner or later, most likely during the coming small correction, thus generating a buy signal.
Juniors
Although it is the first Premium Update of the month (when we update our top junior rankings), there is one thing that we would like to comment on regarding the junior sector. This week we received e-mail from one of our Subscribers, who asked if juniors producing gold that are turning profits are also likely to decline along with the general stock market. We would like to share our reply with other Subscribers as well.
Generally, in our opinion all juniors are vulnerable to the negative influence from the general stock market. The less advanced the company is in its development, the bigger influence the general stock market may have on the value of the stock, as it is the "hope" for future profits that drives the demand for the stock rather than estimations based on the price of gold that this company can mine. On the other hand, if the general stock market does indeed plunge, it will provide a critical "stress test" for all junior companies, which will help us to verify our views on particular stocks. The stocks that hold up well will be poised to outperform once the situation gets better.
Therefore, we still believe it is a good idea not to be heavily invested in the junior sector at this point due to its very high correlation with the main stock indices.
Summary
The precious metals market has moved higher, and it appears that it will need to take a small breather relatively soon. Gold, silver, and PM stocks are currently following the general stock market more closely than they follow the USD Index. This is a positive factor in the very-short-term, as it provides an additional signal for short-term Speculators.
Namely, it means exiting long positions in PMs when the SPY ETF gets near $113, GDX gets near $47 or when GLD goes near $111.) Still, we wouldn't open short positions in metals at that point.
On the other hand, this factor is negative in the long run because the situation on the general stock market is still bearish from the long-term point of view. Therefore, if you already own physical gold/silver, and you want to add to your positions, you may want to wait for additional information. If you don't have any at this point, we would still suggest buying some (25% or so of what you would like to own.)
Meanwhile, one of our unique indicators is about to flash a buy signal. This is positive news for the whole precious metals market, not only for gold itself, but we still need to monitor the situation on the general stock market and check how gold corresponds. Several days of divergence between PMs and the main stock indices will most likely be enough to let us know that PMs are ready to rise once again. For now, we must remain cautious. Naturally, we will keep you updated.
This completes this week's Premium Update.
Thank you for using the Premium Service. Have a great weekend and a profitable week!
Sincerely,
Przemyslaw Radomski

