
If you didn't receive any message from us today (including the notification e-mail about this update), it is due to our recent change of the IP address, and the fact that it doesn't have the "e-mail sending history" yet. This caused many e-mail service providers to block our messages. The reputation of this IP address was good, and we were unable to check in advance that this problem will occur. We are working on this issue and we do everything we can to "fix" this situation as soon as possible. We apologize for the inconvenience.
In order to make sure that you receive messages from us please add us ([email protected]) to your address book / "safe sender list", and alternatively subscribe to our RSS feed (you can receive additional notifications - it is possible to receive them to your e-mail).
---------------
The World Gold Council this week released their 2009 Gold Demand Trends report and embedded in the statistics were a few tidbits we found interesting.
Overall investment in gold was 7% higher in 2009 than 2008. This is significant when you take into account that demand in the fourth quarter of 2008, during one of the worst financial meltdowns we have ever known, was so great that there were global shortages of physical metal. Nevertheless, in 2009, at a time when fears of a global financial disaster have abated somewhat, investors still bought more gold than in 2008. In other words, more gold was purchased at higher prices when the markets were less terrifying, than when the prices were lower and fear was at its zenith.
China was the only non-western country to record positive growth in net retail investment during 2009. ETF demand in 2009 was 85% higher than the previous year, while bar hoarding, largely from the non-western markets, experienced a significant decline.
The Gold council believes that regardless of whether the economic recovery gathers steam or stumbles, western investment demand will remain "well supported." If the global economy falters, investors will flock to gold. Conversely, if the recovery gathers momentum, inflation will come into play, and with it rising gold prices.
So which will it be? Will the economic recovery gather momentum or will it stumble? We don't need a peak at the 2010 Gold Council report, which will come out a year from today, to know that the trajectory for gold prices is up.
For one thing, western governments have not stopped the fiat currencies printing presses from working 24/7.
We've recently read something that can elucidate the enormous, almost incomprehensible, size of the U.S. government debt. The numbers are so huge that it is difficult for most people to get a handle them.
If you had spend $1 million each day from the time of the establishment of the ancient city of Rome-about 2,700 years ago-until today, you would have accumulated about $1 trillion in debt. But hold on. You would have to double that figure to get to the $2 trillion in foreign debt that must be repaid or refinanced each year by the U.S. government, a feat accomplished in only a few short years.
It doesn't take a genius in economics to understand that when you print ever-increasing supply of fiat currency, it will inevitably lose its value.
Even currency that is composed of a precious metal will lose its value if there is too much of it in circulation. For example, after the discovery of silver in Peru by the Spanish conquistadors, silver began to flow to a European continent starved for the white metal. Convoys of hundreds of Spanish ships transported 170 tons of silver a year across the Atlantic. But the Spanish monarchy had dug up so much silver that the metal itself declined dramatically in its purchasing power.
Niall Ferguson, in his excellent book, The Ascent of Money, put it best.
"What the Spaniards had failed to understand is that the value of precious metal is not absolute. Money is worth only what some one else is willing to give you for it. An increase in its supply will not make a society richer, though it may enrich the government that monopolizes the production of money. Other things being equal, monetary expansion will merely make prices higher."
The problems facing America are not only on the federal level. There is deep trouble brewing, even bubbling over, on the state level as well, and let's keep in mind that states cannot print their way out of the hole. Already a few states that had imprudent policies and excessive spending are the proverbial canaries in the coal mine. Some of them are in worse financial shape than Greece.
A few weeks ago the newly-elected governor of New Jersey, Chris Christie, had the fortitude to tell his constituents the truth. Here is what he said in his State of the State address.
Today, we come to terms with the fact that we cannot spend money on everything we want. Today, the days of Alice in Wonderland budgeting (must) end. That means making some tough choices. It means tightening our belts.
Christie explained that overly generous union contracts for state employees, negotiated by previous profligate administrations, are putting an impossible burden on today's tax payers. He gave the example of a retired state employee who paid over the course of his entire career a total of $124,000 towards his retirement pension and health benefits. The state of New Jersey will end up paying him $3.3 million in pension payments over his life and nearly $500,000 for health care benefits, a total of $3.8 million on a $120,000 investment. That's like winning the lottery.
"What has been done to our citizens by offering a pension system we cannot afford and health benefits that are 41% more expensive than the average fortune 500 company's costs is the truly unfair part of this equation," said the governor.
As much as 91% of Illinois' total debt is due to pensions and retiree health care. In a website called http://www.illinoisisbroke.com/ someone figured that Illinois' debt comes to $25,000 per household in the state.
California Governor Arnold Schwarzenegger said in his final State of the State address last month that due to the public employee pension crisis California is about to get run over by a train.
"The cost for state employee pensions is up 2,000 percent in the last ten years, while revenues have only increased 24 percent. The pension fund will not have enough money to cover this amount, so the state-that means the taxpayer-has to come up with the money.
We cannot break the promises we already made. It is a done deal. But we are about to get run over by a locomotive. We can see the light coming at us."
At Sunshine Profits we have also strived to "see the light" and have been consistently suggesting buying gold at each buying opportunity.
Let's begin this week's analysis by analyzing the situation on the general stock market and the USD Index, as it is once again the case that these markets play the key role for the metals market (charts courtesy of http://stockcharts.com.)
USD Index
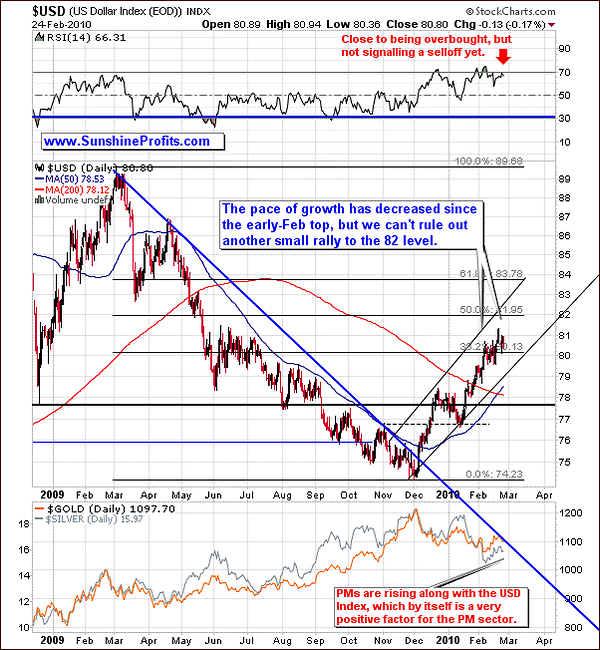
The long-term USD Index chart didn't change much since the previous week.
Silver and gold managed to rise without the positive influence from the dollar, which is generally a bullish sign. Moreover, it suggests that PMs may move higher even if the USD Index rallies as well. Just a few days of data are not enough to get overly excited about this phenomenon (that's why our Correlation Matrix doesn't reflect that), but it serves as a subtle clue that if we saw another upleg in the USD Index we would not need to be very afraid that PMs would tumble dramatically.
PMs continued to show strength despite the fact that USD Index did not tumble. This is positive for the precious metals, especially that this phenomenon has been visible for a few weeks now.
Since the correlation between USD Index and the precious metals market has been decreasing lately, further strength in the U.S. Dollar does not have to automatically translate into lower prices of gold and silver.
Generally, if PMs are able to rise even along with higher values of the USD Index, it usually means that the sentiment is very positive for metals, and once USD finally declines, PMs are to soar.
This time, however, we need to consider the fact that gold is trading very closely with the main stock indices, which were moving higher during the past several days.
The analysis of volume (of the UUP ETF which is a proxy for the USD Index) confirms the abovementioned point.
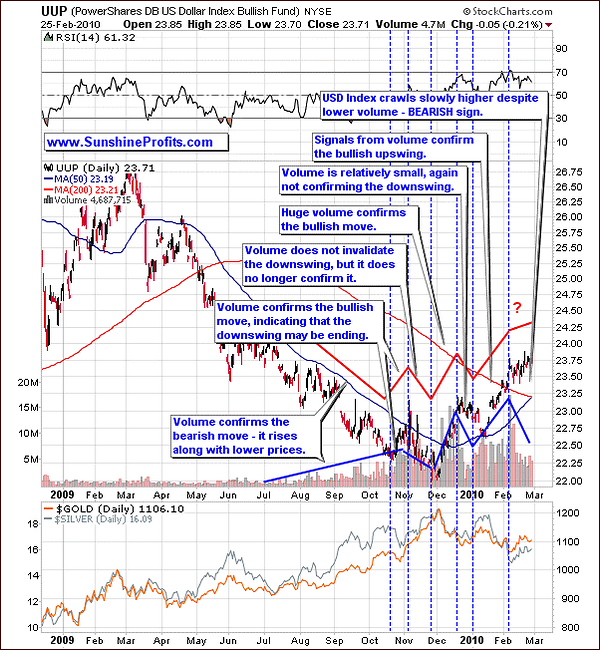
The USD Index crawls slowly higher despite lower volume, which is a bearish sign for the U.S. Dollar, and bullish for the precious metals (after all, PMs are priced in dollars.),
Let's take a look at the short-term chart for more details.
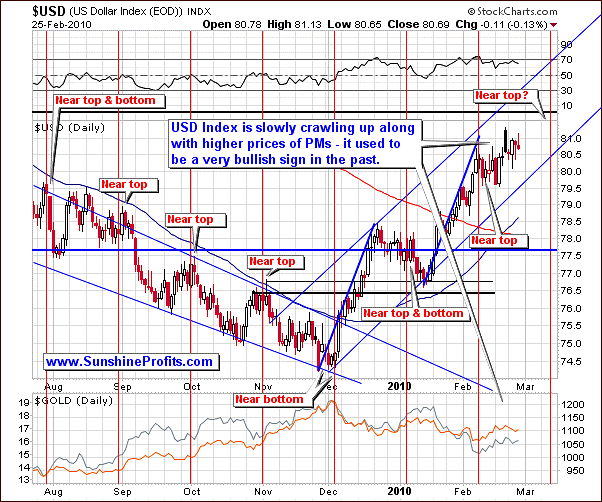
The graph above clearly shows the close relationship between the USD and precious metals. However, recent blows to the European economy (Greece) have created some uncertainties to their unusual coupling, because of the structure of the USD Index. After all, this index is a trade-weighted average of 6 currency exchange rates, and the weight for the Euro is 57.6%.
Should the cyclicality present on this market once again successfully provide us with a turning point, we could see it around the second week of March.
General Stock Market
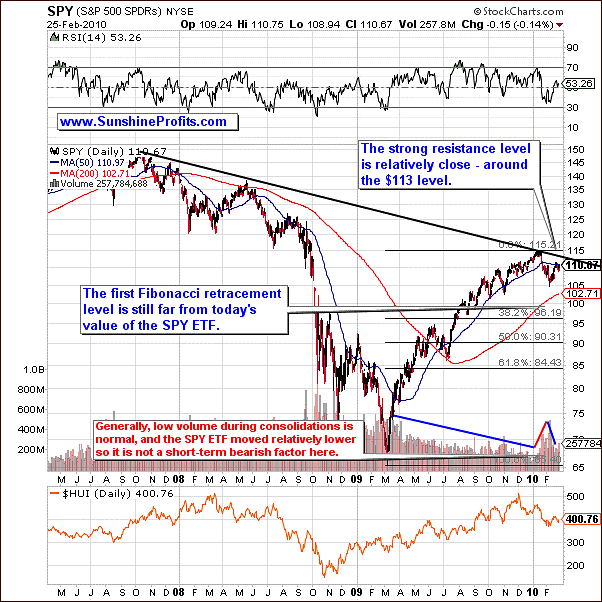
As mentioned in the previous updates, the SPY may have already reached the peak of a brief bullish trend, as the $113 level mark is a strong resistance level. Moreover, current values for the SPY ETF still have a long way to go to reach the first Fibonacci retracement level and (as mentioned in the Feb 12th update) it is likely for it to retrace back to this level or move even lower.
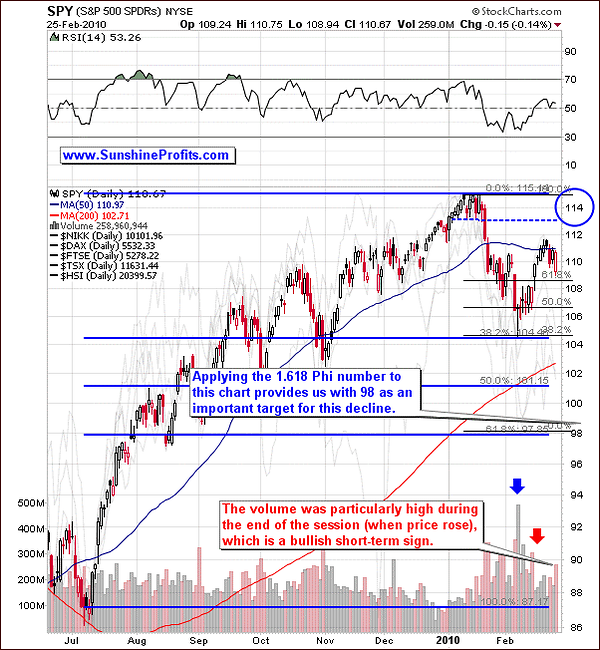
The short-term chart reveals that the current rally may not be over at this point. The volume during yesterday's session was particularly high during the upswing, which is a bullish short-term signal. This means that the SPY ETF is likely to move temporarily higher before declining once again.
Correlation Matrix
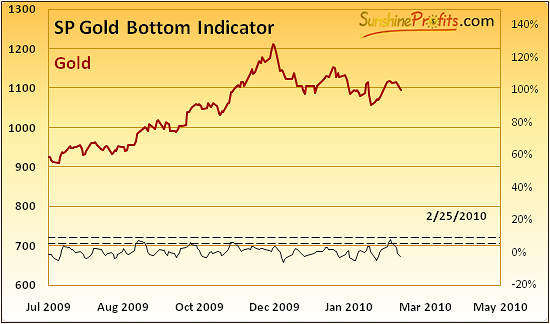
Last week we mentioned that one of our unique indicators is about to flash a buy signal. We also mentioned that this is positive news for the whole precious metals market, not only for gold itself, but we still need to monitor the situation on the general stock market and check how gold corresponds. Several days of divergence between PMs and the main stock indices will most likely be enough to let us know that PMs are ready to rise once again. For now, we must remain cautious.
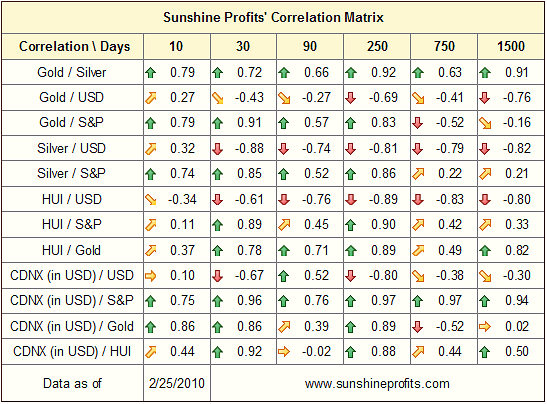
The indicator that we referred to has indeed flashed a buy signal, but the precious metals market still appears to be highly correlated with the general stock market (more than with the USD Index), which means that the buy signal flashed by the SP Gold Bottom Indicator was "not enough" for us to become all-optimistic.
It would be important for the general stock market and PMs to have a considerable negative correlation in order to confirm a bullish trend for precious metals.
As we have stated earlier in this essay, both the S&P 500 and the USD border on the overbought mark, while the PM market appears to be just at the start of its climb. We have to be careful and observe further to see if the bullish trend for precious metals is related to the "almost overbought" status by the USD, and consequently, the general stock market. Should those two markets go down and there was no change in the strength of the correlation between S&P 500 and PMs, it would be very likely for the precious metals market to face the same fate.
Moving on to the analysis of the precious metals themselves, let's begin with the long-term chart of gold.
Gold
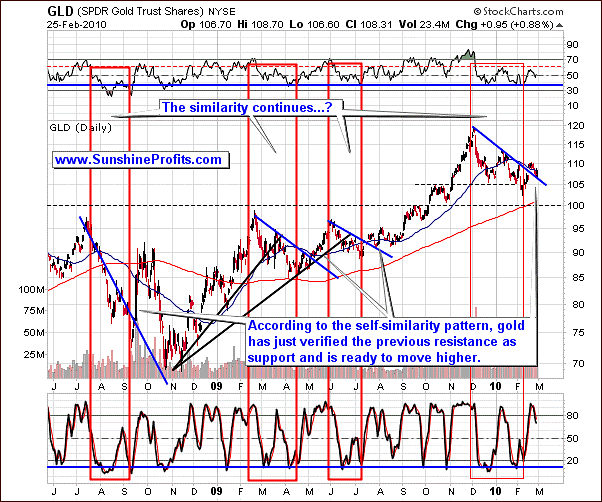
As we can observe on the GLD chart above, the values follow a consistently similar trend. After breaking above the declining short-term resistance lines (marked on the chart with blue color), gold moves lower to test the previous resistance. That was the case also this time as gold has just verified the previous resistance line as a support.
The value of the Stochastic indicator has just moved lower after being overbought and this action is often considered to be a sell signal. However, taking gold's previous performance into account, we see that gold usually manages to rise despite this signal, so we don't think we need to worry about it.
Gold is warming up and preparing to launch higher. If only gold can break free from its strong positive correlation with the general stock market, then one can assume that the gold market will most likely climb its way up.
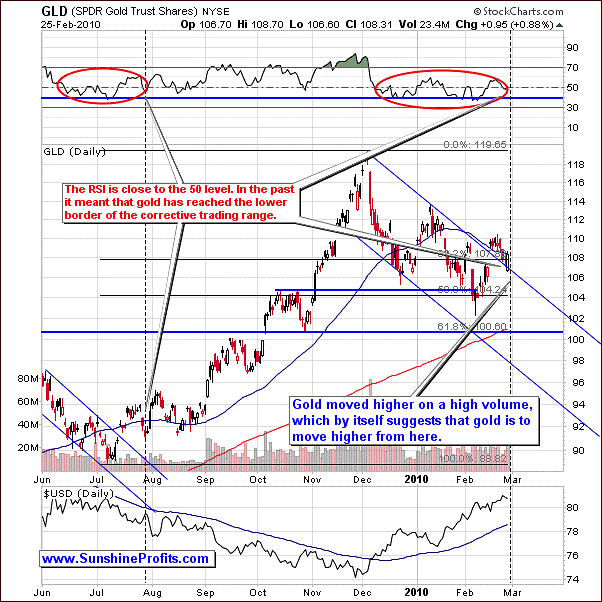
The area marked with the first red ellipse (June - August 2009) shows that the gold market moved higher after the RSI indicator hit the 50 level (vertical dashed line). After having bottomed in late July, gold and the RSI moved up - the latter to over the 70 level, which marked one of the profit-taking points.
Back then gold bottomed once again before rallying strongly. Should that be the case also today (which is not highly probable in our view), it may correspond to a move lower in the general stock market. This outcome would lower the correlation between gold and the main stock indices and reassure us that the following rally is in fact going to be significant.
The closest target for the current rally is the January 2010 high around $114 in the GLD ETF (which means spot gold around $1,160). Naturally, these targets may be reached only if the general stock market doesn't plunge and drag PMs with them. We will know more once gold moves higher - while one can make price projections also in the distant future, it is impossible to do the same with volume.
Before moving on to the silver market and the precious metals stocks, let's check gold's performance from the non-USD perspective. This part of the update is in fact a follow-up of the December 18th Premium Update, in which we also covered the following charts.
Gold in Currencies Other Than USD
In December we wrote the following:
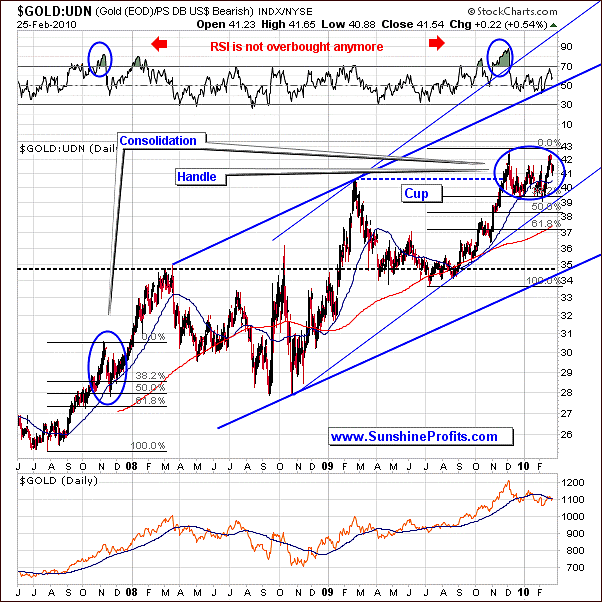
UDN is the symbol for PowerShares DB US Dollar Index Bearish Fund, which moves in the exact opposite direction to the USD Index. Since the USD Index is a weighted average of dollar's currency exchange rates with world's most important currencies, the gold: UDN ratio means the value of gold priced in "other currencies".
From the average non-USD perspective, gold appears to be forming the "handle" of the cup-and-handle pattern. This is a bullish formation, meaning that the following move could take gold to new highs. The trend remains up, but the correction may not be over yet.
The corrective phase was not over in December, but according to the points made above, it may be over or be very close to its end.
Quoting from the December issue:
In 2007, gold had needed to correct 50% of the first stage of the substantial rally, before the move was resumed. It also moved below the 50-day moving average, which corresponded to the 38.2% Fibonacci retracement level. We have a very similar situation today - also confirmed by the Relative Strength Index. Consequently, gold may need to move lower - below the 38.2% Fibonacci retracement level, 50-day moving average, and stop at the blue rising trend line / 50% retracement level. I have marked the latter with the red ellipse.
This is exactly what we've seen in the past several weeks. Currently, the RSI indicator on above chart is not even close to being overbought. Summing up, it looks like the handle is close to being complete and the next big move up may begin soon - naturally, given that the general stock market doesn't drag it down.
Gold in Euro
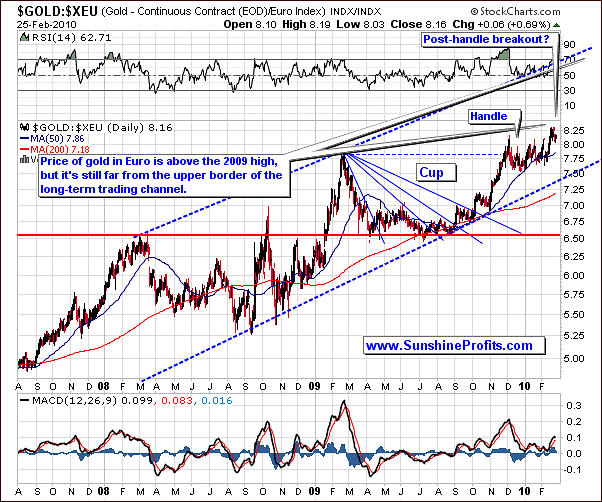
This next chart shows a slightly similar case - after all the Euro is the largest component of the USD Index, which means that it's most of the "other currencies" mentioned in the previous part of this update.
The market is through with its cup and appears to have formed most of the handle. The current price of gold in Euro beats the 2009 high, which is an encouraging piece of news for European gold Investors.
Gold in British Pound
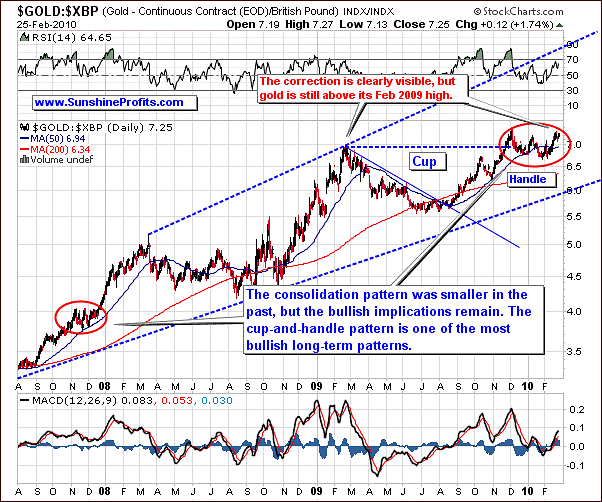
Compared to the previous consolidation pattern, the above one seems a bit longer. Just like with the gold priced in currencies other than the U.S. Dollar, we can also clearly see a cup-and-handle pattern. Unlike the previous charts, the prices here seem to be able to manage its distance from the trend lines that surround it. The bullish signals are present, as suggested by the cup-and-handle pattern, which also corresponds to a similar action in the past.
Gold in Yen
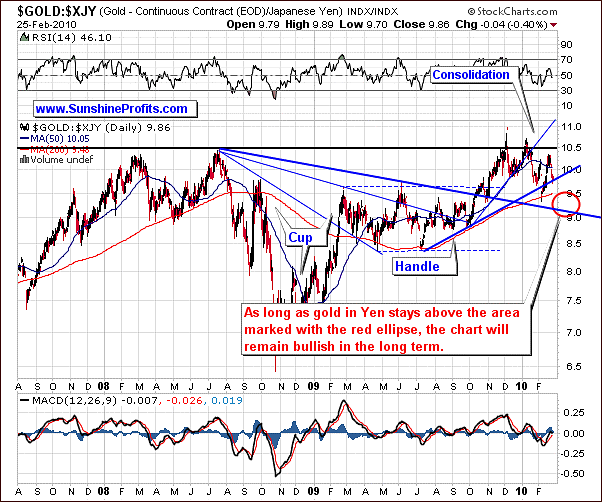
The price of gold in Yen rarely shapes in a similar way to its counterparts in other currencies. However, this is good news for us, since it allows me to analyze two different (technically speaking) charts and check for divergences / similarities. Consequently, it helps to estimate odds that a particular move will indeed take place or not.
What we see on the above chart is not much of a cup-and-handle pattern as it is the case with the previous charts. The market has already beaten its previous high on the chart, but failed to stay above that level. Now that it has consolidated, it appears ready to move above the previous high. The above chart is bullish, and the price of gold in Yen would need to go below the brim of the previous cup (area marked with a red ellipse) to turn this chart bearish.
Gold in Canadian Dollar
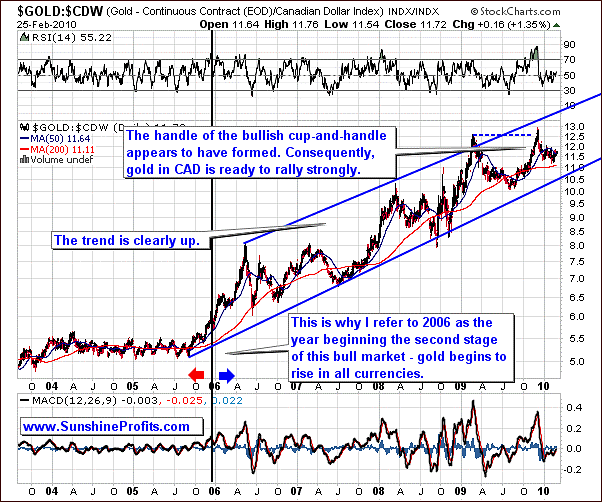
Here, we can clearly see that the gold market follows a bullish pattern. The recent cup-and-handle pattern strongly confirms the bullishness of the trend. We can expect further increases in prices for the gold from the Canadian perspective.
Gold in Australian Dollar
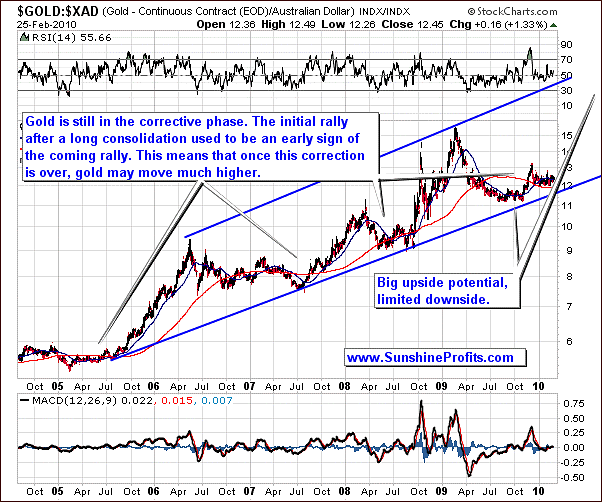
The gold market for the Australian Dollar is still under the corrective phase. It almost touches the downtrend but still manages a progressive upward movement. The possibility of reaching higher grounds is greater, just like with the other charts presented previously.
In one of the previous Premium Updates we wrote the following:
The bullish fact is that we have just seen the initial rally after the consolidation. In the past, this action suggested that a big move is coming, but it won't necessarily take place right away. This is in perfect tune with what I mentioned based on the analysis of other charts. Gold is likely to rally massively, but not immediately.
Moving on to the analysis of the while metal, let's begin with the long-term chart.
Silver
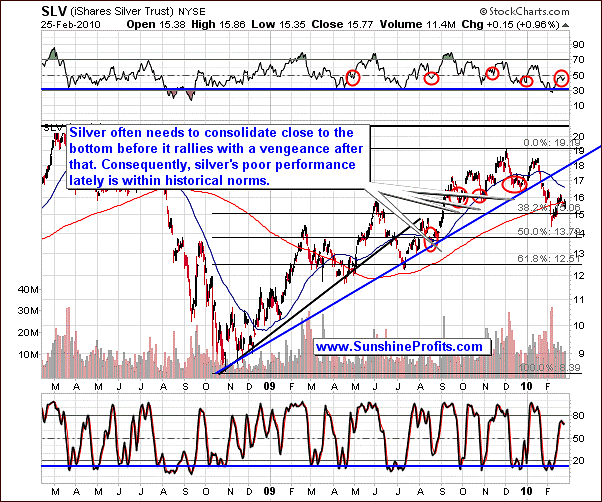
Points made in the previous Premium Update regarding the long-term situation on the silver market are up-to-date also today.
(...) the RSI and Stochastic indicators suggest that the price of silver is likely to reverse soon, but these indicators are based on price alone - they don't take the volume factor into account." This is relevant also today, as the volume during the upswing that we've seen in the past few days, is not really impressive.
(...) it may seem strange that silver (the SLV ETF) is currently hovering around $15 instead of rallying strongly. However, taking a second look at the above chart reveals that this is the way that silver used to behave shortly after it had bottomed. We've marked these situations with red ellipses. Please note that if that pattern is to repeat itself once again, silver may move much higher soon.
This is the case also today, as the SLV ETF around $16 is not really much higher than it was when the latest bottom was formed and the volume during upswings is relatively low. Instead of rallying, silver is more or less trading sideways and moving insignificantly higher. Still this is a normal behavior for silver during the bottoming process, and it confirms that the last chance to get back on the long side of the market is not behind us.
The Stochastic indicator has formed a double bottom, which in the past signaled that the bottom is in. But let's not forget that it moved very briefly lower at the end of December 2009, when silver declined as well - back then it meant the final downswing before the $1+ rally.
Please note that the RSI indicator is slightly below the 50 level, just like it was the case in the past at the end of the consolidation / beginning of a rally.
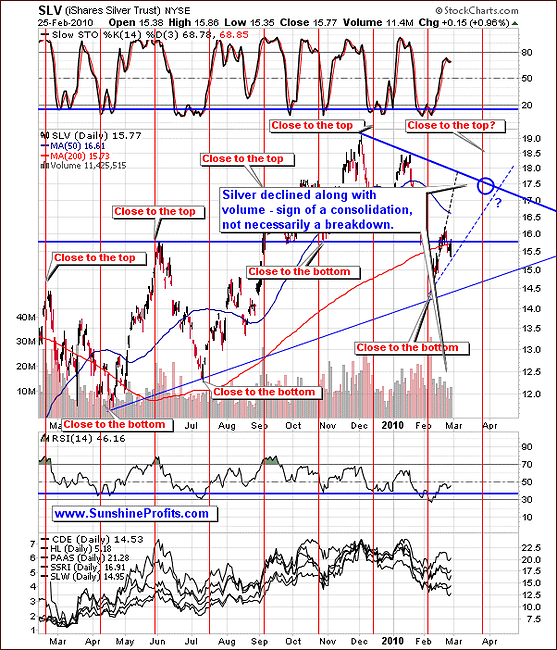
In the previous Premium Update we wrote that at least a brief correction is likely.
Please take a look at the April 2009, July 2009, and November 2009 bottoms - once the bottom was put in around the date suggested by the red vertical line (as was the case recently), in silver corrected at least briefly before rallying significantly. Should that be the case also today, one might expect silver to move lower relatively soon.
Additionally, please take a look at the pace of growth of the price of silver since its early-February bottom. Should it be sustained it would move to the next strong resistance level very quickly and put in a temporary top much before the cyclical tendencies suggest.
Of course, it is possible that the resistance level marked with the blue declining line doesn't hold silver and it will move much higher without stopping at $17.5 - $18, however we don't find that outcome very likely. Instead, we see silver consolidating at least for a while, and reaching a temporary top within a month or so.
This is what we've seen this week. Silver corrected briefly and is currently once again over the $16 level. If silver does indeed rally from here (as we expect it to), the lower rising dashed line will become a short-term support level. The current rally is likely to take the SLV ETF above the $17 level (which means spot silver above $17.30). Of course, that is if the general stock market doesn't plunge and drag PMs with them.
Precious Metals Stocks
Once again, the situation did not change much since last week.
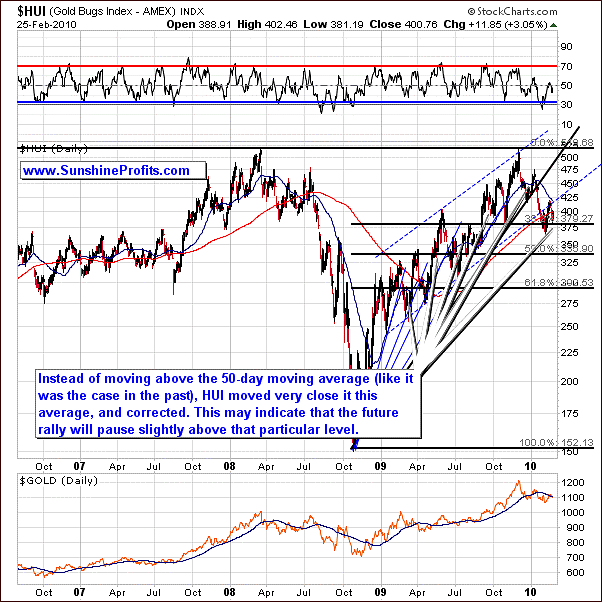
The analysis of the long-term HUI chart suggests that gold stocks may need to move a little higher before forming a temporary top. In the past, local tops have been formed after HUI Index moved above the 50-day moving average, which hasn't been the case yet.
This means that even if PMs are to move lower along with the general stock market, the above chart still suggests that the final top for this rally has not been formed yet.
Short-term chart provides us with more details
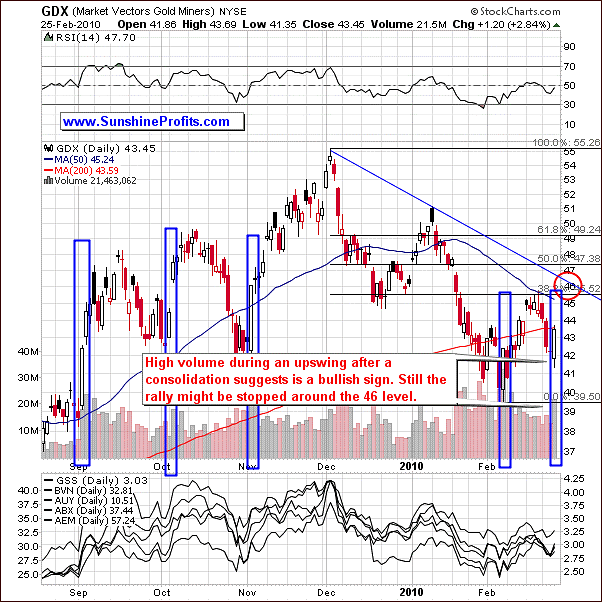
The short-term chart reveals that yesterday's price action was strongly confirmed by significant volume. When we've seen similar patterns in the past it meant that a new rally is starting. Naturally, the question is - how far will this rally take the GDX ETF. The first probable target is at the $46 level in the GDX ETF, however since PMs have already taken a breather this week, the probability that this rally will be stopped for more than a few days at $46 decreased significantly. Therefore, the next target is the $47.3 level (and about 440 level in the HUI Index), which stopped the first part of the decline in early December 2009, and which also corresponds to the 50% retracement level of the December - February downswing.
The situation is similar to what we've written about the gold market - we will know more once the PM sector moves higher - while one can make price projections also in the distant future, it is impossible to do the same with volume.
Sunshine Profits Unique Indicators
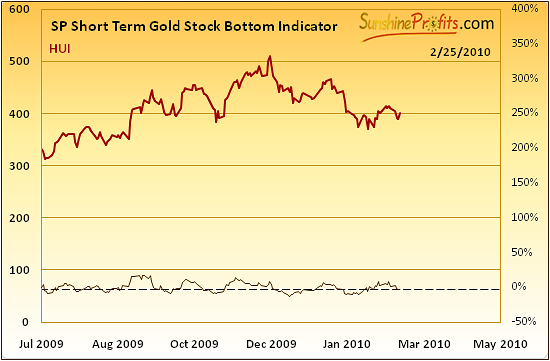
Two of our unique indicators have flashed a buy signal recently (for both: gold, and gold stocks), which serves as another confirmation of the points made earlier - namely, that the situation on the PM market is bullish and the only factor suggesting that caution is necessary is the general stock market.
Summary
The precious metals market appears to have formed a minor bottom and is ready to move higher. At this moment, in our view, almost all charts point to higher prices of PMs and the only piece of the puzzle that's not fitting is the situation on the general stock market. The problem is that it's currently one of the most things that we must take into account.
The very-short-term situation on the general stock market turned bullish very recently, which made us send out a Market Alert earlier today. The situation was clear enough to provide an entry point and profit on short-term transactions, while we wait for additional information regarding the bigger moves.
From the long-term point of view, the situation stays bullish, and gold charts in currencies other than the U.S. Dollar confirm that.
In both cases - from long- and short-term point of view, there is a threat in the form of a plunge in the general stock market that could drag PMs with them. We are still waiting for the confirmation that PM stocks can rise on their own, instead of being lifted along with other stocks. Until that happens we must remain cautious. Naturally, we will keep you updated.
This completes this week's Premium Update.
Thank you for using the Premium Service. Have a great weekend and profitable week!
Sincerely,
Przemyslaw Radomski

