
You often identify a bubble only in retrospect. The “bubble” metaphor indicates that the price of the stock or commodity was inflated and fragile – expanded on nothing but air, and vulnerable to a sudden burst. The crash which usually follows an economic bubble can destroy a large amount of wealth and cause continuing economic malaise. The perennial truth of financial history is that sooner or later every bubble bursts. Sooner or later greed turns into fear.
History has been peppered with financial bubbles and we’ll get to that, but first, is gold in a bubble?
So far it's been the amazing, runaway investment of the past decade. If you'd put your money into gold at the lows about 10 years ago, you'd have made approximately 400% return. That's left pretty much everything else—stocks, China, housing—in the dust, and we don’t mean gold dust.
Needless to say, no one knows with certainty whether or not gold will become “the ultimate bubble,” as George Soros predicted, or continue in a stable, secular bull market for many years to come. (If you had listened to Soros when he issued his warning at the World Economic Forum (WEF) back in February and had shorted gold when it was trading at less than $1,150 per ounce, you would be in a lot of pain today.)
So is gold in a bubble?
Bubble, Shmubble
We would be willing to bet that if you asked for a show of hands of how many people own gold in an audience of 100 seasoned investors, probably less than 10 might raise their hands. If you asked the same question in a room of average, random people probably one or two hands at the most might go up.
Gold is clearly not in the bubble stage yet.
People have many reasons not to own gold. As Warren Buffett put it: "Gold gets dug out of the ground in Africa, or someplace, then we melt it down, dig another hole, bury it again and pay people to stand around guarding it. It has no utility. Anyone watching from Mars would be scratching their head."
In addition, gold is volatile (gold investors have to endure gut-wrenching corrections); it is hard to value and generates no income.
So back to the bubble question--what do tulips, Mississippi, Internet, Dot.Com, the South Seas and Florida housing have in common? They were all at one time bubbles that burst leaving financial ruin in their wake.
Although some of these bubble episodes happened centuries ago, the events are eerily similar to today’s bubbles and busts: low interest rates, easy credit terms, widespread public participation, bankrupt governments, price inflation, and frantic attempts by government to keep the booms going and government bailouts of companies after the crash.
What can we learn from history about financial bubbles?
The Granddaddy of them all - the Tulipmania
We have all heard of the classic bubble, Tulipmania, which took place in the 1630s in the Netherlands, where derivative futures in tulip bulbs were exchanged for astronomical prices. Aristocrats, maids and chimney sweeps all got Tulip Fever. At the peak of tulip mania in February 1637, a single tulip bulb sold for more than 10 times the annual income of a skilled craftsman. The bubble held until a terrible crash that was caused, according to legend, by a sailor who mistakenly ate a high-priced tulip bulb after he confused it with an onion.
The Bank of Amsterdam dominated the Dutch financial system in the 17th century, and possessed one of the toughest monetary systems of all time-- 100-percent reserves of gold and silver backing all of its monetary promises.
So the question arises as to how did this mania get started under such a strict monetary system?
Douglas E. French, president of the Ludwig Von Mises institute, offers an explanation in a book, Early Speculative Bubbles & Increases in the Money Supply.
In a nutshell, French claims that it was a government intervention that dramatically exploded the money supply and fueled the tulip-price bubble, not unlike the bubbles that were formed in modern times.
The Dutch instituted a policy of "free coinage", whereby any amount of precious metal brought to the Dutch republican state would be minted "free" of charge and returned as the same weight of precious metal in the form of coins. Dutch taxpayers were forced to subsidize minting, thereby sucking in precious metals from all over Europe. The Dutch state policy of providing "free coinage" meant that more bullion was turned into coin than a free market would otherwise have produced. So there was a dramatically rising flow of precious metals flowing to the port of Amsterdam, especially from the Spanish silver mines in South America. Amsterdam was ripe for speculation and everyone got into the act.
The Five Stages of a Bubble
Niall Ferguson in his book “The Ascent of Money,” distils the formation of bubbles into five stages:
1. Some change in economic circumstances creates new and profitable opportunities.
2. Euphoria sets in whereby rising expected profits lead to rapid growth in share prices.
3. The prospect of easy capital gains attracts fist time investors.
4. The insiders realize that the now exorbitant price is unsustainable and begin to take profits by selling.
5. As share prices fall, the outsiders stampede for the exits all together causing the bubble to burst.
If we look at the above analysis, then gold is probably only in stage one where changes in economic circumstances create profitable opportunities to buy the yellow metal. We are still far away from euphoria. Although gold has attracted some first time investors prompted by fear and searching for a safe haven for their capital, gold is far away from being a crowded trade. If you’re not sure, just ask your friends, acquaintances how many of them have bought gold. With crumbling infrastructure, runaway debt, paralyzed government, military bogged down in pointless faraway non-wars and troubles in the eurozone, there are plenty of motives to buy gold.
To put the current price in perspective, gold's 1980 high was about $7,000 in today's dollars when using the original CPI methodology, and $2,200 when using the new methodology. On that basis, today's price looks cheap. More importantly, China, India, and Russia all want to diversify away from the dollar and are looking to buy gold, and central banks have turned into buyers from sellers, creating something akin to a price floor.
Just because gold has been in a long-term advance does not mean it represents a bubble. Neither does volatility as long as it is within a reasonable range. It is when prices rise sharply in a short period of time, and then drop sharply in an equally short period of time that you can conclude that a bubble had formed, and then burst. We don’t see any evidence of that with gold.
Gold will correct during its run up and we hope that it does. When it does, all the people shouting “bubble” will smirk and we will be out there buying more. We think that bubble is not in gold, it is in what is driving the price of gold—fiat money creation.
The Austrians Predicted the Subprime bubble
We often like to write in the Premium Update about the Keynesian versus the Austrian schools of economics. Please note that it was the Austrian School of Economics that accurately predicted the financial meltdown of 2008. The Austrians correctly identified the influence of easy credit on human action. Altering the price of money alters incentives and changes individual calculations across the breadth and depth of an economy.
The Austrians pointed out that government-controlled interest rates are the real cause of the business cycle inasmuch as they lead to credit booms and inevitable busts. When the price of money is rigged, the market isn’t free. Only if you understand the “root cause” of the business cycle can you learn how to prevent bubbles from blowing up and popping later. The Austrian answer is sound money.
To see how gold is bubbling along let's begin this week's technical part with the analysis of the Euro Index. We will start with the short-term chart (charts courtesy by http://stockcharts.com).
Euro - USD Indices
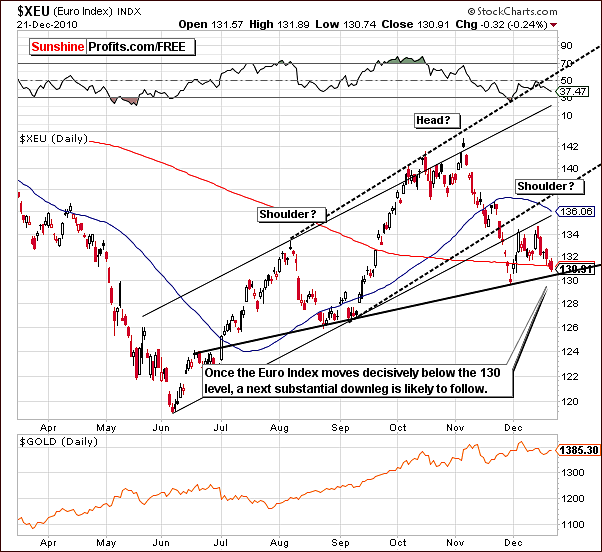
We begin this week’s Premium Update once again with the Euro Index chart where attempts to move below the medium-term support line continues. The head-and-shoulders pattern (which might be completed even though it appeared rather unlikely just a few days ago) formation is about to be signal a significant move lower.
Once the support line is taken out and the index level moves below 130 (the neck level), another period of potential decline may very well be seen. This could spell trouble for gold and lower prices would be quite possible. With gold leading the way, precious metals investors should keep a close eye on the euro and its impact on gold for this reason. While the short-term influence has been mixed recently, taking medium-term moves into account (as we will explain more thoroughly later in this essay), reveals that declining euro might still drag gold with it, if the move in the former is significant.
Note that the breakout below the rising trend channel was verified a little over a week ago. Since that time, Euro Index levels have steadily declined with close to a 3% drop seen as of Tuesday. The outlook here remains quite bearish.
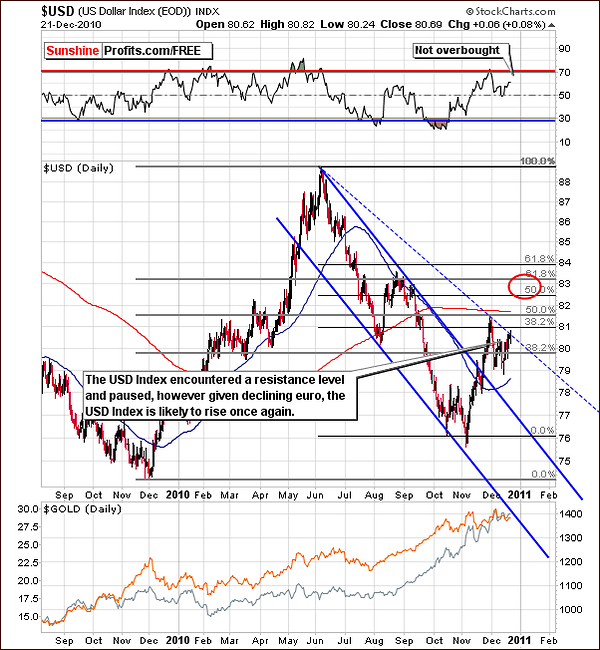
In this week’s long-term USD Index chart, we see trends, which are the exact opposite of those seen in the Euro Index - which is normally the case. The resistance level (dashed declining line), which is now in play, is rather weak, having been formed from two highs, one of which was formed very recently. Please note that the upper border of the previous trend channel (thick blue line on the chart) was much stronger as it was based on two tops that were a few months apart from each other and also from the moment when the resistance was in play (in November) - please note that this level stopped the rally for a while.
It seems likely that the resistance level will fail to hold this rally in check. If the index moves above the 81 level, a move to 83 or so will likely be seen. Indications are at this time that this is a very real possibility in the coming weeks. In last week’s Premium Update, we briefly discussed the 83 level for the USD Index on the very long-term USD Index chart and points made at that time remain valid.
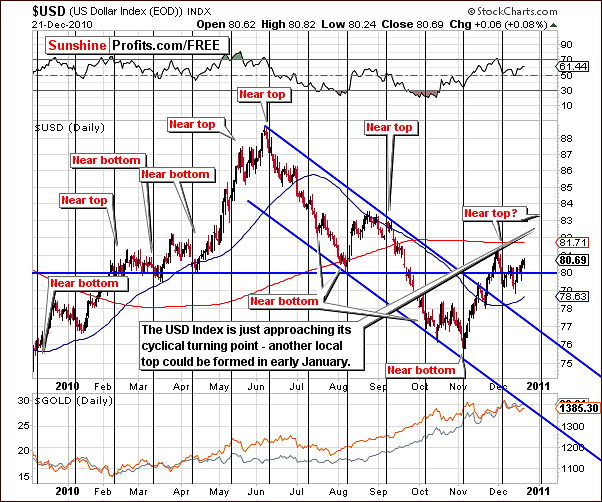
The short-term chart confirms our prior observations and provides evidence that a local top may be seen soon. The cyclical turning points indicate that in early January, a local top or bottom will probably be seen. If it is indeed to become a local top, the move up to this point will likely happen very soon.
Again, the cyclical turning points do not suggest that a top is more likely than bottom, but based on the previously mentioned points indications are, however, that a local top is more likely and index levels will likely be seen to rise in the days ahead.
Summing up, the USD Index is likely to rally here and this has slightly bearish implications for precious metals. The relationship between the USD Index and gold, silver, and mining stocks, however, is not as clear as it once was. This seems to be due to the negative changes seen in the Euro Zone, the euro being a very large part of the USD Index.
General Stock Market
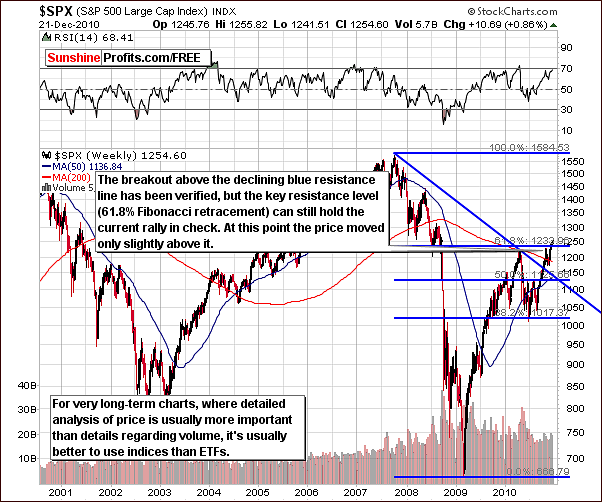
The very long-term SPX S&P 500 chart is virtually unchanged from last week. In our last Premium Update we stated the following:
The very long-term S&P 500 chart features the index close to the 61.8% Fibonacci retracement level based on 2007-2008 decline. This is significant and will likely impact stocks for the near–term. Furthermore, the RSI is approaching the 70 level and this is an indication that a consolidation might be in the cards. This is consistent with what has been seen of late and more consolidation appears to be quite possible based on these factors.
The RSI level is now at 68.41 and this level has corresponded to local tops several times in the past. Perhaps stocks are near a local top also this time. Let's zoom in, to find out more.
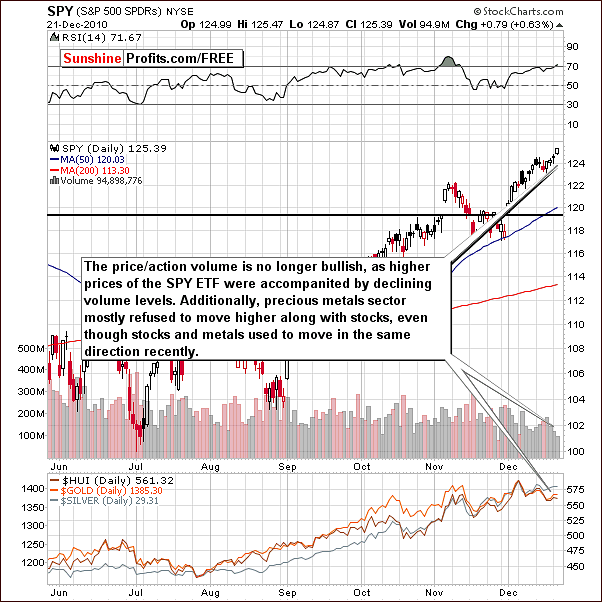
The short-term SPY ETF, a proxy for the S&P 500, provides further evidence that perhaps a local top is near. When stock prices rallied above previous intra-day highs on Tuesday, volume levels were extremely low. The recent breakout has not been supported by high volume levels and actually a decline in volume is clearly visible in the central portion of this week’s chart. When rising prices are not supported by high volume, the rally usually cannot be sustained and therefore a local top is very often the result. Such appears to be the case here.
In previous months, stocks and precious metals moved in the same direction on most occasions. Although the influence of stocks on gold, silver, and mining stocks has diminished somewhat, it still exists to some degree. Since early December, the precious metals sector in general has not followed stocks’ lead higher and prices have actually declined somewhat. This, by itself, is a bearish indicator for gold, silver, and mining stocks in the near-term.
Summing up, the sentiment for the general stock market is now bearish as a local top appears to be very close and it seems that the breakout visible on the very long-term chart might turn out to be a fake-out. The implications are also slightly bearish for the precious metals sector as well.
Correlation Matrix
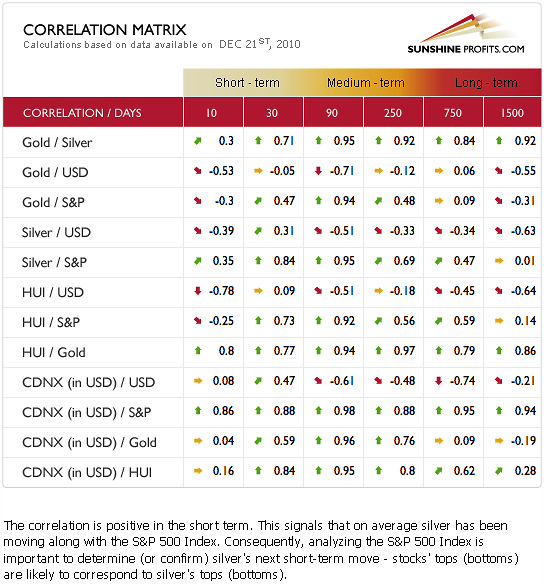
In this week’s Correlation Matrix, silver is seen to have a very high correlation with stocks in the short-term, 30-day column (as explained right above this paragraph). It is actually a stronger relationship than is seen between silver and gold! Precious metals investors should keep this in mind - the low volume on the general stock market is therefore particularly important to Silver Traders.
Previous comments regarding general stock market trends and the low volume during price upswings is a rather bearish sign for mining stocks and gold as well. Please note that given in the medium-term (90-day column), coefficients for gold, silver, and mining stocks with the general stock market are extremely high (correlation coefficient is above 0.90), the implications here are bearish across the board for precious metals for any big moves.
The situation has been somewhat different from the very short-term perspective. Gold and mining stocks have pretty much ceased to react to general stock market positive influences. It seems that the precious metals sector might be leading stocks to a correction. This is simply not normal behavior. Either a big break-out is about to take place or a new wave of price corrections is about to begin. We believe the latter is more likely.
Gold
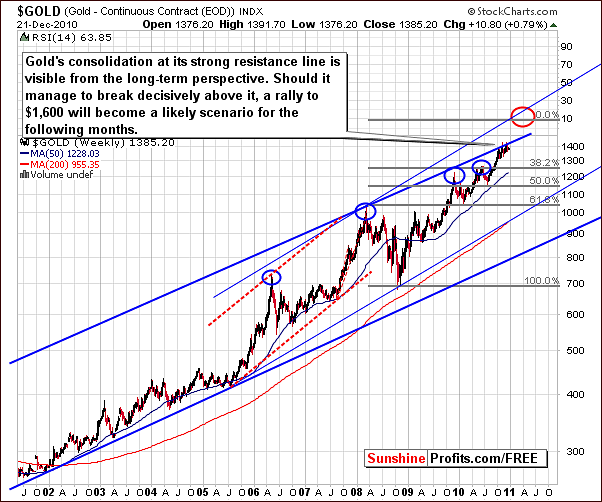
Once again, we begin this week’s gold section with the very long-term chart. This chart provides us with an important perspective in that it clearly shows the true significance of recent price moves. What may seem like an important move in either direction can often be identified as a common trend, visible from the proper perspective. In other words, this chart allows us to justify our views regarding long-term investments, as a correction to $1,300 would be rather insignificant taking very long-term tendencies into account.
Based on historical trends, though ever mindful of changing market conditions worldwide, the signs do not indicate that any radical decisive action should be taken at this time with respect to long-term holdings. Clear evidence of an imminent final top is required to justify such a critical decision. For instance, please note that the final top of a big rally virtually always used to take place in a spike form, not after a consolidation. The needed signals have not yet been seen.
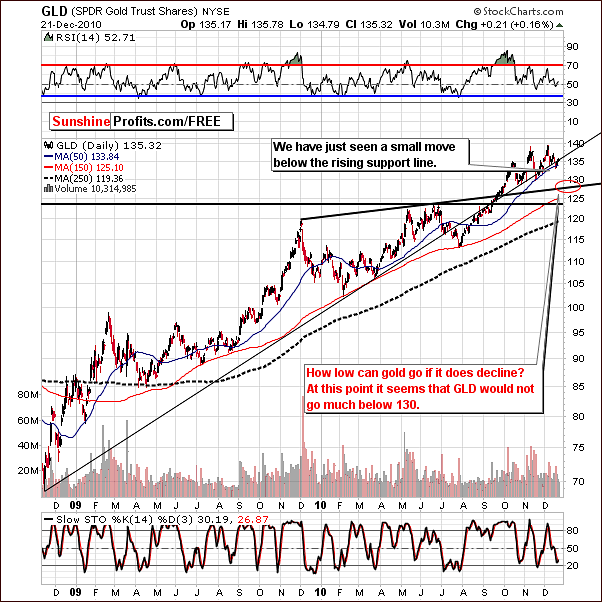
The long-term GLD ETF chart gives us a closer look at current trends with respect to resistance and support levels. The long-term rising support line is still an important factor. Previously, it had provided support before being broken in July. Gold’s price moved below it recently and has been trying to retake this level and move above it once again but this has not been seen. Consequently, the previous support has turned into a resistance.
In Monday’s Market Alert, we discussed recent price declines, which had been followed by low volume upward moves in price. It seems this is a general re-test of the breakdown and has overall bearish implications.
Target levels for the current decline appear to be slightly below the 130 level for the GLD ETF, most likely close to 128. For spot gold, this would coincide with a price level around $1,300.
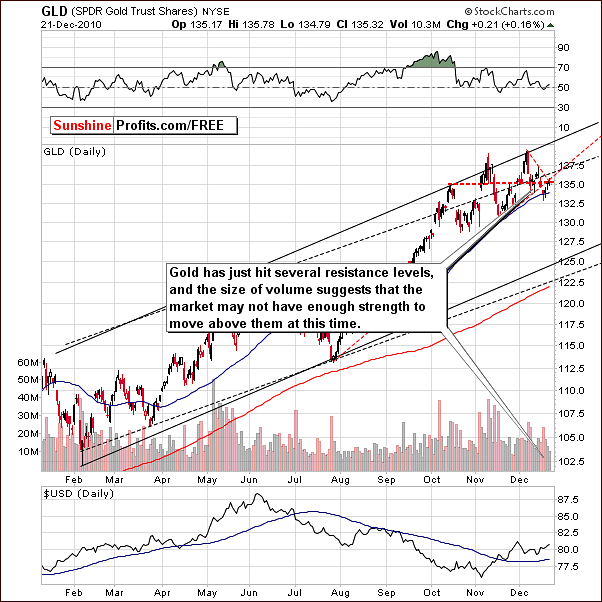
Our third chart provides us with a short-term view and here we can see that Tuesday’s insignificant move upward was coupled with declining volume and therefore did not invalidate the previous downward trend. In Monday’s Market Alert we wrote that we will need to wait for additional signal in form of a daily upswing on low volume before we could suggest that a move lower would be worth betting on. In short, the small upswing in price was truly negligible neither a confirmation nor an invalidation) and probably not even worth mentioning.
Current price levels are quite close to several resistance lines and with low volume seem to indicate that there is likely not enough strength in this rally to bring about a breakout. If volume levels remain low during declines in the whole precious metals sector then closing short-term short positions will be at risk, so it will be best to close them. At present however, we suggest keeping small, open short-term speculative investments unchanged.
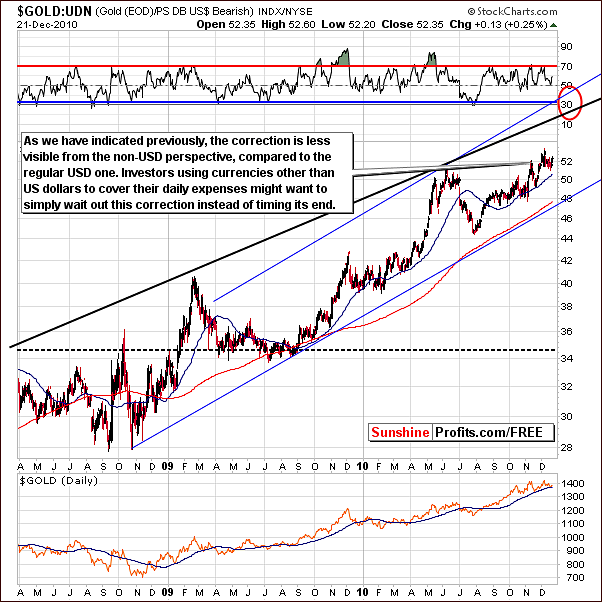
In this week’s gold non-USD (meaning the gold:UDN ratio) chart we see declines, which are small when compared to gold from a USD perspective. Also the very recent upswing was much bigger from the non-USD perspective. This is due to the fact that price declines in gold have been accompanied by a rally in the USD Index. The result therefore is that declines are not as rapid in non-USD currencies.
Because of that fact, non-USD Investors might want to simply wait out this correction, instead of trying to time it. In this case the risk/reward ratio is less favorable for betting on lower gold prices because the reward part is smaller.
Summing up, the situation for gold in the short-term is rather bearish. There has been neither confirmation nor invalidation of Monday’s signals in days following. The bearish situation is with respect to small short-term speculative positions only at this time. Long-term holdings should remain status quo for the time being.
Silver
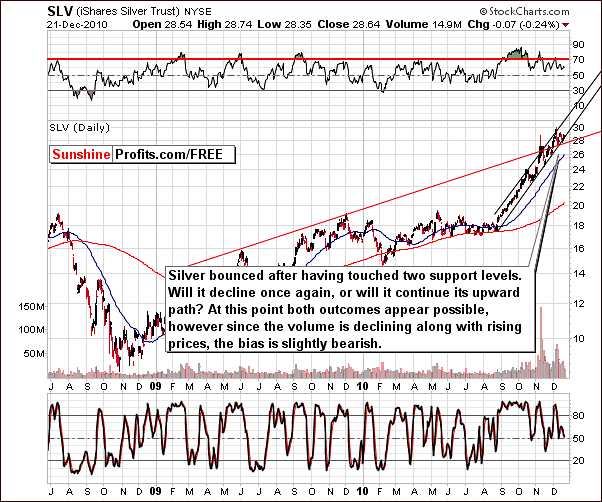
This week’s long-term chart for silver shows that the white metal is still struggling with the rising trend line. On the above chart, this is the black upward sloping line very close to Tuesday’s closing price. The past week has seen very little change in silver’s price moves and therefore observations made in last week’s Premium Update still hold true.
Analysis of price and volume on a daily basis yields a slightly bearish sentiment going forward. This is mainly due to declining and low volume levels corresponding to most upward moves in price.

In the short-term chart, we can see that silver is still in a trading range below the intraday highs seen in early November. It is true that silver’s price is above the rising support line, but the situation is becoming tense as a breakout or breakdown may very well be seen soon.
The bearish sentiment prevails here (please recall the bearish signals coming from the analysis of volume of the SPY ETF and the implications that the general stock market has on the white metal) as well and a breakdown seems more likely in the short-run. Keep in mind that silver is the least precise of all precious metals markets and signals must always be regarded as subject to change.
Cyclical turning points suggest either a local top or bottom in the first half of January 2011 and given the probable bearish influence from stocks it seems that declines from here would continue for two to three weeks. This would result in what could very well be a great buying opportunity. Although declining prices may be seen through this period, it is far from a certainty. It does seem a slightly more likely scenario as was discussed in Monday’s Market Alert.
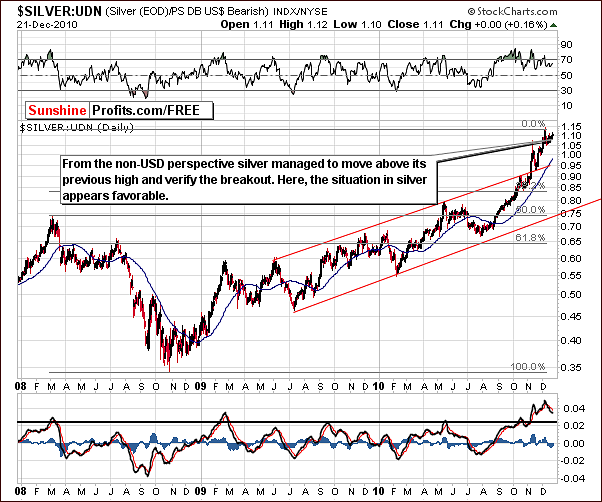
In the non-USD silver chart (i.e. the silver:UDN ratio) this week, the consolidation is seen here to be much more bullish than was seen from the USD perspective. This is similar to what was discussed earlier in the non-USD gold section and once again is due to the recent rally in the USD Index.
An interesting observation can be made here. Silver’s price is seen to be higher than November intraday highs and from a non-USD perspective. This is a favorable situation and is a somewhat bullish indication for the non-USD Silver investor.
Summing up, analysis of volume levels and recent price moves continue to provide rather bearish indicators from a USD perspective. With a cyclical turning point two to three weeks away, it is possible that a great buying opportunity will soon be seen. The outlook is more bullish for non-USD investors, at least in the short run.
Mining Stocks
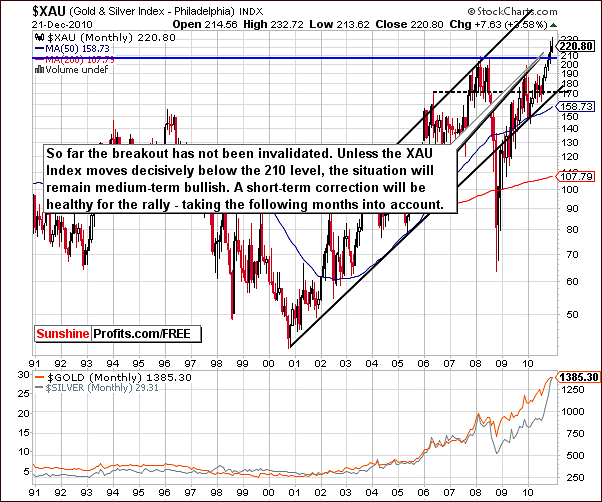
The XAU chart, which is a proxy for gold and silver mining stocks is pretty much unchanged from last week. As it was the case with the very long-term gold chart featured at the beginning of this update, we decided to provide this chart even though it doesn't provide additional information to what was posted on Friday, as it helps to keep the day-to-day situation in a proper perspective, and it justifies our long-term views.
It seems that unless a decline in excess of 5% from here to below the 210 level or so is seen, the breakout will be perfectly verified and provide an opportunity to add to long-term positions.
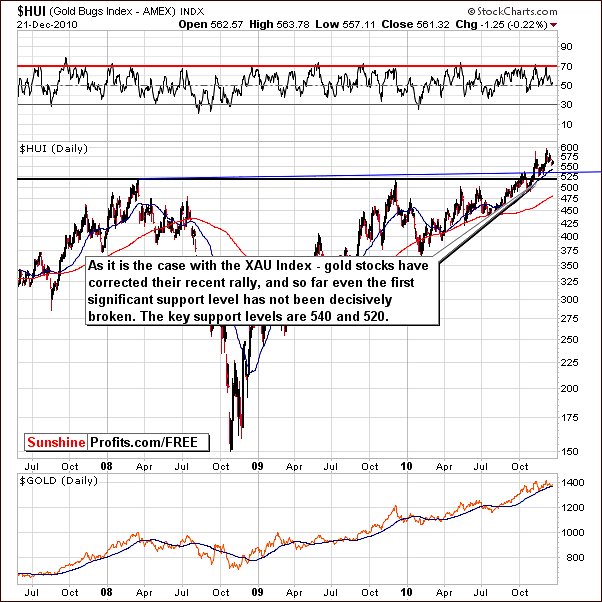
In the HUI Gold Bugs Index chart, little has changed in the past few days. Quoting from last week’s Premium Update, we still have two target levels, which are valid from prior updates. One is at the 540 level and the other at 520 and these correspond to two important support lines… and at this time it seems that the 520 level is slightly more probable given gold's target at $1,300….It seems that the best suggestion at this time for long-term investors is to hold present positions.
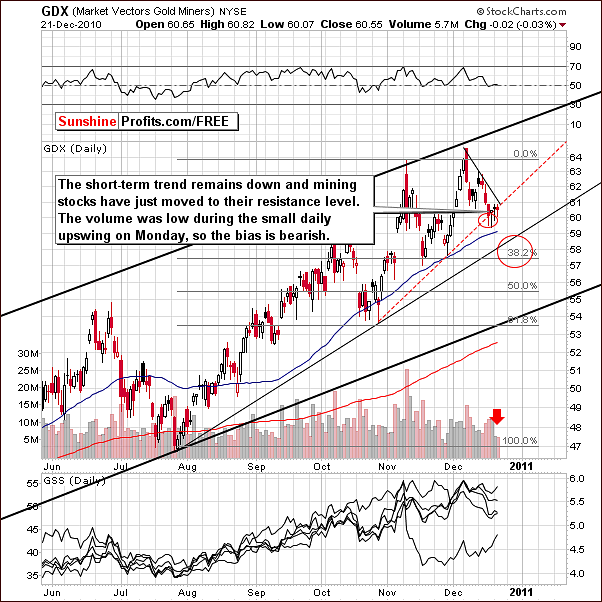
In this week’s GDX ETF short-term chart, which is a proxy for the mining stocks, an interesting development is seen. The price has been moving below and above the rising support line on a daily basis, however the small rally seen on Monday has been accompanied by very small volume. On Tuesday, prices remained pretty much flat with low volume seen once again.
The point is that we have neither a confirmation nor an invalidation of the trend for lower price levels. The low volume levels most likely preclude any reasonable chance of a breakout above the resistance line (thin black declining line) as the rally simply does not seem to have enough strength. What is more likely is that declines will continue with target levels in the 57-58 range likely reached before the local bottom is seen.
Summing up, the situation remains bearish for the short-term. If price declines continue and low volume levels accompany these declines, this would invalidate the bearish outlook, which we are leaning towards at this time. However, the trend would be confirmed if high volume levels are seen with declining prices.
Letters from Subscribers
There were only a few days since the previous Premium Update has been posted, so there are not many question this time.
Let's start with a short question about GDX - usually considered to be a good barometer for OGMCX. Monday's price action of OGMCX was different than usual, it dropped around 10%. The question is what might have caused such a dramatic decline and should those owning OGMCX be concerned.
We've managed to find the answer. The reason for the decline was that the Oppenheimer Gold & Special Minerals fund decided to pay out approximately $5 dividend - since this capital was expected to be reinvested and was discounted in the price, the latter dropped.
Another question was about the Monday's volume, which was low in precious metals and in the rest of the market. The question is should we consider the latest upswing on low volume a relevant one if it was just a low volume day all across the board.
In our view, low volume across the board during a move up would mean that other equities have also provided a bearish signal, not that the one seen in the gold market (and especially in mining equities) was irrelevant.
Summary
The trends have become a bit clearer this week and it now seems that declines are likely to be seen soon in stocks and in the precious metals sector. Bullish sentiment prevails for the dollar, however as the euro continues to struggle.
Individual charts in this week’s Premium Update confirm a bearish sentiment for gold and gold stocks with silver’s charts giving mixed signals at this time. The general stock market situation, however, turns the sentiment to bearish for the white metal as well. These observations pertain to the sentiment from a USD perspective. Non-USD bearish signals and implications are not nearly as significant.
Monday’s Market Alert commentary about maintaining small, open speculative positions still holds. Long-term holding should remain intact at this time. We will continue to monitor the markets and immediately notify you of developments, which are of significance with respect to precious metals investments.
A note about next week’s Premium Update: due to the New Year’s holiday on Saturday, our next issue will be published on Thursday, December 30, a day ahead of our normal schedule.
We would like to end this week's Premium Update by quoting Ebenezer Scrooge from A Christmas Carol novel by Charles Dickens:
I am sure I have always thought of Christmas time, when it has come round — apart from the veneration due to its sacred name and origin, if anything belonging to it can be apart from that — as a good time; a kind, forgiving, charitable, pleasant time: the only time I know of, in the long calendar of the year, when men and women seem by one consent to open their shut-up hearts freely, and to think of people below them as if they really were fellow-passengers to the grave, and not another race of creatures bound on other journeys. And therefore, uncle, though it has never put a scrap of gold or silver in my pocket, I believe that it has done me good, and will do me good; and I say, God bless it!
Merry Christmas to you and your families!
Sincerely,
Przemyslaw Radomski

