
Scenes are now to take place as will open the eyes of credulity and of insanity itself, to the dangers of a paper medium abandoned to the discretion of avarice and of swindlers.
Thomas Jefferson, 1814
We are on the cusp of a new year, a time that leads brave (or foolhardy) financial analysts to take out their crystal ball and predict where precious metal prices will go in 2011.
Gold has gained 26% this year, putting it on track for its third double-digit gain of the last four years. To chart gold’s price movements since 2000 take a piece of paper and draw an outline of an imaginary mountain slope (think Everest) with a few footholds to rest on the steep way up. There is still a long way up before you can plant the flag at the top. Euro-zone concerns dominated the gold trade in the first half of the year. For the astonishing second half, dollar weakness was the major story with the yellow metal reaching more than a dozen record highs. It got a boost in late August after Federal Reserve Chairman Ben Bernanke proposed expanding the Fed's bond-buying efforts with a second round of quantitative easing. For the most part, only modest retracements punctuated the winning streaks.
Year to date, silver’s 72 per cent gain still sharply exceeds gold’s rise of 26 per cent, as the gold/silver ratio held near its lowest level in four years at 47.
Let’s take a look at the fundamentals that have been driving the prices of precious metals higher this past year as well as some of the pitfalls that may lie ahead. All the factors that have driven gold higher – fear, uncertainties, the Fed’s printing press, lack of confidence in the dollar, gold as the ultimate currency, buying by newly wealthy Chinese families, sovereign troubles in the euro zone, central bank purchases, high unemployment in the U.S. – are still in place and we don’t see any of those factors changing significantly in the coming year.
Several forecasts predict gold has $100 to $400 more to gain this coming year. The timing of the peak may depend on interest rates. Analysts at Goldman Sachs say gold prices are likely to continue their upward trajectory next year, but likely peak in 2012 on rising interest rates at $1,750 an ounce in 2012.
Bank of America Merrill Lynch forecasts gold will top at $1,500 in the near-term.
The second half of the year is likely to be more challenging than the first, according to Tom Pawlicki, an energy and precious metals analyst with MF Global in Chicago. If the economy recovers fully, some of the bullish arguments for gold will disappear, he said to which we say - that’s a big ‘if”.
Peter Schiff says about gold prices: You ain’t seen nothing yet, and I don’t have to explain it, I’ll let (Ben) Bernanke explain it. The fed has now laid its monetary cards on the table. The fed has claimed that its new mandate is to create inflation. The old mandate was to create price stability. But the fed is using stable prices as a problem that it is going to cure by creating inflation. And the fed has an abysmal record of failure, but this time is one time it’s going to succeed. It’s going to create a lot of inflation and that’s why people are buying gold higher and higher as more and more people figure out that the fed is going to robe them blind.
Schiff is on the record as predicting that gold will go up to $2,000.
Dennis Gartman of the widely read “Gartman Letter” recommended as his top three trades for 2011: to buy gold and short the euro against it to hedge out US dollar risk, to buy the Australian dollar and short the euro against it, and to buy soybeans and corn. Gartman is concerned about European debt, so he's buying gold in terms of euros and then shorting euros. He added that the precious metal in terms of euros is currently at an all-time high (you may also see it on the gold:UDN chart in the following part of this update).
Jim Rogers said in an interview recently gold is going to go a lot higher over the next decade. If adjust for inflation it should be over $2000.
John Hathaway of the Tocqueville Gold Fund said in a recent interview: Gold may go sideways for a while, which is my wish, but who knows what's going to happen? Things could blow up, so trying to trade in and out is a huge mistake, in my opinion. To me, the most intelligent view of gold has to be from a strategic point of view. Get over the fact that it's gone up a lot, then try to be as clever as you can about legging into it. The bottom line is, you've got to own gold in this environment.
There have also been predictions about gold’s “crazy little brother,” silver, the leading performer in the metals this year. Will it repeat its success in 2011?
Standard Bank Plc said that they see silver at over $40/oz due to new applications and increased industrial demand.
James Turk of Gold Money said that he believed silver would reach over $400/oz in 2015. Turk believes that this price will be reached due to massive investment demand in silver due to a possible crash in the dollar and the emergence of inflation and potentially hyperinflation.
Nick Barisheff, president of Canada's Bullion Management Group Inc., is looking at $1700-to $2,000 per ounce gold in 2011."If we just do an average increase that we have had in the past five years that would get us the $1,700 an ounce. If we repeat the 2010 performance of gold, we get to $2,000."
As far as we're concerned, we would guesstimate gold's high for 2011 at $1,800 and $45 silver. Our very-long-term chart suggests a top at the end of 2011 or in early 2012 perhap
 s around $50, but since it is 2011 that we are talking about in this guesstimate, we would go with $45. We have specifically addressed these price levels as guesstimates instead of targets, because we will certainly adjust our analysis when more information becomes available and don't want to appear convinced that these level will surely be reached.
So what are the pitfalls for precious metals? The first is that the economy will heal (which may not be a bearish factor at all in case of silver because of the number of its industrial applications), the Fed will stop printing money, the euro will stabilize and the Chinese will stop buying gold. The chances of that happening are nil. Instead that we see in our crystal ball are bankruptcies looming at the state, county and municipal level throughout the U.S. The U.S. Federal Reserve is forced to buy T-bills from the Treasury department just so the government can continue to stay operational. Or, what is even more likely that the bankruptcies will be prevented by printing more money, thus fueling inflation and precious metals' rally.
This week we heard that the Chinese Gold & Silver Exchange, Hong Kong’s century-old bullion exchange, plans to launch the first international gold contract denominated in the renminbi in early 2011. The new contract comes as China pushes for greater international use of the currency and as Hong Kong’s precious metals industry seeks to take advantage of booming gold demand on the mainland.
A more realistic drag on gold could be the possibility of surging interest rates in Europe and the U.S. Higher interest rates would push investors away from gold, which bears no interest, pays no dividends and thus carries an opportunity cost. Some analysts credit last week’s lower gold prices to a rise in long-term yields. Should we worry about higher interest rates? Higher long-term yields reflect rising inflation expectations and diminishing confidence in the U.S. dollar and those are bullish for gold. Higher yields will be a drag on the economy that will require still-more monetary stimulus from the Federal Reserve. So, what at first glance appears to be a negative for gold will, over time, prove to be yet another plus for the yellow metal.
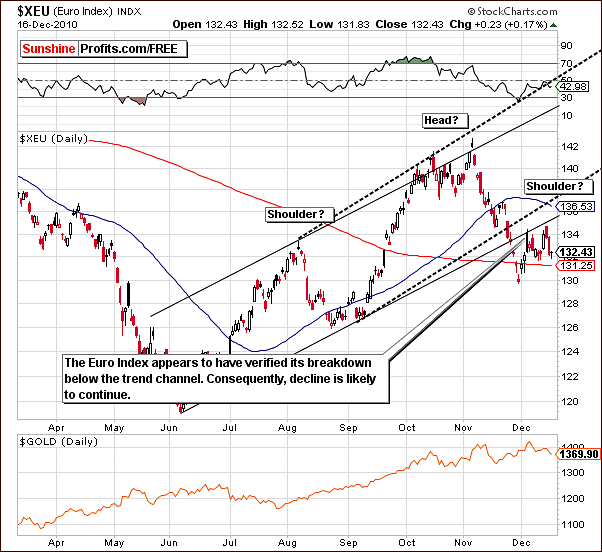
To predict how precious metals will behave in the short run, let's begin this week's technical part with the analysis of the Euro Index. We will start with the short-term chart (charts courtesy by http://stockcharts.com).
Euro - USD Indices

The technical part of this week’s Premium Update begins with a look at the Euro Index where resistance levels continue to be retested. Note that a previous support level is now providing resistance and has held for a second time. At this point, further declines could very well continue here and this would likely lead to a corresponding rally in the USD Index.
The head-and-shoulders pattern, which was appeared to be under development in recent weeks, may not be completed given the abovementioned action or it may not be completed in a classic manner meaning that price would simply trade sideways below the rising resistance line re-testing it over and over again after finally declining. Either way, further consolidation is possible but it seems more likely that declines will be seen with an eventual break below the 200-day moving average support level.
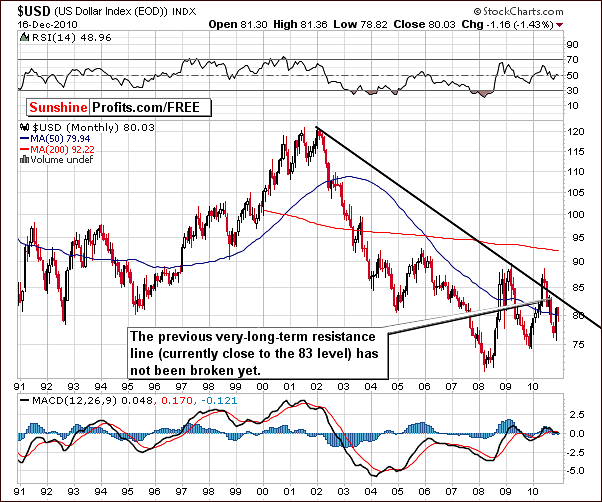
The very long-term USD Index chart, which spans nearly 20 years, allows us to truly put 2010 in perspective. When viewing a short-term chart, the USD Index appears to have rallied to a much greater extent than is seen when compared to prior years. Simply put, the very long-term declining resistance line has not been surpassed in the past 12-months and is still likely to provide strong resistance once it is approached. Although we have seen the USD Index attempt to break above it in early 2010, it failed and soon after that plunged.
What this means is that any rally ahead in the USD Index may not surpass the 83 level, which is where this resistance line currently resides. This is a very probable upper limit for the foreseeable future and is therefore a significant bit of valuable information.
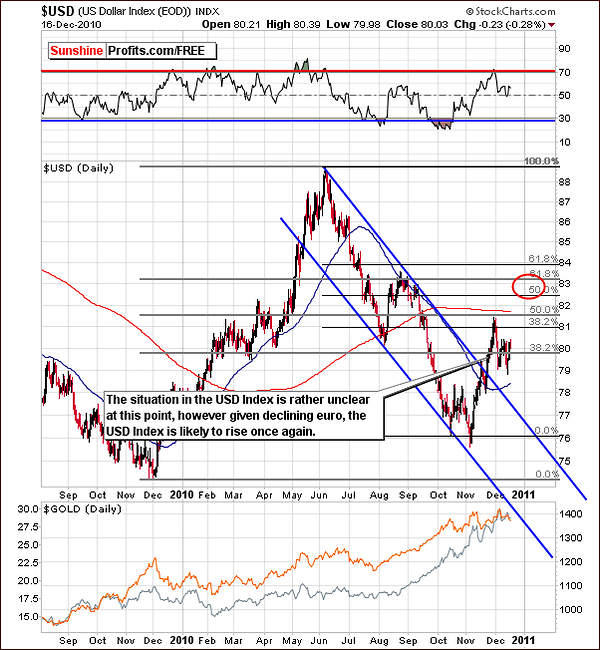
In the long-term chart, it is important to note that the 83 level mentioned in the previous paragraph also includes several retracement levels based on previous rally and decline. The existence of these levels within the same trading range as the long-term resistance line further amplifies the likely strength, which will be seen in preventing any rally from moving higher.
Summing up, if the USD Index continues to rally, it likely to be stopped by the 83 level. Gold, silver and mining stocks, which are priced in US Dollars, move in the opposite direction of the USD Index - unless we see a strong demand from the non-USD Investors. Although the dollar can rally alone, if non-USD demand remains strong, precious metals prices could hold or even increase.
General Stock Market
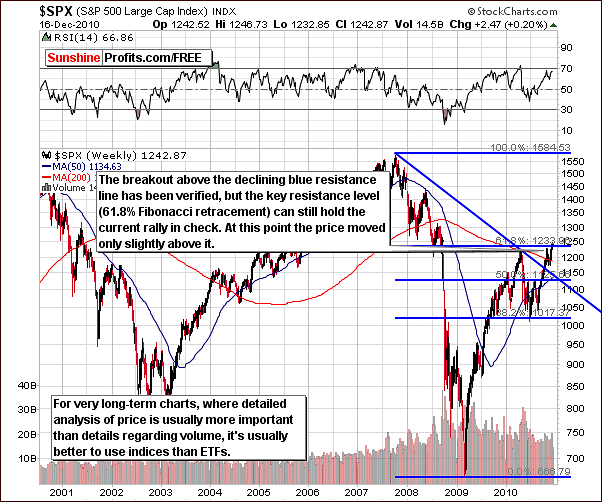
The very long-term S&P 500 chart features the index close to the 61.8% Fibonacci retracement level based on 2007-2008 decline. This is significant and will likely impact stocks for the near –term. Furthermore, the RSI is approaching the 70-level and this is an indication that a consolidation might be in the cards. This is consistent with what has been seen of late and more consolidation appears to be quite possible based on these factors.
Early in 2010, similar situation was identified and we wrote a commentary about the local top possibly being in at that time. This indeed turned out to be accurate but we must stop short of stating a similar opinion at this time. Quite simply, there are mixed signals, which make today’s situation somewhat unclear. More information must be gathered and analyzed for the likely trends to be clarified.
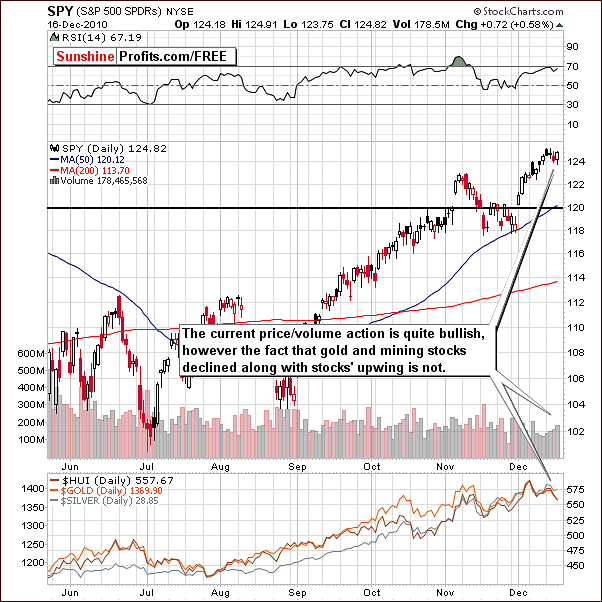
The short-term SPY ETF, which is a proxy for the S&P 500 Index yields some bullish signs on an intra-day basis. Even though price moved only 0.58% higher on Thursday, it rallied on volume that was visibly higher than the one seen during Wednesday's decline. This is a slightly bullish signal.
This situation is not bullish however for gold, and mining stocks which managed to decline, as the general stock market rallied. For precious metals in general, their own resistance and support levels will likely come into play and have a greater impact upon the trends in the weeks ahead, however the very recent lack of reaction to bullishness in stocks is not something bulls should be happy about.
Summing up, the sentiment for the general stock market, though mixed is slightly bullish at this time. More signals are needed to further clarify the likely direction for the general stock market as we close out 2010 and begin the New Year.
The impact upon gold, silver and mining stocks is unclear at this time as their relationship with stocks appears to have reversed lately and now seems to be negative. More discussion of this topic will be seen in the next section of this week’s update.
Correlation Matrix
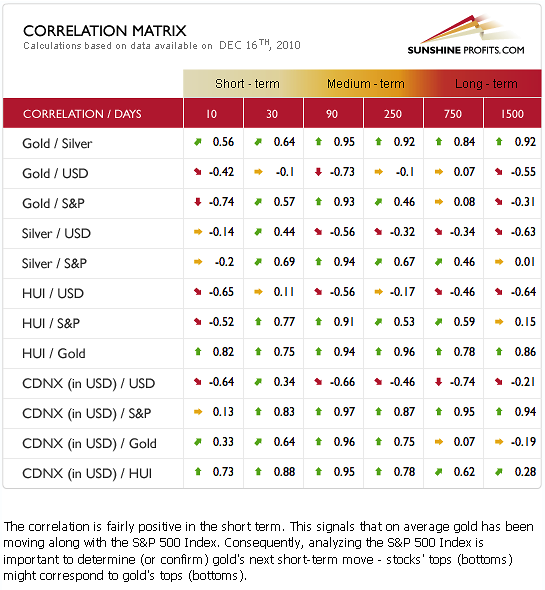
In the correlation matrix this week, gold and the general stock market appear to have a fairly strong positive relationship in the short-term or 30-day column (as described above). However, the 10-day column clearly shows a reversal of this relationship from positive to negative. This can also be seen for the relationship between HUI and silver with stocks as well. Simply put, there are no sure bets at this time as to how precious metals prices will move in relation to general stock market trends.
Much of the lack of clarity across the precious metals sector results in rather weak risk/reward ratios. Sunshine Profits does not favor betting on high-risk moves unless the profit potential truly justifies such action. We believe that speculative capital should be placed in the market when the risk/reward ratio is particularly favorable.
The uncertainty of today is clearly visible when comparing the 10-day column with the 30-day column in this week’s matrix. It seems that an exact turnaround may be taking place in how stocks relate to precious metals. This is quite unusual and increases the risk portion of the normal risk/reward ratio at least for the near-term.
Gold
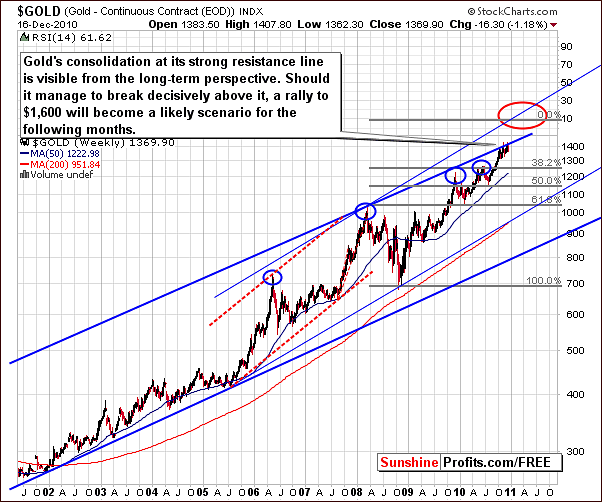
This week’s very long-term chart for gold pricing is once again pretty much unchanged from last week. We have seen some consolidation below the upper border of the rising trend channel. Until this resistance level is taken out, that is, surpassed or broken through, the rally will not move towards the eventual target level of $1,600.
It seems probable at this time that the upper border will stall any rally from here at least on a temporary basis. There is a possibility that gold’s price could decline, perhaps in the range of 5% to 6% possibly declining close to the $1,300 level before we see a resumption of the rally. Once again, it is important to remember that price corrections are normally healthy in most markets and allow for greater strength in subsequent rallies.
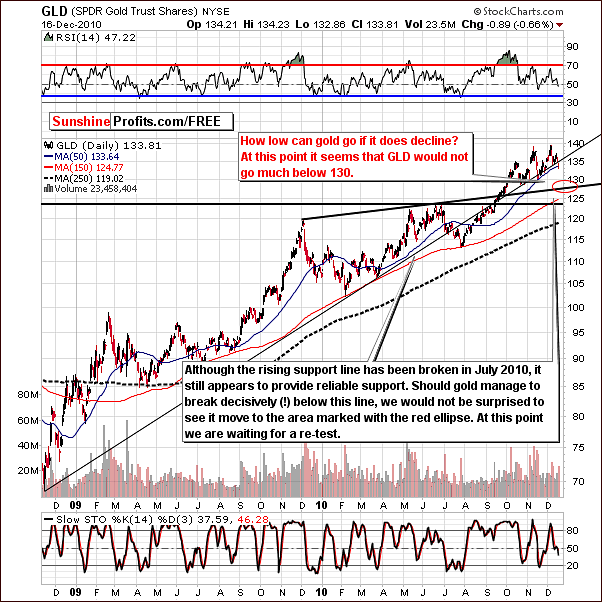
The long-term GLD ETF chart provides a closer look at the current position of gold’s price with respect to resistance and support levels. It can also be seen that when gold’s price declined several weeks ago, it was very quick and was ultimately stopped by the 50-day moving average and its rising support line.
History repeats itself to a considerable extent, so if we had a similar alignment of both support levels and price reached them after a sharp decline, with high probability of being correct we could state that the decline is over. However, at this time the 50-day moving average is below the rising support line, and even though broken though the latter it stopped at the former level (50-day MA). Moreover, the decline has not been rapid.
Consequently, it is possible at this time that further declines may be seen. It is unclear as to whether the current trend is a breakdown or “fake-down".
If gold’s price continues to decline or moves higher in a profound manner, our view concerning speculative capital could change. At this time however, we are not advising that new speculative positions be opened. Downside target levels remain around the 127-level for GLD ETF, which corresponds to $1,300 for spot gold.
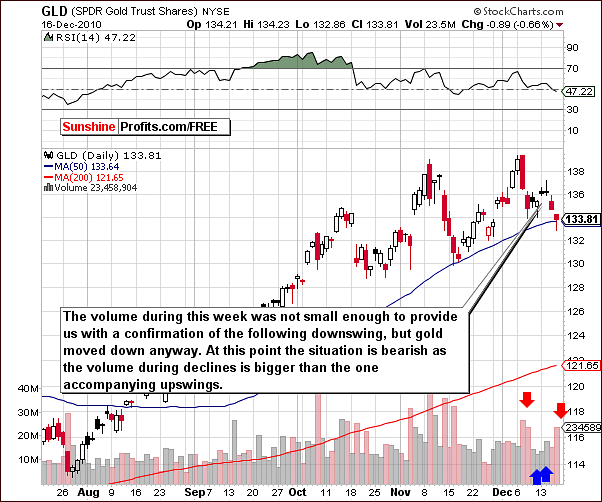
We turn now to the short-term chart, which, as usual, we will use for the analysis of volume levels. Recall that last week we were watching for price level increases on small volume, which would be a sign that a possible short opportunity existed. This situation did not materialize as prices moved higher on increasing volume. Although we had a reversal of the very short-term trend, it was not profound enough in nature to warrant an opportunity to short the market.
Betting against a major trend in any market is always a very risky undertaking. For this reason, we are very hesitant to recommend such moves and will do so only when conditions are extremely favorable by our standards.
The short-term outlook for gold is bearish at this time; however it is our opinion that it is still not bearish enough to open speculative short positions. If the 50-day moving average provides support, a quick rally may be seen from here. If a rally is seen with relatively small volume, it is likely that the risk/reward ratio will improve greatly and perhaps our advisory opinion will change at that time. Sunshine Profits will continue to monitor this situation closely and report to you accordingly.
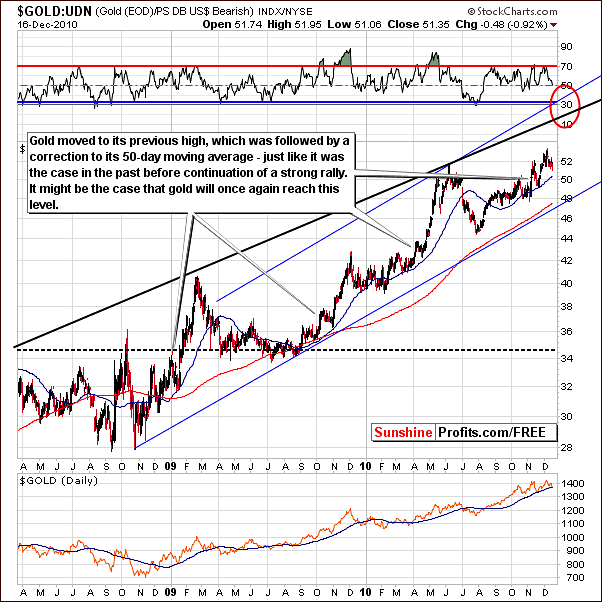
Our final gold chart this week is the gold:UDN ratio chart, which monitors gold from a non-USD perspective. Some consolidation has been seen here and prices have declined slightly. It is probable that from a non-USD perspective, the days ahead will see some sideways movement or perhaps a slight decline to levels in the range of 50.5. This will likely signal a local bottom and a rally from this point to the 58-60 level as noted by the ellipse in our chart could very well be seen.
The abovementioned decline would correspond to the previously mentioned decline from the USD perspective (to $1,300 or so), however it could be smaller since if it is accompanied by the rally in the USD Index.
Summing up, the situation for gold is quite favorable for the long-term. Although the short-term is somewhat unclear as of now, the sentiment does appear slightly bearish.
At this time, we do feel that a short-term bet against higher prices is too risky and therefore is not advised. If the risk/reward ratio improves and opening speculative positions appear more profitable, we will advise accordingly. For now however, it seems best that speculative capital remain on the sidelines.
Silver
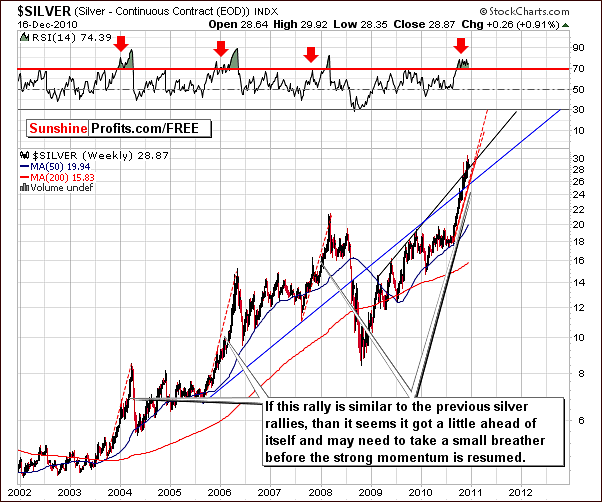
The very long-term chart for silver allows us to comment briefly on the comparison of today’s trends to silver’s 2008 rally. A detailed commentary on this topic will follow in our Letter from Subscribers' section. In short, the rally seen two years ago on a percentage basis seems to indicate that there is a strong likelihood that the $30 level for silver will be significantly exceeded.
A word of caution is warranted here. Once again it appears that silver may have gotten ahead of itself. Of course a correction in silver’s price is healthy for the long-term strength of subsequent rallies. Furthermore, it would provide Investors with an opportunity to add to long positions at lower price levels.
In this week’s long-term chart, some mixed signals are apparent. Silver has indeed held above the rising support level, the red line in our chart, and it remains within the rising trend channel. The latter is illustrated by the two parallel black lines in this week’s chart.
Conversely, note that silver has not been trading above the November intra-day high in recent days. It is perhaps likely that a decline below previous local bottoms could be seen in the near-term. Should that take place, the 50-day moving average will likely once again provide support.
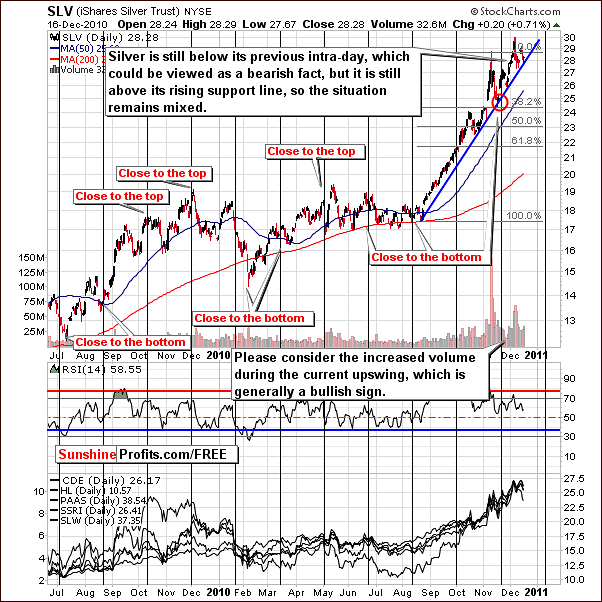
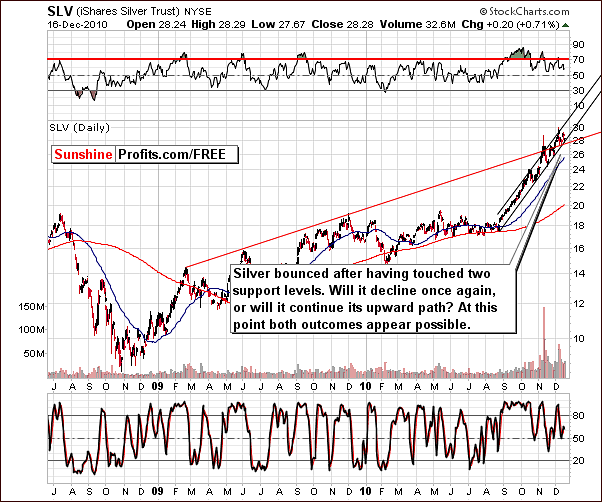
In the short-term chart this week, we see mixed signals one more time. Current price levels are slightly below previous intra-day highs (which is bearish for silver) and slightly above the rising support line (which is bullish).
Gold, silver and mining stocks normally tend to move in similar fashions, frequently reaching local tops and local bottoms together. It is important to watch gold and the other precious metals markets when investing in silver as they frequently impact silver‘s price directly.
Summing up, the long-term outlook for the white metal is bullish although the short-term appears unclear and very much mixed at this time. As the saying goes “when in doubt, stay out“. We do not advise opening speculative capital positions at this time.
Mining Stocks
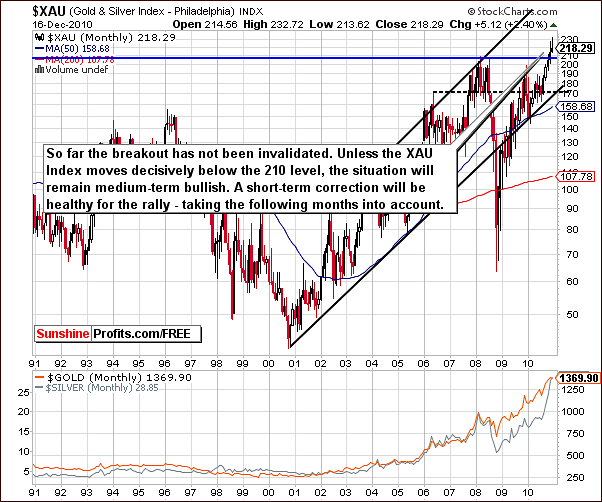
The XAU chart, which is a proxy for gold, silver, and mining stocks is pretty much unchanged from last week. Index level increases seen early in the week were followed by declines as the index appears to be in the process of verifying its breakout above 2008 highs. Should the decline stop somewhere in the range of the 210 level, this would be quite healthy and a strong bullish sign. Furthermore, we would most likely suggest adding to one's long positions in mining stocks at that time.
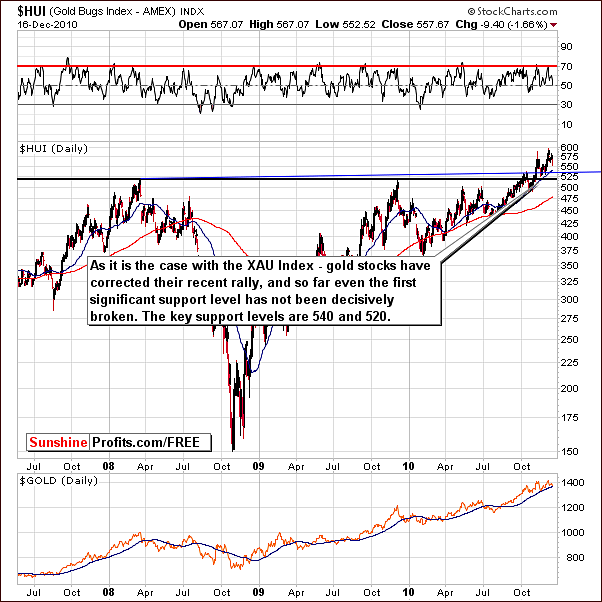
In the HUI Gold Bugs Index chart this week we still have two target levels, which are valid from prior updates. One is at the 540 level and the other at 520 and these correspond to two important support lines. In our chart, one is blue and one is black and at this time it seems that the 520 level is slightly more probable given gold's target at $1,300.
It seems that the best suggestion at this time for long-term investors is to hold present positions. For the short-term, a bet on lower mining stock prices could be profitable but we cannot make such a recommendation until a confirmation of the trend is seen. Simply put, not enough information is in at this time.
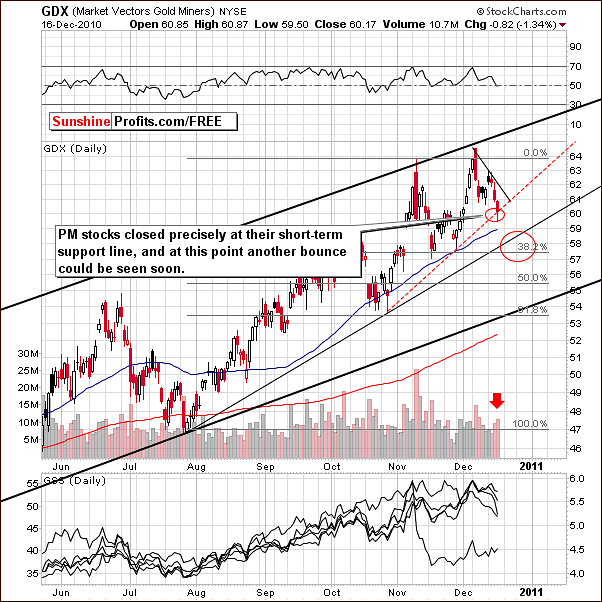
The short-term chart of the GDX ETF, a proxy for the mining is once again our tool of choice for analyzing volume. The rising support line, which is a critical technical analysis tool, is clearly seen here in its true valuable form. Please note where the price closed on Thursday - precisely at the support line.
Recent declines in GDX levels were accompanied by higher volume as compared to days of increasing price action. This is a bearish sign. While the implications are bearish on the whole, the fact that the price has reached its support line suggests that perhaps a quick move up may be seen first.
Very low volume levels, which we would like to see here, would confirm a bearish outlook. So far they have not been seen and no similar sign was visible on the gold market either.
Of course, one does not have to keep a speculative position open at all times. In order to grow your portfolio over time, it is only profitable to do so when the risk/reward ratio is favorable (of course Day Traders will prefer to trade more frequently thus accepting higher risk/reward ratio, but your Editor does not fall into this category). If we move slightly higher from here on very low volume, the big amount of risk will be removed. Although one can say that entering speculative short positions couple of days ago could have been more profitable (stating with the benefit of hindsight), this confirmation can take the risk much lower, so the overall risk/reward ratio will be more favorable.
Summing up, volume levels taken into account along with the direction of price moves are one of the best tools for predicting likely trends for the near term. Only when these two factors align properly the risk is reduced to acceptable levels from our point of view. The situation remains rather mixed, but if the decline continues, it seems that target levels in the 57-58 range for the GDX (Market Vectors Gold Miners ETF) are likely to be seen.
SP Indicators
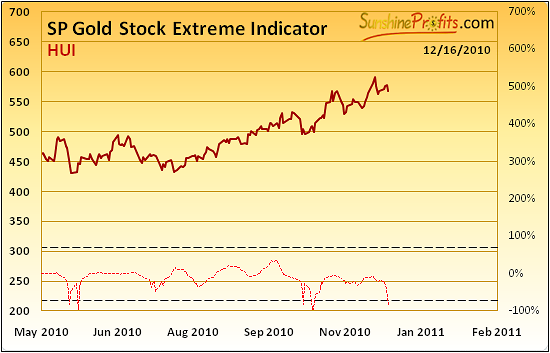
The Sunshine Profits Gold Stock Extreme Indicator signals that a local bottom may have formed (originally this indicator was designed to indicate tops or bottoms (extremes), however in the past several months it used to provide buy signals). Similar signals were seen in May-June and October-November. This December signal indicates favorable days ahead for gold stocks and is a short-term bullish indicator. Volume and price action will naturally clarify this as high volume on rising prices would confirm that a rally has begun.
The suggestion here is that the bottom is in but recent volume levels do not support this theory. It is therefore a very mixed situation at the present time and we will monitor the market for additional information in the days ahead.
Letters from Subscribers
This week we would like to begin with couple of questions related to UK market.
Let's start with a question about the PHPP ETF and its low volume exchange of around 2,000 units a day. Is this a reason for concern? How is PHPP compared to the other ETFs (GLD, CEL, PHYS)?
PHPP trades in a similar fashion to the GLD ETF, but it is less liquid. As an ETF it is guaranteed by the market animator that it will track the prices of metals. However since the liquidity in PHPP is lower than the animator may need to be "animate" the market more often, and it is likely that it will result in higher expense ratio for this fund than it is the case with GLD. As it is the case with GLD - the only advantage over other funds mentioned previously is that it is a convenient for Traders. However, PHPP doesn't appear to be better than GLD.
Additionally, PHPP does not only track gold, but also silver, platinum and palladium. While we have nothing against silver here, platinum and palladium may underperform gold and silver in the final part of the upswing, just like it was the case during the previous bull market, so I would not view them as an advantage. All in all, it seems that other funds are a better proxy for physical metals than PHPP. Still, please note that tax issues might be important here, so we would still recommend consulting your tax advisor before making your purchases.
Another question was related to the daily movements that seem to be dropping outside the US market but picking up during the US market. Could that be a sign that non-US players are being shaken out and the stage is being set for the second act of the double top?
At this point we would not consider these moves as really big - the chance for these moves to be caused by random factors is simply too big. If the situation persists and we see continued weakness when the US markets are closed and strength when they are opened we will get back to this topic.
Another question was about the juniors sector. Namely, when does a stock become eligible to come off the pink sheets? One of our Subscribers further explained that it would make it a lot easier to buy and sell. The question specifically addressed the Great Panther Silver Ltd.
Since there are many factors that are important as far as listing is concerned we've contacted Great Panther and asked them about the status of their application. We believe their reply would be beneficial to all Readers, as it explains not only the GPR.TO situation, but also well (and briefly) explains the whole process, so we will quote it below.
Great Panther Silver has recently met the requirements to support a listing on the NYSE Amex and we are proceeding with our application. We hope to complete this process during the first quarter of 2011 and expand our reach in the US investment community.
(...)
With regard to the pink sheets clearing symbol GPRLF, Great Panther does not support this listing. In other words, we are not involved with the pink sheets or this listing. Any broker/dealer in the US can list a public company on the pink sheets and become the market maker for trading shares of that company. It’s not a matter of being eligible for a pink sheets listing or being eligible to be removed. I expect that once we secure our listing on the NYSE Amex, trading through the symbol GPRLF will diminish to the point where whoever is currently making that market, will no longer see any benefit and trading in the US will be through the one listing we will support: the NYSE Amex.
Finally, we would like to discuss silver's rally, and the way it could resemble the 2007-2008 one.
Examining the silver's recent performance against its performance at that time shows a similar pattern. The rally began just below the 50-day moving average and then soared using the 21-day moving average as support, which it touched three times before making the first of the famous double top. The 2008 top consisted of a first high, a consolidation above the 21-day moving average and then a second top that equaled the first. If this pattern repeats itself today, we would be experiencing the consolidation between the tops and could expect the second top to match the first very soon. In terms of gains, the current rally has yielded a 70% gain from its start at $18, whereas the 2008 rally yielded 53% from $14.
These points are very well put; however, we have another opinion regarding the biggest assumption in this equation. We believe the 2007/2008 rally actually began in August (and lasted until March) and not in December.
Both interpretations (of when the rally began) appear equally correct if one takes a look only at the silver market. However, if we consider what happened in gold, we believe it further strengthens our point of view of the September - March analogy.
In the gold market the 2007-2008 rally began when gold was close to its 200-day moving average (in August 2007), which would correspond to late July 2010. In December 2007 gold was much above its 200-day moving average and gold consolidated during the final months of the year. We can see the same thing today. Additionally, gold has touched its 200-day moving average during this consolidation, which was the case also during the late- 2007 consolidation (!).
Summing up, in our view it is more likely that we are seeing a short-term consolidation right now rather than a beginning of a long-term one. We will continue to monitor for signs suggesting otherwise, and we'll report to you accordingly.
Summary
The past week has failed to provide clear signals in most markets worldwide. Perhaps the uncertainty of the financial stability of several European countries further compounded by normal holiday and year-end influences have thus far made December a difficult month to read.
Although the trend for the USD Index appears to be up, the impact upon gold, silver and mining stocks is quite unclear. It seems there are mixed signals for precious metals though overall a slightly bullish sentiment prevails. A major change could be seen in the relationship between stocks and precious metals. The situation is therefore complicated by stock market uncertainty as well as the possibly changing relationship they have had with precious metals.
One thing does appear to be somewhat clear at this time. It does not seem to be the right time to open speculative positions in gold, silver or mining stocks, simply because the risk/reward ratio is not favorable enough. Ultimately, the goal of trading/investing is to grow one's portfolio, not to have an open position at all times, thus choosing only the best trades is the priority. We believe that long-term precious metals investments should be held as we move through this period of uncertainty.
A note about next week’s Premium Update: due to the Christmas holidays, our next issue will be published on Wednesday, December 22, two days ahead of schedule.
This completes this week's Premium Update.
Thank you for using the Premium Service. Have a great weekend and profitable week!
Sincerely,
Przemyslaw Radomski

