
We picked up the Asian addition of The Wall Street Journal this week and on the back page was an article titled “China reveals Huge Appetite for Gold.” The article states: Gold’s record rally has been attributed to everything from worries about inflation, the dollar and the emergence of exchange-traded funds. One big factor many may have missed: huge buying from China.
We haven't missed it. We have been alerting our Premium Service Subscribes several times in the past to the rising Chinese demand for gold.
It used to be that America was the New World and Europe was Old. Now they both look frayed around the edges and the New World label seems to belong to China and other emerging market economies. This new growth has been accompanied by a voracious appetite for the yellow metal.
Data cited last week by China's state-run Xinhua news agency showed that China imported 209.7 metric tons of gold in the first 10 months of the year, a fivefold increase compared with the same period last year. This is interesting. China is now the world’s biggest producer of gold and consumes all its own production. China's booming mining industry produced 277 metric tons of gold so far this year, up 8.8% from the same period last year. This means that in addition to buying up everything from local production, they are also importing a hefty chunk for a total of at least 486 metric tons so far. Without a doubt, a good portion of this gold is finding its way into the vaults of the People's Bank of China gold reserves. Keep in mind that in April 2009 the People's Bank of China announced that it had added 400 tons to its reserves for a total of 1,054 metric tons making China the world's fifth-largest holder of gold, just ahead of Switzerland, and among the six nations plus the International Monetary Fund that have reserves of more than 1,000 metric tons.
Gold an Attractive Place to Park Renminbis
Over the past several years, China’s money supply expanded by over 50%, due to a massive lending boom that helped generate record GDP growth. That boils down to a lot renminbis searching for somewhere to go. The Chinese are just as worried about inflation and the erosion of the value of paper money as the rest of us. They have been looking for tangible safe investments in which to park their cash. Their problem is that as individuals they are limited in where they can invest. Capital controls restrict investment opportunities for individuals abroad. In China they can place it in a standard bank account and receive a negative rate of return, given an inflation rate running at about 3%. They can also invest in the stock market, but Chinese equities are much more volatile than those in developed markets, so that carries some risk. That leaves real estate, gold and other tangible assets.
Two things happened at about the same time recently. On the one hand the real estate market was beginning to look like a bubble and the government made all out efforts to slow it down, and on the other hand, the gold market opened up for Chinese citizens.
The WSJ notes that up until a few years ago China’s gold market was strictly controlled by the central bank, which bought all the gold mined domestically and then sold it to jewelry makers. Recently, the government loosened restrictions on buying, both by individual and institutional investors. Just this August China began allowing more banks to import and export gold, opening up the gold market to the institutions and their clients. Last week the Chinese approved the country's first gold fund designed to invest in overseas listed gold ETFs. This year many Chinese investors added gold to their portfolio and at the Shanghai Gold Exchange, trading volume rose 43% to 5,014 tons in the first 10 months of 2010.
Government Controls Created a Lot of Latent Demand
There is a lot of latent demand for gold. It was only in 2003 that gold ownership was made legal having been banned by the Communist government since 1945. Individual Chinese investors couldn’t participate fully in the gold market until certain structural changes had been made, including establishing the Shanghai gold market and a system for banks to distribute gold, at first in the main centers for the newly wealthy, then through the select top five Chinese banks. Today all the banks are allowed to distribute gold.
The World Gold Council estimates that China’s gold demand could double in 10 years as more investors in the growing middle class embrace precious metals.
Just last month a top Chinese official suggested that the U.S. should cut its government spending and sell some gold reserves to balance its budget and fund its recovery. Perhaps China would like to get its hands on some of that Fort Knox gold (if it exists). It’s certainly worth more than the mountain of paper they are holding.
On Another Subject—John Lennon
Wednesday was the 30th anniversary of the night when John Lennon was shot and killed outside the Dakota apartment building on Central Park West. We remember his humanity, his wit, his voice. Strangely enough, the lyrics and the songs that he wrote (with a bit of a stretch) seem to fit these (economic) times.
How about the Lennon song that could be a theme song for the Federal Reserve:
Living on borrowed time
Without a thought for tomorrow.
Or this classic song that could be a ringtone for Ireland, Greece, Spain, etc.
Help me, get my feet back on the ground,
Won't you please, please help me.
And this song seems to sum up the economic situation as a whole:
Nobody told me there'd be days like these
Strange days indeed -- strange days indeed
This week we have sent out a Market Alert along with a follow-up and you are probably eager to hear more in-depth analysis than we can offer in an Alert, so let's begin this week's technical part with the analysis of the currencies. We will start with the short-term Euro Index chart (charts courtesy by http://stockcharts.com.)
Euro - USD Indices
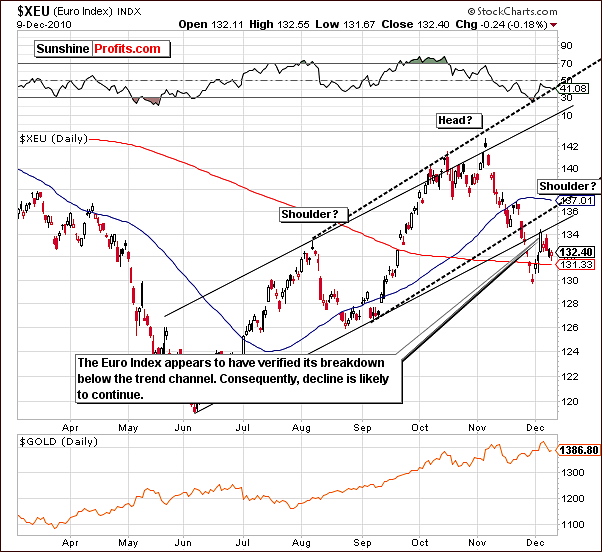
As you may see on the above chart, the recent breakdown has been verified as the index moved below the rising border of the long-term trading channel. The next move was up to $134 or so before another decline was seen once again. It appears likely that this downtrend will continue and the previous low (130-level) seems a reasonable short-term target level for the next bottom.
The bearish head-and-shoulders pattern may very well be under formation with a July-September left shoulder, a September-November head and a December right shoulder. This is bearish news for the index and bullish news for the USD Index due to the euro’s weakness. As the saying goes “Currencies don’t float, they just sink at different rates”. For the time being, the euro will likely sink faster than the dollar and this makes the USD Index appear stronger. All in all this is bullish news for gold. As far as euro is concerned, we will be able to provide you with a more detailed target, when (if) the right shoulder part of the pattern is complete.
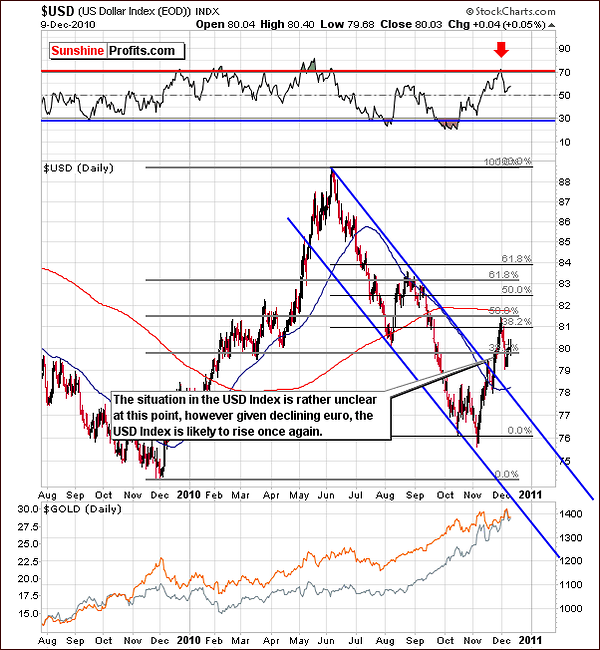
The long-term USD Index chart yields rather mixed signals this week. The resistance level was reached last week with a decline seen in subsequent days. There now appears to be a pause in this decline and from a technical point of view, the situation is unclear. A move in either direction is possible. Since the euro is weak, the outlook for the USD Index is thought to be slightly bullish at this time. The implication for gold, silver and mining stocks are slightly bearish because of this and also for reasons, which will be discussed in later sections of this update.
Summing up, the USD Index is slightly more likely to rally than to decline due to the weakness of the euro. The implications for precious metals are not profound, as will be explained in the Correlations section of this update.
General Stock Market
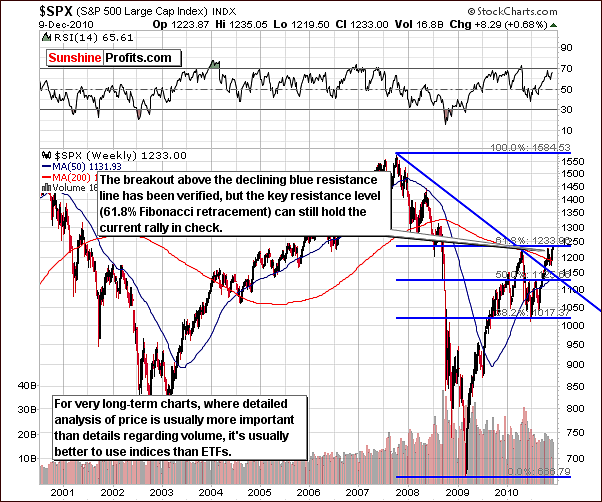
The long-term SPX S&P 500 chart is at a key resistance level. The 61.8% Fibonacci retracement level may very well provide strong resistance and hold this rally in check. Although a breakout above the declining resistance line has been verified, no bigger rally is expected until a verified move above the 61.8% resistance is seen. Until such time, declines or sideways price movement are likely.
Precious metals may very well be waiting for this breakout and a rally for stocks could bode well for gold, silver and mining stocks. In the Correlation section, further details about the recent strong link between stocks and precious metals will be discussed. For the short-term however, the situation does not appear favorable for either group, as you may see on the chart below.
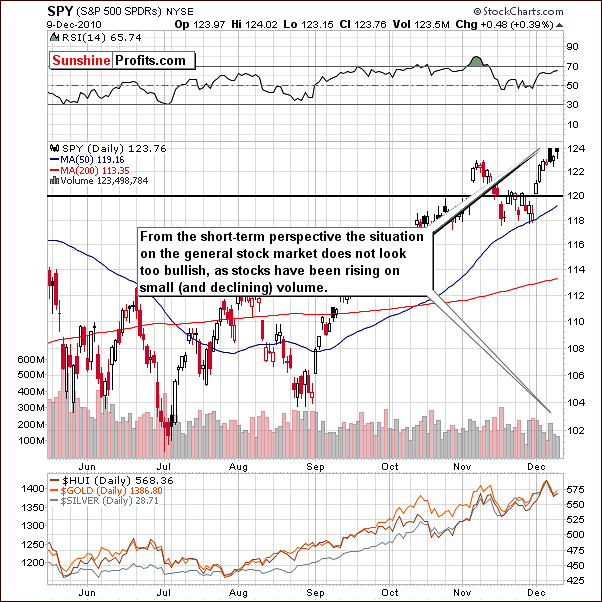
The short-term SPY ETF, a proxy for the S&P 500 provides little bullish news this week. The recent slight rise was accompanied by low volume and this is a bearish signal. With strong long-term resistance level currently in play and volume levels where they are, a move up from here appears unlikely. It seems that consolidation or some sideways price action around the 122-level is most probable for the near-term.
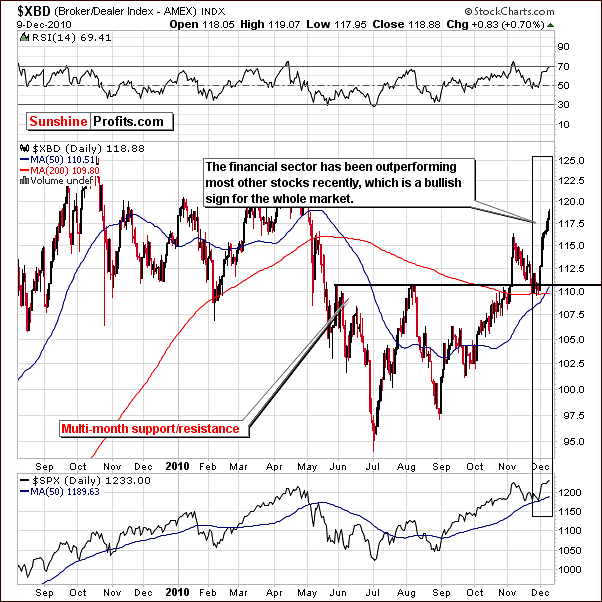
The XBD Broker/Dealers Index gives a glimpse as to the strength of the financial sector. With their outperforming stocks in general recently, the implication here is bullish for stocks. As a whole, the financials have lagged the general stock market in 2008. In fact, the market decline earlier this year began with this group. A rally in the financial sector may simply lead to a general rally overall for stocks. It is important to note however, that the breakout for stocks may be a week or a few weeks away and without a general stock market rally; the precious metals sector will likely see declines very soon.
Summing up, the general stock market is at the 61.8% Fibonacci retracement level and much depends on whether this resistance level can be broken. Indications are that a move above it may not be seen for some time and this would have bearish implication upon gold, silver and mining stocks as they have been highly correlated with stocks in recent weeks.
Correlation Matrix
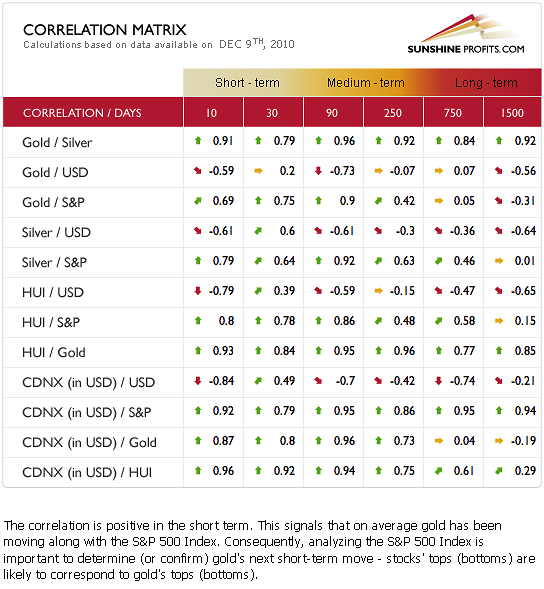
Based on the analysis of the above values, we infer that it is the general stock market that is the main driver of the short-term price swing in the metals markets. There is a high correlation for the metals and the general stock market in 90-day, 30-day and 10-day columns. The situation for mining stocks is similar. This correlation is significant even from the 250-day perspective, which means that both short- and medium-term price swings in gold, silver, and mining stocks are likely to take place along with similar actions in the main stock indices.
The USD influence on precious metals is unclear at this time. The 90-day column is negative (metals are USD weakness driven), 30-day column is positive (metals are euro-weakness driven in the short-term), and 10-day column is negative once again.
Summing up, at this time, the sentiment is slightly bearish because of the situation on the general stock market. The influence of the USD Index is unclear at this point, which combined with the unclear situation in the currencies themselves leads us to focus more on the general stock market than on the USD Index while analyzing the precious metals market.
Gold
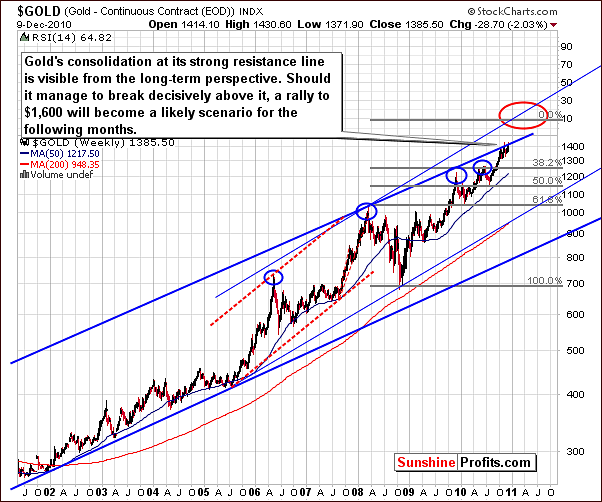
This week’s very long-term chart for gold is virtually unchanged from last week. In our last Premium Update we stated that the consolidation period is now visible here as it has been ongoing for nearly 2 months. It began back in October after gold reached the upper border of the very long-term trading channel. It is possible that we will now see gold’s price break out above recent price levels and the $1,600 target level remains valid. This target is obtained by analyzing the 1.618 phi number and extrapolating the upper border of the accelerated trading channel.”
Although there were no visible changes in this week’s chart, we have included it in order to allow everything to be viewed in its proper perspective.
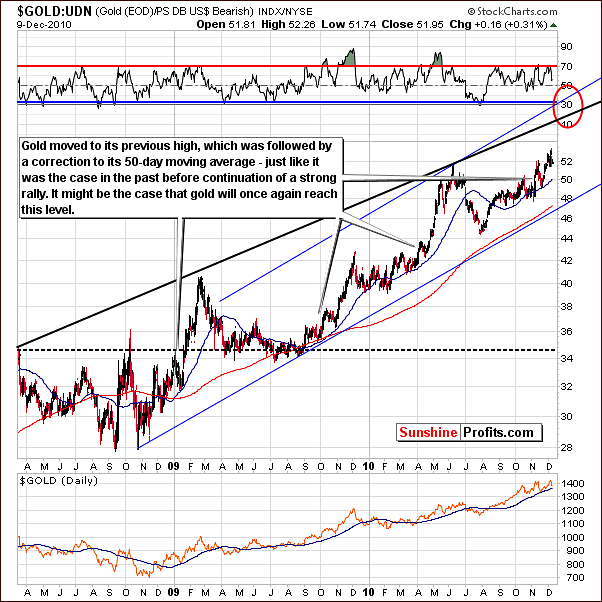
The long-term Gold:UDN chart shows the ratio obtained by dividing gold by an ETF, which moves in the opposite direction of the dollar. It shows what gold times the USD Index would look like. We could also say that it shows gold’s price movement in euros or pounds, but it is in fact an average of gold priced in all other currencies.
The ratio itself has declined slightly but is not yet at the support level, which in this case is the 50-day moving average. This leaves open the question of whether gold has reached a local bottom yet. This ratio recently moved above its previous high and could now be in the process of verifying the breakout. The current move down could be also viewed as another correction during which the ratio moves to its 50-day moving average (marked with the blue slope on the chart). This support level is currently around the 50 level, and a move to it would suggest another decline in gold similar to the one which we've seen this week.
Consequently, we remain neutral regarding entering this market with speculative capital, as the situation is too unclear at this time. Additional charts in this update will further explain this situation.
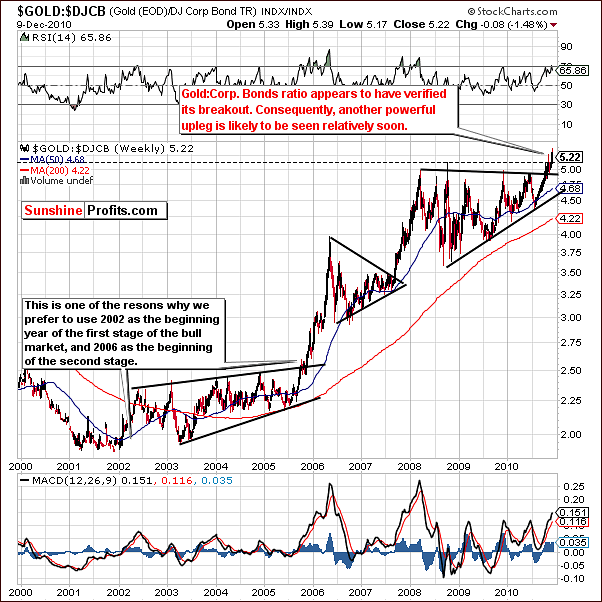
The final very-long-term chart this week is the ratio of gold to corporate bonds. Here, we clearly see the distinction between long-term consolidation and long-term rallies. Once a consolidation has concluded, the breakout is generally quick and sharp to the upside. Of course, the rallies in the ratio correspond to the major rallies in gold itself, which is why it is important to analyze it today. We have seen the aforementioned rallies on two occasions both in 2005-2006 and again in 2007-2008.
Based on prior trends, if this ratio breaks out above the resistance line, a bigger rally is likely to be seen. It appears that we are in such a situation today. There is a strong likelihood that once the consolidation is over gold may very well rise to the $1,600 level.
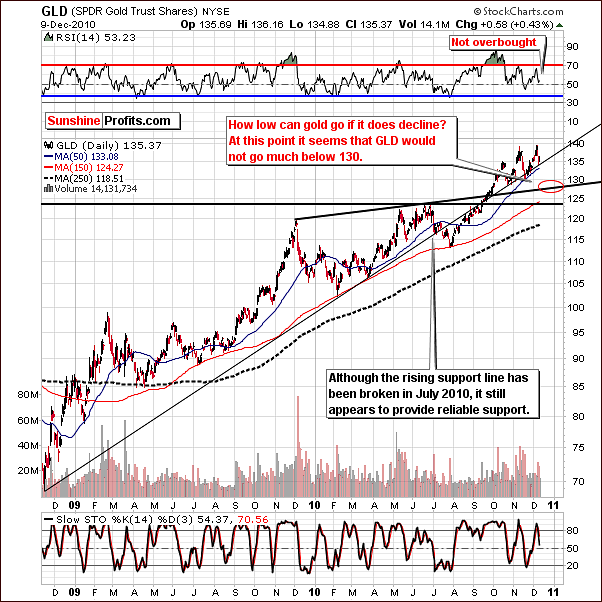
Zooming in slightly allows us to estimate the probable downside target level if the decline is to continue. Based on recent price movement and historical trends, a decline here could possibly be seen to the $128 level. This would correspond to a spot gold price close to the $1,300 level.
Strong support levels are found close to these targeted bottoms. However, due to the lack of clarity at this time, it is advised that new speculative positions not be opened at this time.
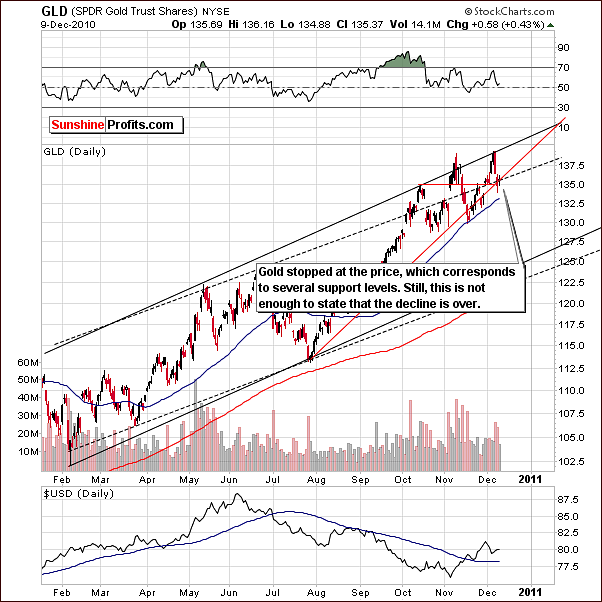
Zooming further allows us to see that several support levels have together stopped a recent decline. This could be interesting phenomenon to those, who still doubt the usefulness of the analysis charts from the technical perspective. Volume levels have been higher on the downside and since the recent decline was quite small, it seems appropriate to wait for additional signals before any bullish sentiment surfaces.
Speaking of volume, in the latest Market Alert we've mentioned that small volume during an upswing would be a bearish confirmation, which could result in another Alert with suggestion to short gold. Consequently, we have decided to provide you with a chart dedicated specifically to the analysis of volume.
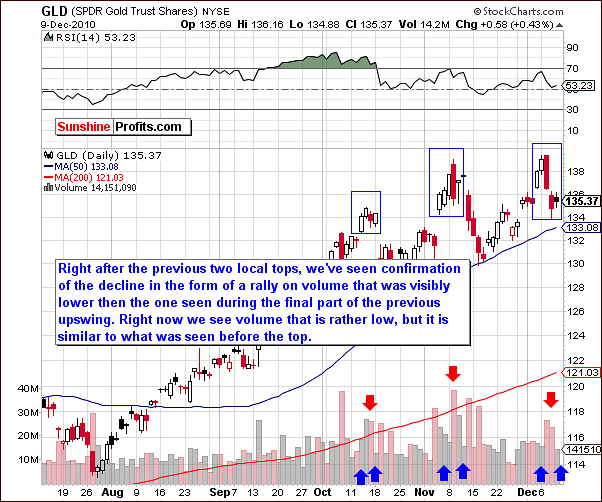
Please take a few moments to analyze the above chart; the two previous local tops had similar volume trends. Namely, lower volume levels were seen immediately after the upswing had ended. The important thing is that they were lower than the volume accompanying the rally that took gold to a particular local top.
Generally, the volume was not high on Thursday, however it was not lower than the one seen right before the top, and it was not seen along with a rally - the 0.43% move is more of a pause than it is a rally.
It appears that another rally on low volume is needed to confirm that a period of declining prices will in fact begin. Once this is seen, it will likely be the right time to bet on lower prices and/or to short gold (with one's speculative capital only, of course). Sunshine Profits will continue to monitor the situation and advise our Subscribers as the situation develops.
Summing up, while the bias is slightly bearish, no clear indications are forthcoming today as to gold’s next move. Analysis of volume levels and recent local tops and bottoms as well as the presence of consolidation periods are not providing clear signals at this time. It is likely that the coming days will provide additional signals and allow us to provide advice with regards to speculative capital and likely short-term trends for the yellow metal.
Silver
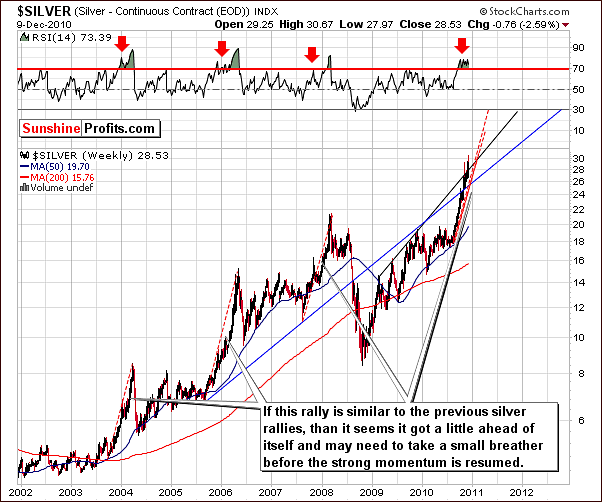
The very long-term chart for silver gives us an indication that once again silver appears to have gotten ahead of itself. We saw this several weeks ago and commented at that time in our Nov 9-th Market Alert - back then a several-dollar decline followed. At this time it appears that the correction is underway and it has indeed been quick and sharp during the past week. Although it is not visible from the very long-term perspective, another quick decline is possible before the rally resumes.
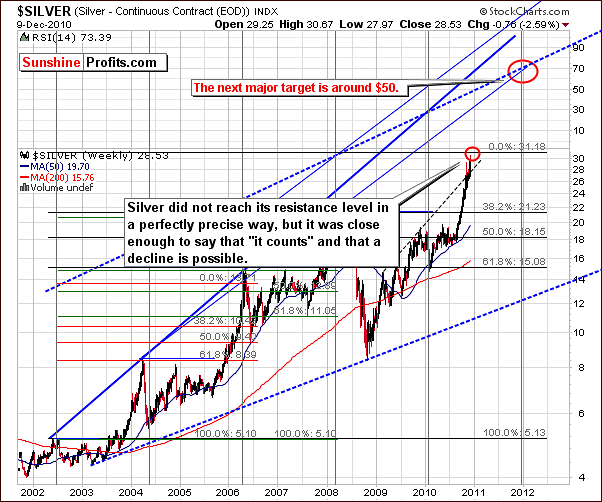
In this version of the very long-term chart, we can see the next target level on the upside to be at $50. In our Market Alert issued earlier this week, we advised entering a stop loss at $29 and this level was reached on the very same day. Silver is now in the process of correcting its previous rally but it is a tough call at this time as to whether further declines will be seen. The odds slightly favor further declines, as the correction is not visible from the long-term perspective.
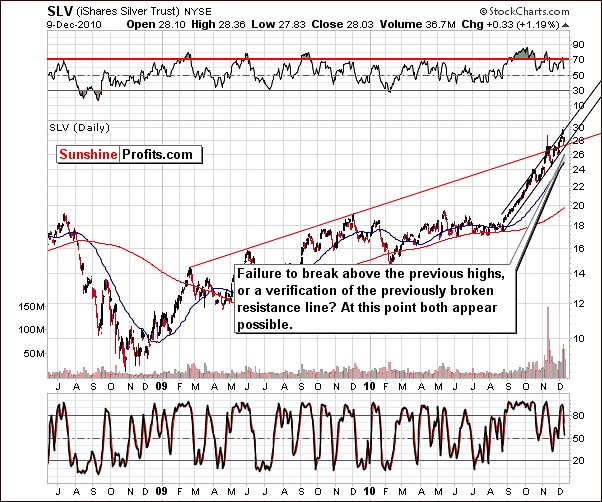
In the short-term chart this week, we can look at silver’s recent performance from two different perspectives. First, we could note the failure of the white metal to break out above its November high. Another way of describing silver’s latest move is that it broke out above the rising resistance level, which has now become a support level. Regardless of which description is chosen, silver is likely to eventually resume its rally, though this may not be seen for a week or two.
Summing up, it is difficult at this time to confidently state silver’s next move. More than likely, much will depend upon other markets and as always these should be closely monitored. Sunshine Profits will continue to monitor the situation and report to you when the future for silver becomes clearer. At this time however, we do recommend holding speculative capital on the sidelines.
Mining Stocks
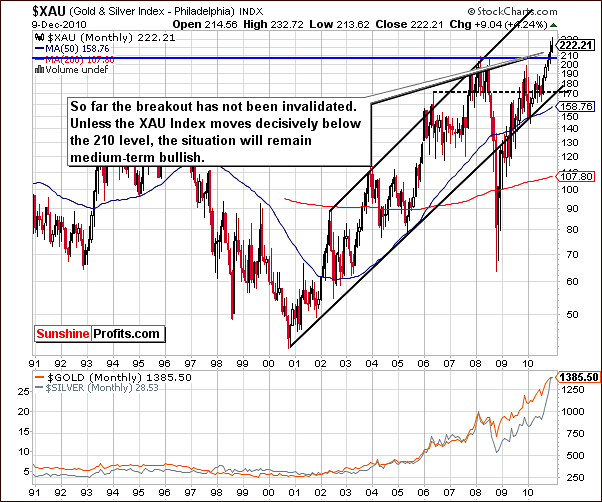
The XAU Index chart, which is a proxy for gold- and silver mining stocks, shows a decisive move above previous highs. The post-breakout correction is barely visible here but a move down to the 210 level would be both normal and healthy at this time. This breather could very well precede yet another rally and unless this 210 level does not hold, the medium-term sentiment for the mining stocks remains bullish.
The HUI Index chart is normally in our weekly update but has been omitted this week because it provides no additional information above and beyond what was seen one the XAU chart above.
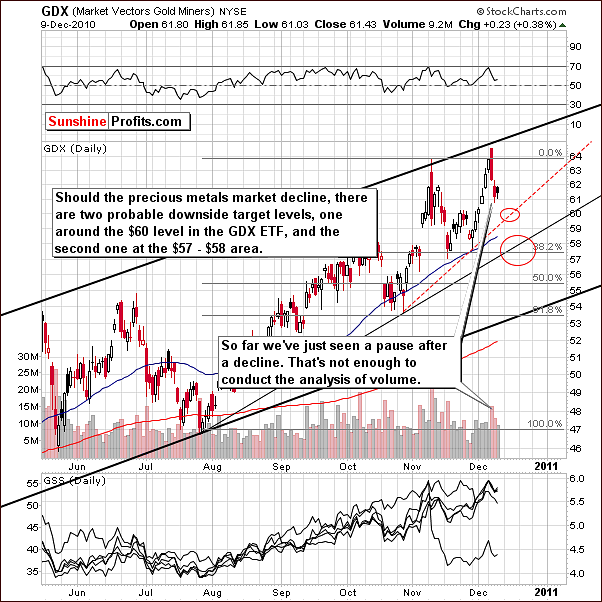
The GDX ETF short-term chart, a proxy for the mining stocks shows a pause in the recent decline. In our recent Market Alert we mentioned that we have been looking for a low volume move to the upside. It seemed as though this was a good possibility at the time and would provide Subscribers with an excellent opportunity to short the market. No upturn has been seen however (the 0.38% move up is more of a pause) and therefore, implications of the volume analysis are not meaningful. The chance to short did not arise yet.
Support levels, which will likely hold on the downside, are at 60 and the 57-58 range. Either of these levels could become the next local bottom for the GDX ETF and a rally from there is quite possible.
Summing up, similarly to the situation in gold and silver, the current environment for mining stocks is somewhat unclear. Once the bottom is in, another rally could quickly follow.
Ratio Analysis
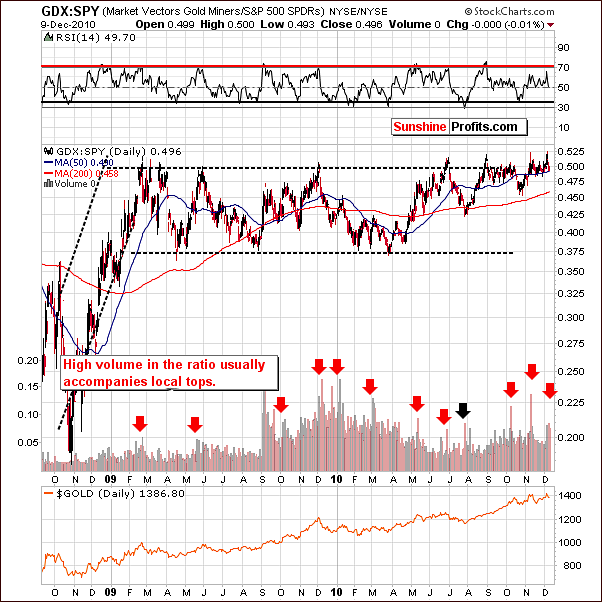
The GDX:SPY is a measure of mining stocks performance relative to all other stocks. We have previously discussed the unique single spike in volume signal as one, which has been extremely reliable in finding local tops in the past. In last week’s Premium Update, we wrote about not seeing the single spike in this ratio. It did not appear that the local top was in. Soon after however, such a spike in volume was indeed seen, and a local top emerged.
Volume levels have been emphasized in the above chart. The high volume levels, which are noted by arrows, are very closely aligned with local tops. This is a clear indication of the importance of volume levels analysis with respect to prices. The suggestion here is for further weakness in the near-term.
The volume spikes are significant not only in the relative performance of the senior sector, but that is the case also with juniors.
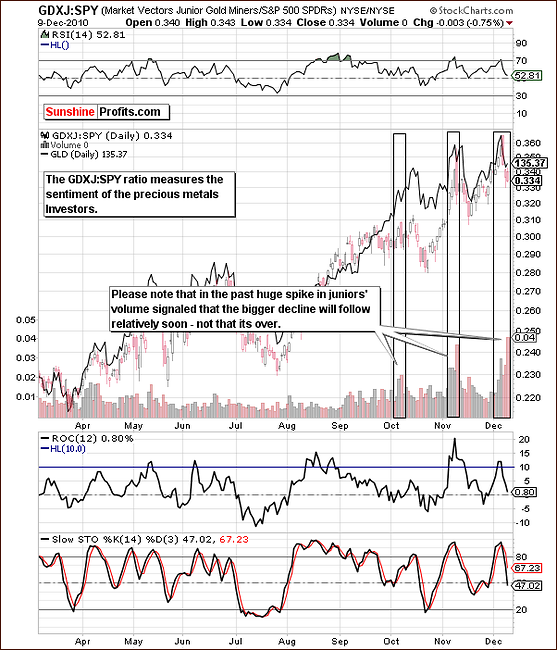
The GDXJ:SPY is a ratio between a proxy for the juniors and a proxy for the general stock market.
The GDXJ ETF is the junior counterpart of the well-known GDX ETF, and its performance relative to other stocks quantifies the part of the performance of junior sector (small-cap, small-volume, early-stage companies) that can be attributed to individual investors' perception of the market.
Most institutional investors are not involved in this market due to company size, monetary constraints, and other regulations. The buying pressures, therefore, lie mostly on individual investors who are naturally more emotional most of the time (!). It is likely that this ratio is very much an emotional barometer of individual gold and silver investors.
Since the general stock market drives the prices of these small cap companies, the ratio is calculated by dividing by the SPY. This isolates the influences of other stocks. If the ratio rises, the indication is that investor's sentiment is high. This, in turn, allows us to analyze moments when the optimism is excessive in order to take the opposite position as it means that the current move will soon end. In this case, it means that everyone, who wanted to enter the market, is already in it and there is nobody left to support further rallies - new capital needs to enter the market if the price was to rise.
Yes, the GDXJ:SPY ratio take the individual investors into account only, and the gold market is driven by many other entities, but - once you take into account the fact that the public enters the market mostly at the end of a given move - it occurs that it doesn't really matter.
While the sentiment is not extremely high in absolute terms (we don't see much gold-related headlines in the major financial portals), on a relative basis we see an upswing confirmed by volume. This could be viewed as a bearish factor.
Namely, volume levels were extremely high on Thursday. This is important to note because in the past, high volume levels such as this have been an indication that downtrends have not yet completed.
Summing up, the ratios point to an overall weakness at this time in the mining stocks and consequently in gold and silver. It is important to remember that profit opportunities may still arise and our continued monitoring will insure that our Subscribers are informed whenever the situation warrants.
Juniors
As stated in the Key Principles section, the list of top juniors will be updated approximately every 4 weeks, so this is the Update that should contain the revised version of the list. However, before providing you with details, we would like to comment on this sector's performance in general.
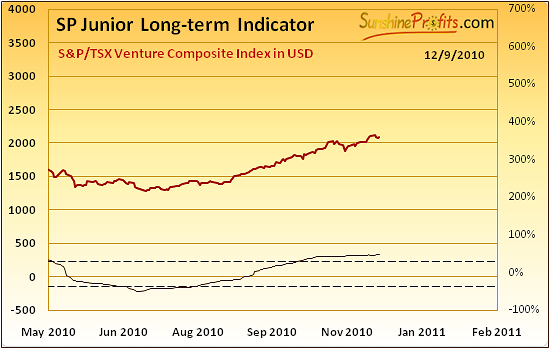
Our SP Junior Long-Term Indicator has been moving slowly higher since July 6th (except a single day downswing which was so insignificant that we specifically advised to ignore it). As of today we did not see a sell signal (suggesting switching from junior stocks to senior stocks) in the form of a decline in the indicator. It is already described in the Premium Charts section, but just in case you did not browse it yet, here's a quick reminder - the above indicator suggests switching from big senior gold/silver producers to juniors if it is below the lower dashed line and starts to rise, and it suggests switching from juniors to seniors if it is above the upper dashed line and starts to decline. It was designed to catch the major moves, not the short-term ones. Please note that juniors (GDXJ ETF) moved over 60% higher since July 6th, while seniors (here: GDX ETF) moved up by only 25% since that time. Consequently, this indicator alone generated substantial value for those who took it into account while making their investment-related decisions.
Right now it is above the upper dashed line, but it is did not start to decline visibly. Consequently, holding juniors still appears a good way to go. The situation could change in case of a plunge on the general stock market - as you may see in the correlation matrix, main stock indices are one of the main drivers of the junior prices.
As far as our top gold and silver junior stocks are concerned, please take a look at the following tables:
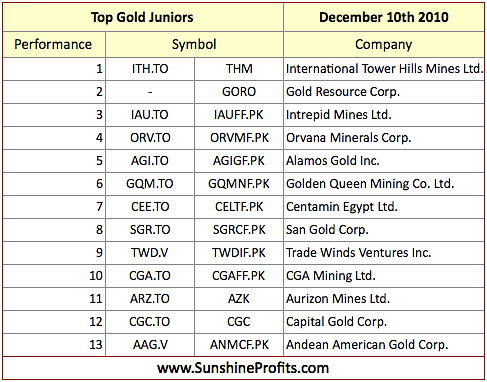
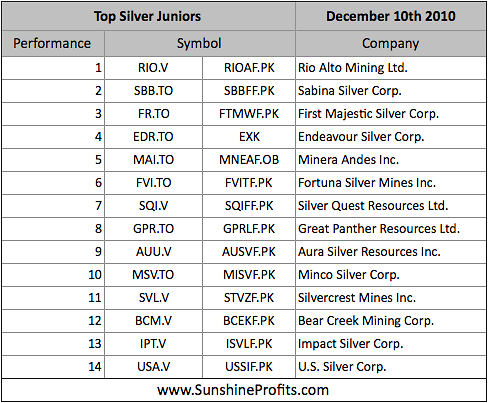
Once again, there are not many changes this month. We've decided to add Minco Silver Corp. to our silver list, however - like it was the case in early November - given the current situation on the general stock market it seems that adding to your junior holdings will be justified only if the general stock market can verify its move higher.
Letters from Subscribers
One of the questions we received recently was about buying gold priced in USD vs. buying gold priced in other currencies. The short answer is that generally, it does not matter much as far as profit and currency risk exposure are concerned. For example, if you live in Great Britain and have British pounds and you want to buy gold, you need to either use your pounds to purchase the gold, or convert your pounds into another currency (USD for instance), which you would then use to purchase the gold.
The bottom line is that you are not holding USD or British Pounds - you are holding gold. When you decide to sell your gold, you will either get GBP or else USD, which you would then need to convert into GBP (since that is the currency that you use for your daily life.) The only difference is that if you use USD for the purchase you will need to buy it and then sell it, paying currency conversion fees for both transactions. If the price of gold in USD terms goes up because the dollar moved down, you would have a gain in the USD, but very soon after you convert your dollars into GBP you would not see this tremendous gain. This is just an example. We believe that in the long run gold is likely to move up in all currencies.
Here is another example (yes, we have featured it previously, but we believe it could still be useful as there appears to be a lot of disinformation on the Internet regarding this topic):
Gold in Euro moves up by 100% from 1,000 to 2,000.
Dollar goes up against Euro from 0.7 to 0.9 (meaning that 1 dollar used to buy 0.7 Euro and now it buys 0.9 Euro).
What impact would that have on gold priced in dollar terms?
At the beginning of our hypothetical case, gold traded at $1,429 (1000 / 0.7) and now it trades at $2,222 (2000 / 0.9), which means that it increased by about 56%.
So - we have an increase in the value of gold in both: USD and EUR, which means that gold increased its value against the U.S. Dollar while the Euro decreased its value against the U.S. Dollar.
Of course, the numbers above are hypothetical, and everything depends on the sizes of the respective rallies/declines, but the above example clearly shows that a decrease in the value of the Euro (against the dollar) does not need to translate into a lower price for gold.
At the moment, it is not surprising to see European investors purchasing gold in response to their economic problems. Yes, there will be investors willing to purchase dollars as a safe-haven, which we found ironic when we first commented on it several months ago. We still find it ironic bordering on foolish. On the other hand they will be some savvy Europeans willing to purchase gold and silver.
Second question we would like to answer was about a few PM stocks that spiked on price and volume during the last hour of trading on Wednesday. Could this be a bullish signal?
Generally yes, because it signals that the demand has just picked up strongly and these stocks did not rise further just because the session has come on an end. Consequently, it will be likely that these stocks will rise at the beginning of the new session. Other implications would depend on the bigger picture - what type of stocks were they juniors or seniors? How did they perform previously relatively to other gold and silver stocks? What is the overall tendency in the precious metals market and other markets (currencies, main stock indices, other commodities), ratios, etc.?
Summary
Signals this week from the USD Index are mixed though slightly bullish. It seems to be quite the opposite for the general stock market whose mixed signals are slightly bearish. Gold, silver and mining stocks await signals from the general stock market as they have been highly correlated of late.
If stocks break out above their strong resistance level, precious metals will likely rally as well. If the breakout is not seen, lower prices are probable for gold, silver and mining stocks.
More signals will likely be received in the days ahead and will provide clarity to a situation, which is very mixed and somewhat unclear today. The bearish confirmation in the form of a rally on weak volume remains to be seen. We will continue to monitor this situation and report to you accordingly.
At this time, long-term holding should be held and speculative positions should not be opened until more information is available.
This completes this week's Premium Update.
Thank you for using the Premium Service. Have a great weekend and profitable week!
Sincerely,
Przemyslaw Radomski

