
There is a good reason why the U.S. government prints the phrase “In God We Trust” on the currency. You have to have faith that the pieces of papers you carry in your wallet have value and that you can exchange goods and services for those bits of paper. Fiat money is not "backed up" by anything; intrinsically it is useless paper (nowadays not even that, but mere electronic bookkeeping entries). It is valuable only as far as people believe in its anticipated purchasing power.
When a few weeks ago the US Federal Reserve said it would create another $600 billion to buy US Treasury debt, that made a total of $2.3 trillion added since the Fed began its QE program almost two years ago. In terms of simple math, Ben Bernanke has added three times as many dollars to America’s core money supply as all the previous treasury secretaries and Fed chairmen put together.
To create fiat money all you need is ink, paper and the printing press. Gold, on the other hand, requires gold mines, workers, expensive equipment and time. There will never be limitless, unending supplies of gold.
When money was made of precious metals, governments could debase it by reducing the quantity of metal in the coin. The introduction of paper money provided governments with a cheaper, easier, quicker method of debasing the value of the currency. From Roman times to the 17th century, when paper money in various forms begins to come into play, the history of coinage is a story of debasements, or the continuous reduction of the metallic content of the coins and a corresponding increase in all commodity prices.
History is replete with examples of the punishments meted out by governments to those who refused who accept government money. Thirteenth century Chinese law made the rejection of imperial paper money punishable by death. The penalty for refusing French notes was punishable by twenty years in prison. Early English law punished repudiation of currency an offense against the dignity of a reigning sovereign. At the time of the American Revolution, non-acceptance of Continental notes was treated as an enemy act.
Government monopoly of money goes back to the dawn of history. The Greek philosopher Diogenes as early as the 4th century BC, is said to have called money the politicians' game of dice. Over the centuries, governments conducted various experiments with alternatives to gold. Paper was particularly promising since you could produce it cheaply and put as many zeros on it as you want. But inevitably, the experiments all ended badly.
Too much of a good thing is not so good. Too many dollars in circulation can cause inflation and the debasement of the dollar. This is even true when it comes to precious metals. The Spanish monarchy learned this lesson the hard way. After the discovery of silver in the New World, convoys of hundreds of ships transported tons of silver to the Spanish crown. The Spanish dug up so much silver, that the value of the metal itself declined in value causing inflation in the price of goods. All the silver of the Americas could not save Spain from economic decline.
The U.S. dollar has lost around 33% of its value in the past 10 years. This decline took place because the world is waking up to the awful realization that America has borrowed and spent its way into a hole. Meanwhile, gold has climbed from $300 per ounce to over $1,400 an ounce.
How did the U.S. dollar become a reserve currency?
At the time that the Bretton Woods agreement was signed towards the end of World War II, the U.S. was the mightiest economic and military power. And so it was decided that the other countries would use US dollars as their "reserves."
What does that mean?
The Bank of England, or the Bank of Germany, etc., issue their own domestic currencies, but maintain stockpiles of US dollars, with which they could regulate the value and fluctuations of their own currencies. (This was before the Euro supplanted national currencies.) If the French Franc were to depreciate against the US dollar, for example, then the Bank of France could use some of its dollar holdings to buy francs, thus bringing up the value of the franc back to the required target. This way, investors and business people across the globe could feel comfortable with their French currency, because the franc was tied to the dollar and the dollar was tied to gold. Any central bank could redeem its dollars for gold from the U.S. at the fixed rate of $35 per ounce, that is, until Richard Nixon severed the dollar’s tie to gold in 1971.
Once the dollar was no longer tied by the peg to gold, the Federal Reserve began printing money, lately with reckless abandon.
So, it is not that surprising that several weeks ago, at about the same time that the Fed announced its $600 billion injection, that the World Bank president Robert Zoellick suggested some sort of role for gold in world currency. We covered this in depth in the November 12th issue of the Premium Update.
He suggested that the G20 should build a new system that would include a basket of currencies such as the dollar, the euro, the yen, the pound and the renminbi.
The system should also consider employing gold as an international reference point of market expectations about inflation, deflation and future currency values. Although textbooks may view gold as the old money, markets are using gold as an alternative monetary asset today.
As we wrote at the start of this essay, fiat money requires that consumers and investors and nations have faith in it, something the U.S. dollar is rapidly losing - despite the recent upswing in the USD Index. As long as that continues to happen, people will turn to something tangible which they can trust - gold and silver.
To see what the short-term future holds for gold, let's begin take with an analysis of the Euro and USD Indices (charts courtesy of http://stockcharts.com).
Euro - USD Indices
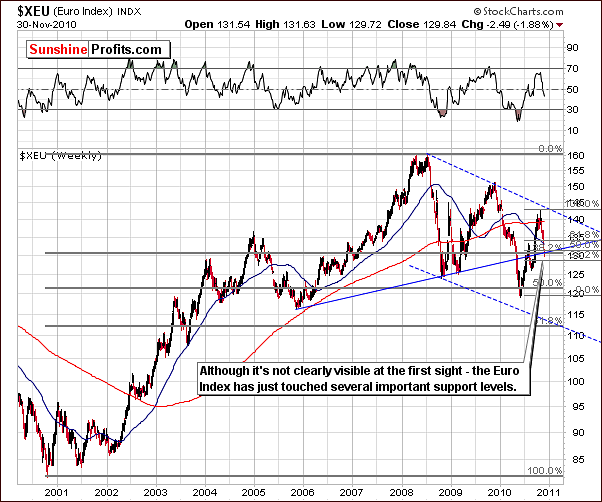
We begin this week’s Premium Update with a quick look at the Euro Index chart. Increased tensions in Europe, namely Ireland and Portugal have likely contributed to the recent declines seen in the Euro Index levels. This decline has been quite rapid of late but has been stopped at several resistance lines. One such line is the rising support level based on the 2005 and 2009 bottoms. Another is the 50% retracement of the recent upswing and a third is the 38.2% retracement level of the 2000-2008 rally. Tuesday’s closing prices are quite close to these levels and thus a short-term consolidation is likely.
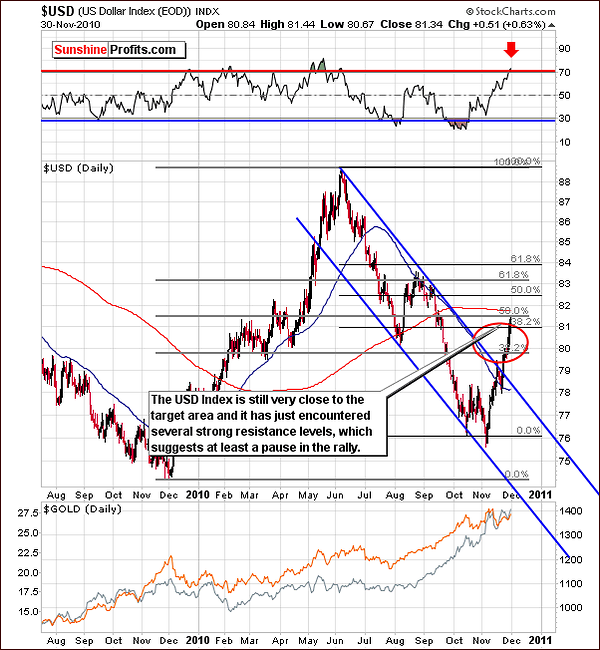
The long-term USD Index chart gives us some indications this week that a local top could be very close. The recent rise in USD Index has been a result of weakness in the euro not really a result of strength in the dollar itself. Consequently the gold has been rising against both currencies. The USD Index is approaching several resistance levels (similar situation to the one seen on the euro chart, which reached its support levels) and is slightly above our previous stated target area. Furthermore, the recent consolidation period took place approximately half-way between today’s index level and the last local bottom and this is something that commonly occurs at the mid-point of strong rallies. Consequently, the rally may be over here.
The 200-day moving average, the 38.2% retracement of the June-November downswing, and the 50% retracement from the December 2009 - June 2010 rally all provide indication that a local top is very likely. Additionally, we have the RSI indicator slightly above the 70 level, which used to mark the local tops in the past. The implications for precious metals are not immensely significant since recent correlations have been quite low. Based on historical correlations (visible in the medium- and long-term columns in the correlation matrix itself) a decline in the USD could actually give metals a boost and possibly accelerate their rally.
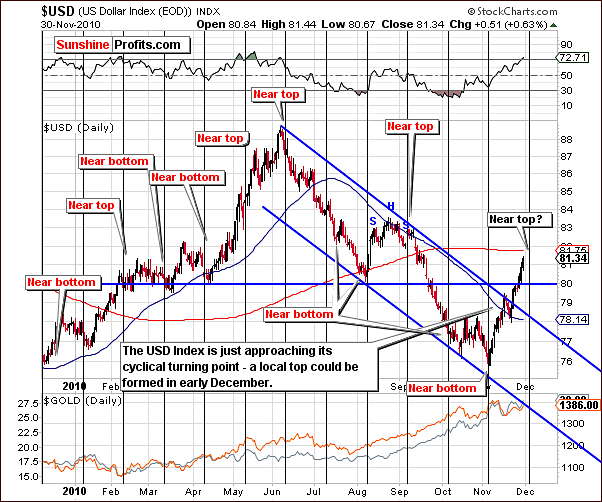
The short-term USD Index chart provides further clarification that a local top will likely be seen soon. Indications seen here point to early December as an estimated time for this turning point.
Summing up, the USD Index is likely to reach a local top soon. The likely outcome for precious metals is moderately bullish even if the USD Index will move slightly higher from here. Naturally, the likely decline in USD Index levels would be an even more positive sign for the precious metals sector and likely provide additional strength to their rally.
General Stock Market
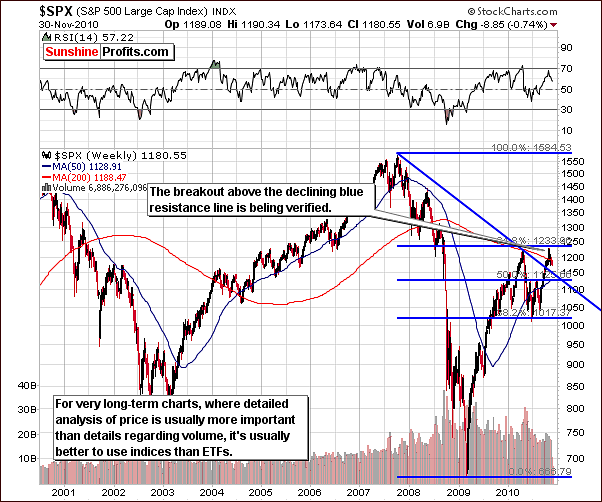
In this week’s very-long-term S&P 500 chart, we can see that a sideways trend has been in place for several days. Verification of the breakout above the declining resistance line is in progress. The consolidation period is likely close to its end but there is a possibility that declines down to the blue declining support line will be seen in the near-term. It does not have to be particularly bearish for precious metals, though.
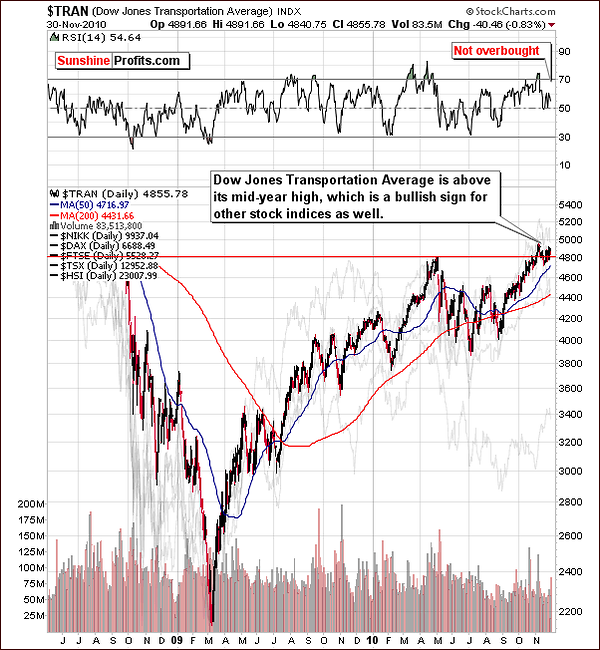
The Dow Jones Transportation chart is a new addition to our Premium Update this week. According to Dow Theory, both the industrial and the transportation sector should confirm general stock market trends. Here, however, we see that the RSI is not overbought and the Transportation Index has already broken above its 2010 high. This breakout has been verified recently and this provides us with a bullish sign as far as future prices are concerned.
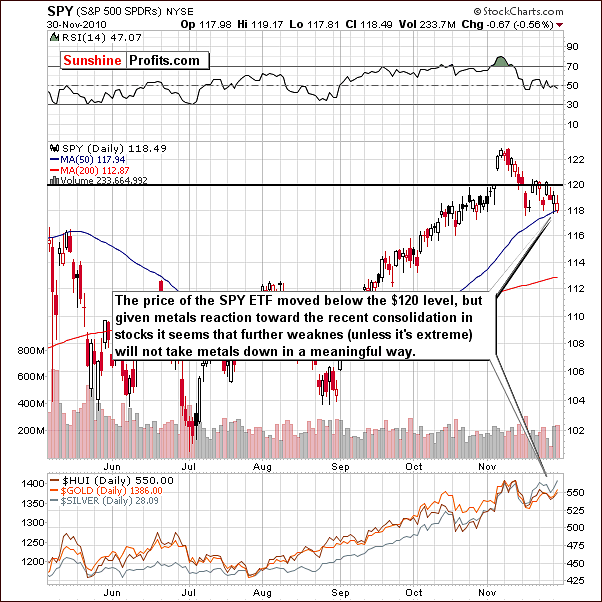
The short-term SPY ETF chart this week yields mixed signs when volume levels are analyzed. Recently, either a triple-bottom has been seen which would likely lead to a rally or a flag pattern has begun which would lead to lower prices. Which direction will eventually win out is unclear at this time. In case of a decline, it still seems that it will be stopped by the support level featured on the long-term chart earlier in this section.
Summing up, the downside appears to be limited for the main stock indices, and so is the negative influence on the precious metals. Gold, silver and mining stocks have seen higher prices even with the recent several-day decline in the S&P 500 Index. The implication therefore is that further weakness in stocks will likely not cause severe declines in precious metals prices. Should the general stock market rally from here, this would be even more bullish for gold, silver and mining stocks.
Speaking of implications, you will find more on the influence on the precious metals market coming from the general stock market and the USD Index in the following section.
Correlation Matrix
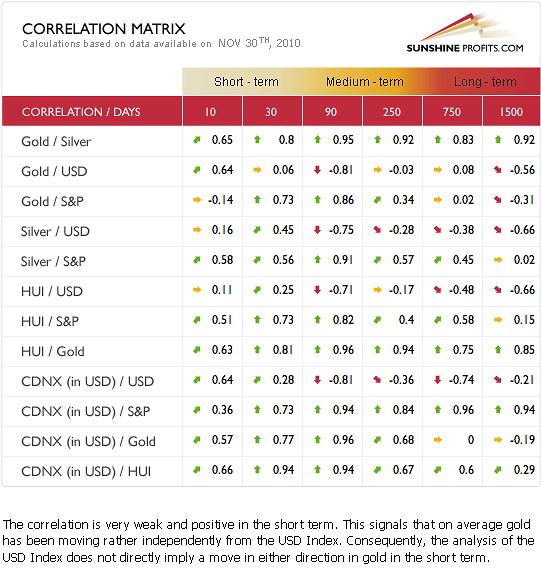
The note at the bottom of this week’s Correlation Matrix draws attention to the current relationship between gold and the USD Index. The general stock market and precious metals show little correlation unlike the past. For example, 10-day gold-S&P coefficient is -0.14 whereas the 30-day coefficient is 0.73. This is a dramatic change from a very high correlation to almost none at all, which reflects recent rally in gold that took place along with a decline in stocks. While the 10-day value is not significant by itself, it does suggest how the 30-day one may change in the future.
The implication is that declines in the general stock market would not cause a serious plunge in precious metals' prices. The strength that the latter have shown recently also supports this statement. The general stock market therefore should not be a major concern to precious metals investors at this time. Lower values in the 30-day column would be further confirmation of this statement’s validity.
Gold
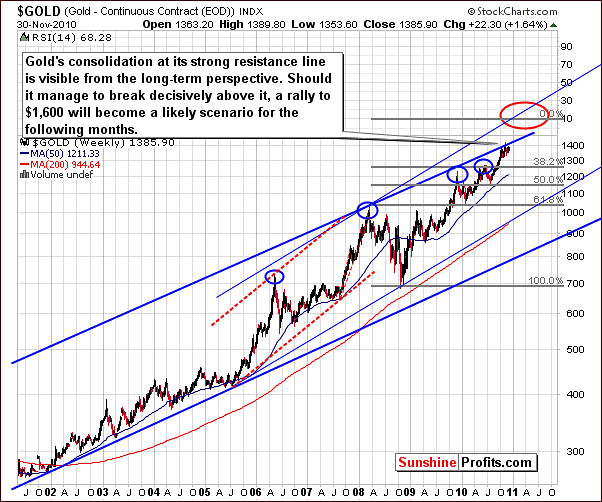
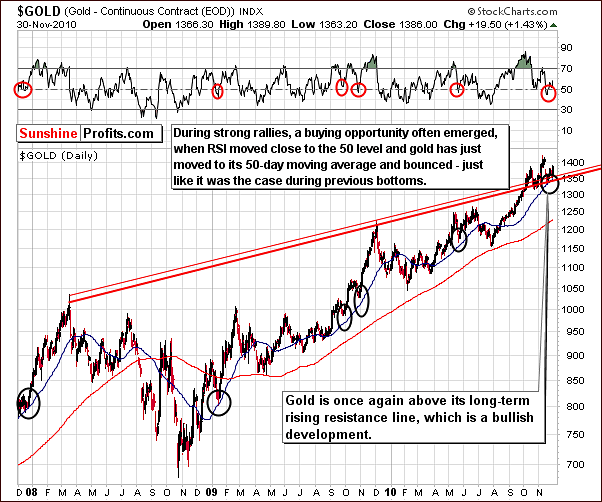
In the very long-term chart this week, we have a major development worth noting. The consolidation period is now visible here as it has been ongoing for nearly 2 months. It began back in October after gold reached the upper border of the very long-term trading channel.
It is possible that we will now see gold’s price break out above recent price levels and the $1,600 target level remains valid. This target is obtained reached by analyzing the 1.618 phi number and extrapolating the upper border of the accelerated trading channel (marked with a red ellipse on the above chart).
In the past, when consolidation periods have become visible in the very long-term chart as is the case here, it has been a sign that the pause is over. Moreover, these consolidations often took place right in the middle of the rally. Examples of this can be seen early in 2006, near the end of 2007 as well as in the middle of 2003. The common way for a big rally in gold to end is for the price to rise very high very fast and plunge right after that, thus forming a huge price spike. Recently we have not seen such action - instead we've had a few local tops and bottoms. It appears that now with the consolidation likely concluding, a further rally for gold prices is quite possible in the weeks ahead.
The gold EOD chart shows two rising support levels in close proximity to each other. The lower support line is based on daily closing prices, while the upper one is based on intra-day highs. Closer inspection shows that a breakout above this line has indeed been verified - what was once a resistance level has now become a support level.
Gold’s price moved to this support level several times and has remained close to it for several days without moving decisively below it, so the breakout is clearly verified. This in itself is a bullish sign. The RSI confirms this sentiment as it recently bottomed close to 50 and is now moving higher.
When these two factors are taken into account along with gold’s recent decline to the 50-day moving average (as marked with black ellipses on the above chart), this is consistent with past patterns of local bottoms followed by big rallies. All in all, it is likely we are in this position once again.
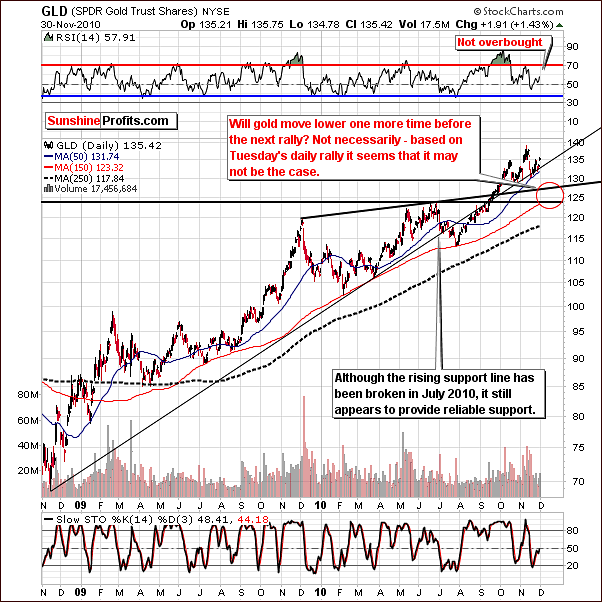
This second long-term chart is being included to discuss possible target levels to the downside. The downside target level indicated in the 120-130 range is not likely to come into play. Recent indications are that further strength will be seen and prices will likely move higher. We decided to provide this level anyway, since it shows that even in case of a decline it will not be a major one from the long-term perspective, and any weakness that could materialize here should not make you sell your long-term gold and silver holdings.
Moreover, please note that the rising black support level still provided support recently even though it has been broken in June 2010.
With all of these bullish signals present, let's consider what could invalidate them. There's one thing that one of our Subscribers asked us about, and it’s featured on the chart below.
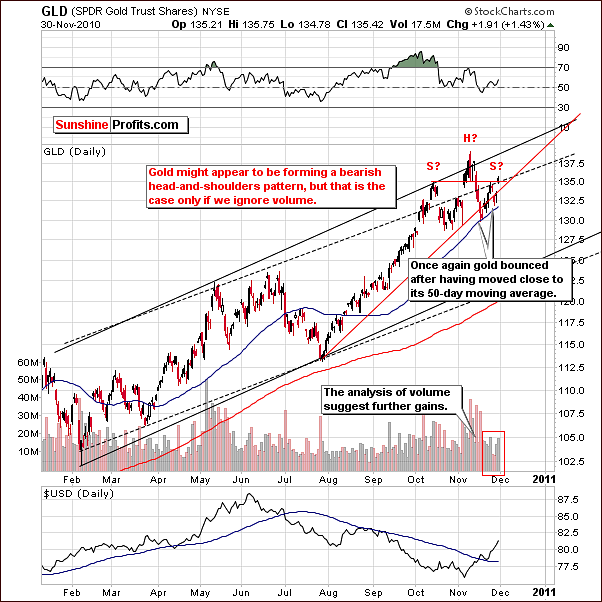
Gold’s short-term chart at first glance appears to reveal a possible bearish head and shoulders formation. This is however not yet confirmed. When such a situation arises, it is important to study recent volume trends. What we have seen lately is strong volume with rising prices and lower volume when prices decline. For this reason, the bearish head and shoulders pattern should not be of major concern today.
Gold’s price has been stopped recently at the intersection of several resistance lines but daily volume levels and other signs indicate gold’s next move is likely to be up. Such a move would immediately invalidate the bearish head and shoulder’s pattern and would likely result in a suggestion on our part to increase speculative positions in gold, silver, and mining stocks.
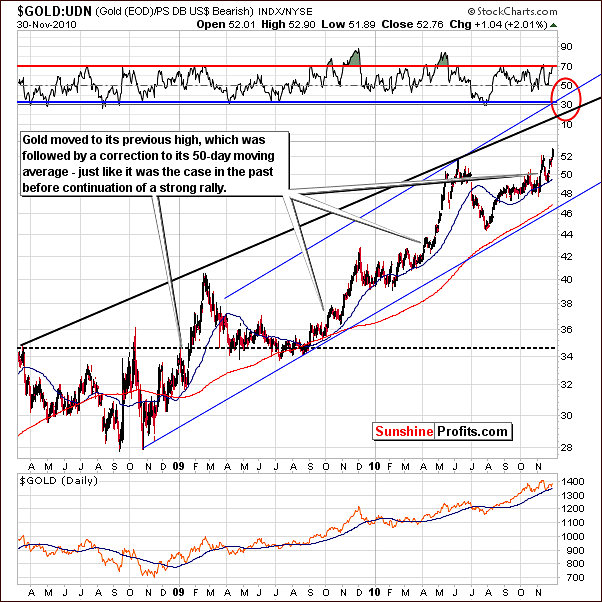
From a non-USD perspective, recall that in the previous Premium Update we discussed how gold’s price movements differ between non-USD markets and its price based on the dollar. Since our last update, we have seen a near perfect bounce off the 50-day moving average for non-USD gold prices. In last week’s chart we commented:
Gold moved to its previous high, which was followed by a correction to its 50-day moving average – just like it was the case in the past before continuation of a strong rally.
Non-USD investors have seen price movement above previous highs, which has not yet been seen on the USD side. The upside from a non-USD perspective appears to have been higher, mostly due to the weakness of the euro. We wrote about this as likely outcome in our Premium Update two weeks ago:
At this time for non-USD investors it seems best to hold long-term positions and enter small speculative positions right away. The reason we feel that speculative positions can be taken ahead of the correction is two-fold. First, the timing of any correction is quite difficult to pinpoint as the precious metals stopped responding to USD rallies, and secondly, the correction appears as though it will likely be quite small. Furthermore, the rally, which will likely follow could last for several months, thus making any small price decline, which was missed insignificant.
The target for gold priced in currencies other than the dollar is much higher than gold is today (marked with red ellipse on the above chart), so there is still much room for further gains. Meanwhile, it seems that Investors who held their positions at that time are happy that they did.
Summing up, although recent price action in the short-term shows some bearish signs, daily volume levels dispel this sentiment. The head and shoulders pattern has not been confirmed and likely will not be. The positive signs from volume levels far outweigh this coincidental pattern and we remain bullish for gold in the short-, medium-, and long-term. From a non-USD perspective, gold is seeing new highs and the outlook remains strongly bullish.
The recent consolidation period now visible in the very long-term chart may well be over, and a move above the rising trend channel is quite possible. It appears that investors should remain long with long-term holdings and speculative long positions appear justified. The $1,600 target level is still valid and it is advised that other metal and mining stocks be monitored as it is likely they, along with gold, will see substantial gains very soon.
Silver
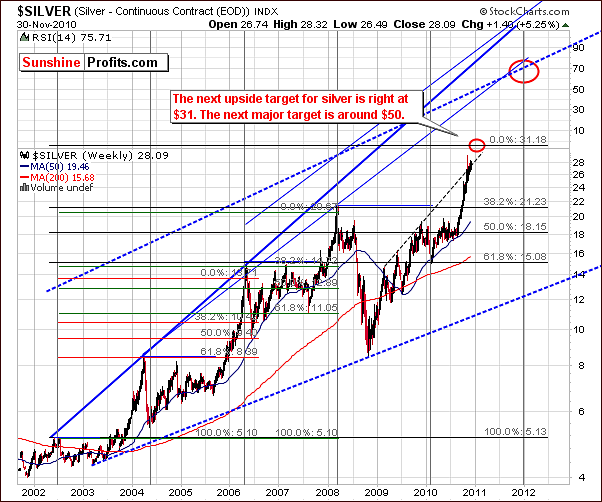
Our first silver chart this week looks at silver from a very long-term perspective. The target level of $31 is still in place and investors are advised to monitor gold closely as silver moves towards this level. It is likely to be the case that gold and silver top/bottom will take place at the same time. We will have more to say on this in the weeks ahead.
The outlook for silver is bullish and price action seen on Tuesday confirms this sentiment. Although silver’s volatility is expected to remain, the general trend appears to be upwards for the short to medium-term for the white metal.
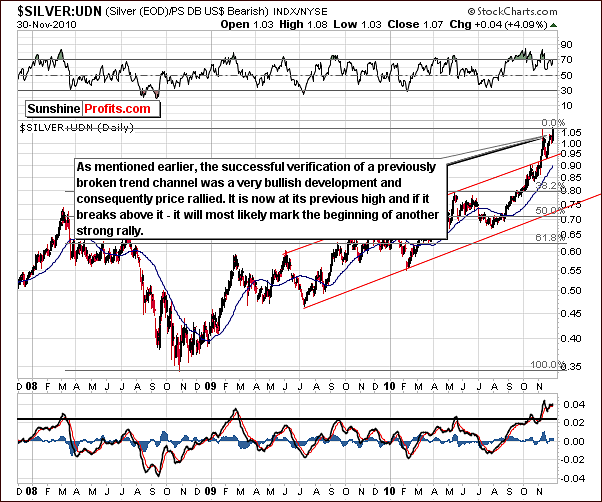
From a non-USD perspective, we can see that silver has perfectly verified a breakout. Its price has recently moved above the upper border of the trading channel and this is a very bullish indication.
On November 19th we wrote the following:
Silver’s price is again on the rise and the breakout has been verified. These are very bullish indicators but it is prudent to always keep in mind that the white metal’s volatility does generally increase risk to some degree.
Another point worth noting here is that silver is now at levels equal to its previous high and a breakout from here seems possible. This is a sign of great strength when one considers the recent lack of support from the general stock market, which has been trading sideways at best. Where does silver go from here? Let's take a look at the short-term chart for more details.
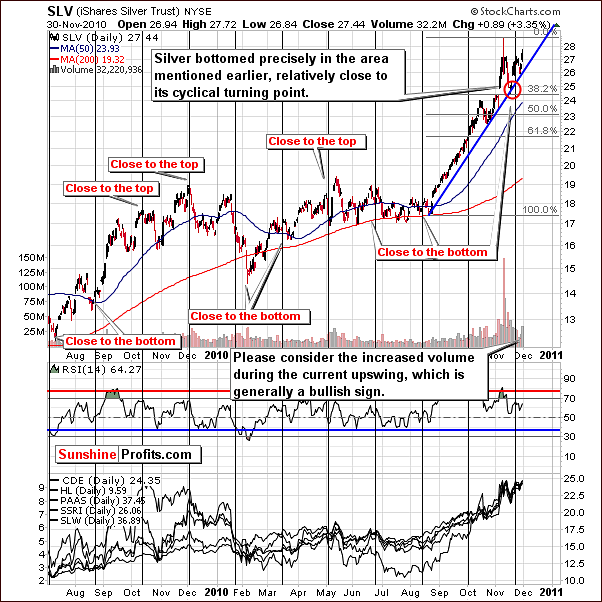
In the short-term chart this week, we see that volume levels have been significant. This is a bullish sign given that silver’s price has been rising and further confirms that higher price levels are likely to be seen soon. A breakout to new highs can already be seen if the daily closing prices are examined. Moreover, silver has already put a local bottom very close to its cyclical turning point, as indicated earlier, which can be seen as a small clue that the decline is over.
Summing up, as always, silver investors are strongly urged to monitor gold and mining stocks closely, especially when trying to time tops in the silver market. There is a strong likelihood that gold, silver and mining stocks will move together and reach tops at nearly the same time. Many indicators point to higher prices for silver but its unpredictability and volatility must always be taken into account and expected as part of the investment process. The $31 level appears to be the closest strong-resistance level, but it is not out of the question that with $1,600 gold, silver would move higher than $31.
Mining Stocks
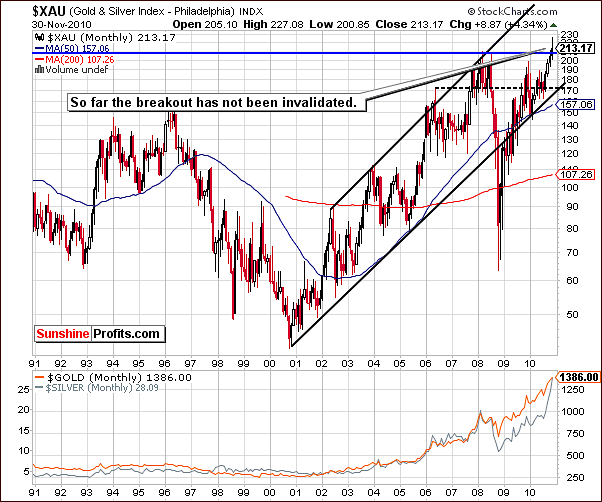
This week’s XAU Gold/Silver Stock Index chart is pretty much unchanged from last week. A period of consolidation has continued and index levels still remain above previous highs. Since the mining stocks have managed not to plunge below the 2008 high soon after breaking above it, we currently see about 70% probability of a continuation of the move up.
Long-term assets should be in and remain in mining stocks today. Diversification among the precious metals themselves and mining stocks seems to be justified, but the point here is that the period ahead may be one in which mining stocks out-perform gold and silver. Naturally, the outlook for mining stocks both in the near-term and for the long-run is bullish at this time.
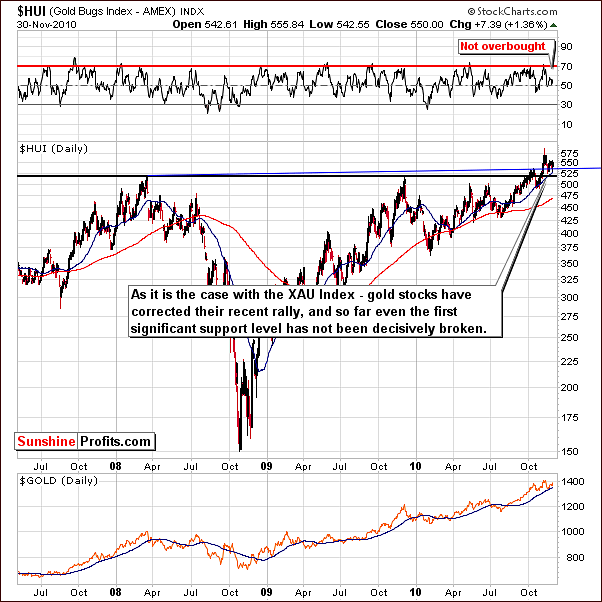
In the HUI gold stocks chart, we again have confirmation of points made earlier in this update. The RSI is not in the overbought range and this implies that a further rally is quite possible from here. Not only did the gold stocks manage to gold above the important thick blue support line, but they also held relatively well above even the upper support (thin, blue) line. The sentiment is clearly bullish at this time.
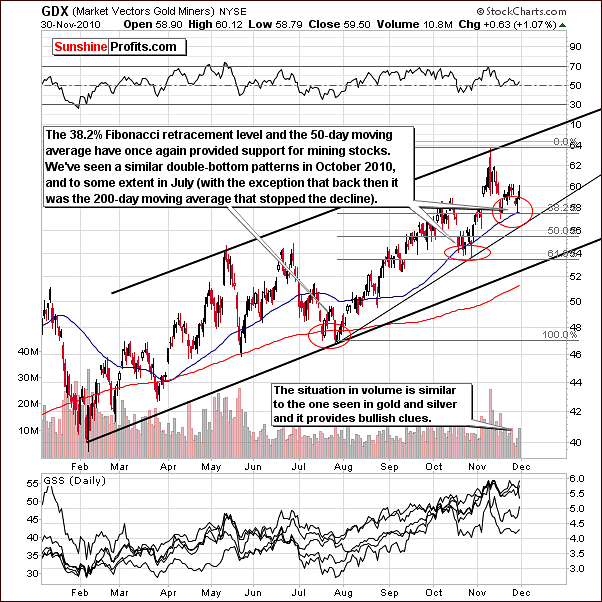
The GDX ETF short-term chart clearly illustrates a double-bottom pattern this week. Similar trends can be seen back in October as well as in this past July. In these previous situations, mining stocks moved up strongly in subsequent weeks. Initially, a move was seen to the important moving average level and this was followed by a big rally.
Indications are that we may see this same occurrence again. The Fibonacci 38.2% retracement level has been touched and is normally the minimal size of a correction. Fibonacci retracement levels can be used to measure market strength and price moves to the 38.2% level indicate market strength, 50% level is medium and 61.8% level or lower indicate not-too-strong market. Volume levels seen recently indicate the strength of this market and higher prices appear likely in the days to come. Sunshine Profits will continue to monitor the situation and inform Subscribers as to expectation changes with respect to long-term positions and speculative actions.
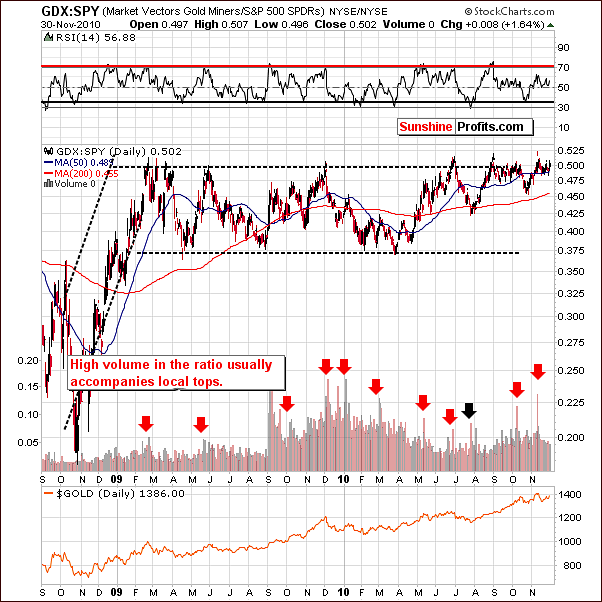
The GDX:SPY chart emphasizes the performance of mining stocks relative to all other stocks. Single spikes in volume of the ratio (meaning that the volume for the GDX ETF is relatively much higher than that for the SPY ETF) are frequently seen if there is a strong relation to other stocks. Often, the RSI level agrees and resistance levels are in play as well. At this time, spikes are not being seen and a local top is therefore not likely. This confirms points made earlier in this update.
Summing up, bullish times appear to be ahead for the mining stocks. Volume levels and recent price actions point to the possibility that gold and silver themselves may be outperformed in the months ahead by the mining stocks group. How many stocks should you buy? Please check the Key Principles section on the website to find out more. Which stocks should you buy? Please check Leverage Calculators in the Tools section for details.
SP Indicators
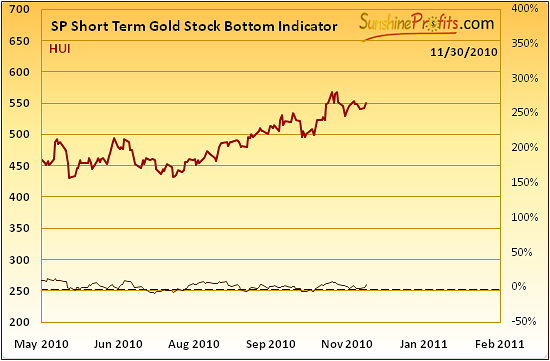
This week’s Sunshine Profits Short-Term Gold Stock Bottom Indicator flashed a buy signal as it moved below the horizontal dotted line and started to rise again. This occurred after last Friday's session and gold, silver and mining stocks have moved higher since then. This signal therefore, confirmed last week’s message. The implications from this sign normally last at least several days, most likely more than a week and only two trading days have passed since last Friday.
Letters from Subscribers
We will begin this week's "Letters from Subscribers" section with a reply to the interesting question that we've received recently about gold, the U.S. Dollar and the Euro. Namely:
Since the Euro is a primary benchmark against which the relative value of the dollar is established, the discussion among fellow PM investors increasingly turns to the scenario where the collapse of the Euro creates a spike in dollar value (triggering a subsequent collapse in PM prices).
In addition to the points made earlier in this Premium Update, we would like to provide you with additional thoughts regarding the euro down -> dollar up -> gold down scenario. In fact there were similar question several months ago, so we will base the reply on our previous comments.
Generally, the market mechanisms would work in the above-described way if we assumed that the value of gold in euros couldn't change. In this case, if the value of the dollar increased against the euro it would have to mean that its value against gold would also increase. In other words, the value of gold in USD terms would therefore decrease.
However, not only can the value of gold in the euro change, but it has very strong technical reasons to rally (as is visible on the gold:UDN ratio chart which trades very closely to the gold in euros). Moreover, it has been rallying and has now moved to new highs, as explained earlier in this update.
Now, if we assumed that the value of gold in euros moves much higher ceteris paribus (all other things unchanged), then the above implication (euro down -> dollar up -> gold down) loses its reliability.
Let's take a look at a simple situation:
Gold in euro moves up by 100% from 1,000 to 2,000.
Dollar goes up against euro from 0.7 to 0.9 (meaning that 1 dollar used to buy 0.7 euro and now it buys 0.9 euro).
What impact does it have on gold priced in dollar?
At the beginning, gold traded at $1,429 (1000 / 0.7) and now it trades at $2,222 (2000 / 0.9), which means that it increased by about 56%.
So - we have an increase in the value of gold in both: USD and EUR, which means that gold increased its value against the U.S. Dollar while the Euro decreased its value against the U.S. Dollar.
Of course, the numbers above are just hypothetical, and everything depends on the sizes of the respective rallies/declines, but the above example clearly shows that a decrease in the value of the euro (against the dollar) does not need to translate into a lower price for gold.
At this moment, it's not surprising to see European investors purchasing gold in response to their economic problems. Yes, there will be investors willing to purchase dollars as a safe-haven (which we found rather ironic when we first commented on this topic several months ago, and we still do), but some may be willing to purchase gold and silver.
Another question received recently was about the differences in the performance of gold funds such as GLD, CEF, GTU and PHYS. We have included a chart (courtesy of http://finance.yahoo.com) to assist us in our explanation.
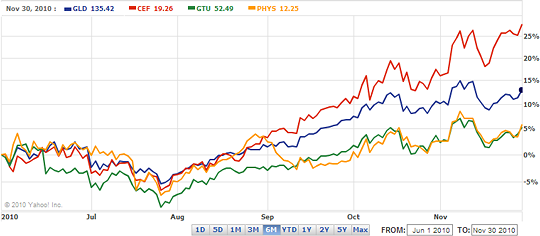
First of all, all four funds can trade at the premium or discount to their Net Asset Value. For example, if only one of these funds becomes popular due to a successful marketing campaign, the demand of the fund units will go up, and therefore their price will rise as well. This could be one of the reasons for differences in premiums and consequently performance relative to other funds or gold itself.
Taking the last 6 months into account we can divide the above into 3 groups: CEF, GLD, and both PHYS and GTU.
The outperformer here is clearly CEF - Central Fund of Canada (featured in the Key Principles section). In short - the main reason behind its outperformance is that it's only one-half gold fund. The other half is about silver, and since the white metal performed so well in the previous months, the value of the CEF virtually had to outperform "pure gold" funds.
The difference between the other funds and the CEF is much smaller, and also the reasoning is not as straightforward. GLD ETF provides great liquidity, however this is realized at the price of long-term safety. Above we have written about premiums - GLD ETF trades at a very low premium to the real metal which means that it tracks the price of gold effectively.
As we've explained in the previous updates, the regulations regarding the GLD ETF include the possibility that one will end up holding just a paper promise to own gold with no gold behind it. But once again - it's very liquid, and so are options trading on the GLD - not to mention that the track gold with almost no premium/discount. With just a several-day trade in mind, how much does it matter that in the end there might be no gold in the ETF? Not much. And until that happens many traders will take advantage of the liquidity and lower costs (after all, if a fund holds gold futures instead of gold, then its storing cost will be much smaller), which could translate into better short-term performance of the GLD ETF as compared to other gold ETFs. This is especially true for those holding the real metals.
Speaking of the latter - we have GTU and PHYS that are believed to be holding the real metal but are generally trading at a premium to their Net Asset Value. In this case, if gold moves up by 5%, but the premium of GTU or PHYS goes down by 7%, you can still lose money on this investment in the short-run. This is not encouraging for short-term traders who dominate the market during big price upswings. The owners/directors of the abovementioned funds argue that these premiums are still smaller than the cost of obtaining exposure to gold by buying the physical form, but this is not enough of an incentive for traders who can simply purchase GLD at almost no premium at all.
Therefore, the performance of different proxies for gold may vary, and it is not an obvious decision, which one should be used. Much can depend on the tax implications of using a given instrument, so we suggest consulting with tax advisor regarding that matter. As far as we're concerned, we prefer physical ownership (as stated in the Key Principles section) for long-term investments, and we believe that GLD (or options on it) will be appropriate for short-term speculation.
The final question for today is about buying gold on margin. We would like to comment on whether it would be wise to take a loan at a bank to invest in gold and silver (physical bullion & selected stocks), given that the bank rates are so low and the prices for gold and silver are still in the 2nd phase range of the commodities' bull market.
Actually, we've replied to a very similar question about a year ago, and since our reply back then is still up-to-date today, we will quote a part of the aforementioned comment.
We must admit that the idea is tempting, but we generally do not recommend it. While it does seem to make sense, as far as the pure logic is concerned, one should also take other factors into consideration, and we believe emotions would be the thing that we need to focus here.
By borrowing money and investing it in an asset that does not provide you income, i.e. dividend, you also generate a negative revenue stream. In other words, you need to make payments on a monthly basis, which is not a big deal as long as the price of gold goes up, but which may become a big problem during consolidations. The point here is that when you have to pay for the ability to hold a certain amount of gold or silver, you would like metals to go to the moon instantly. Naturally, all owners of precious metals (including your Editor) would like to see the price of metals explode but with leveraged positions (and buying gold on margin / for borrowed money, means increasing the leverage), the pressure is much greater.
During consolidations, when we need to wait a little longer, it is easy to get irritated just because prices don’t go where one wants them to go; however, if you need to pay along with watching your holdings go lower in value, you are much more likely to close your positions just to stop “losing” your money. I’ve put “losing” in quotation marks, as consolidations are only a temporary phenomenon, needed in every bull market, but with the big pressure involved in buying anything on margin, it is very easy to lose one’s focus and close one’s positions much too early, possibly with gold at lower prices than it was when one made their purchase.
Therefore, taking the realistic approach toward investing, we cannot recommend purchasing gold and silver with borrowed money for most investors. Yes, it might prove worthwhile for extremely discipline and risk-loving Investors, but we believe that for most people, this approach is dangerous. Of course, the final choice is always up to you, and we’re fine with whatever decision you take. If you decide to proceed with purchasing gold and silver with borrowed money, be sure to take the abovementioned factors into account.
Summary
The USD Index has been rallying strongly for several weeks as the Euro Index has declined. This is likely to reverse very soon, at least temporarily, and quite possibly boost precious metals prices even higher.
The general stock market direction remains somewhat unclear. Although the SPY ETF is below the $120 level, several bullish signals are seen for stocks. With the recent strength seen in gold, silver and mining stocks and the slightly declining correlations with the general stock market, the bullish sentiment for precious metals Investors and Traders is relatively high. Resistance levels are or will soon be in play, however, volume levels and other indicators point to a strong possibility of higher prices in the near-term without a noteworthy correction being seen first.
We believe that being fully invested with one's long-term capital is both wise and prudent at this time. As far as short-term is concerned - we think Traders should continue to hold the small speculative long position (even though it is not so small anymore, since metals rallied since we've mentioned opening it). As always, we will keep you updated should the situation change and our position alter in any way.
This completes this week's Premium Update.
Thank you for using the Premium Service. Have a great weekend and profitable week!
Sincerely,
Przemyslaw Radomski

