
If you didn't receive any message from us lately (including the notification e-mail about this update), it is due to our recent change of the IP address, and the fact that it doesn't have the "e-mail sending history" yet. This caused many e-mail service providers to block our messages. The reputation of this IP address was good, and we were unable to check in advance that this problem will occur. We are working on this issue and we do everything we can to "fix" this situation as soon as possible (we were able to improve the deliverability of our messages since the last week, but we have not yet received replies from all E-mail Service Providers that we've contacted). We apologize for the inconvenience.
In order to make sure that you receive messages from us please add us ([email protected]) to your address book / "safe sender list", and alternatively subscribe to our RSS feed (you can receive additional notifications - it is possible to receive them to your e-mail).
---------------
Do we really believe that the good German Burghers shall go to work for 45 hours per week and continue to work on toward 65 years of age so that their Greek brethren can retire at 55, having worked 35 hours per week and capable of retiring at perhaps 75% of their final wages? Will the union men and women of France continue to tax themselves at higher rates so that Greek retirees can come to Paris to shop?
How simple a thing is happiness: a glass of wine, a roast chestnut, a wretched little brazier, the sound of the sea. All that is required to feel that here and now is happiness is a simple heart. Zorba the Greek is a novel written by the Greek author Nikos Kazantzakis.
The menu at the private dinner attended by a small group of top notch hedge-fund managers may have been lemon chicken and filet mignon, but the main course was roasting the Euro.
The Wall Street Journal reported this week that a small group of hedge-fund heavy-weights who met at a dinner hosted by a prestigious investment bank at a Manhattan townhouse, discussed the likelihood that the euro will tumble down to "parity" with the dollar.
The focus on the euro began on Dec. 4, when the currency fell 1.5% following a jobs report in the U.S. that buoyed the dollar (which is exactly when gold priced in the U.S. Dollars started a sizable slide). About a week later, several large European and U.S. banks made bearish calls on the euro by buying one-year euro "puts." With pressure on the euro mounting, the currency fell another 1.3% on Dec. 16 when Standard & Poor's downgraded Greek sovereign debt. With growing fears about Greece's ability to refinance its heavy debt load, the euro kept sliding. (Greece's deficit swelled to 12.7% of gross domestic product (GDP) in 2009, way above the European Union's 3% cap. Greece's government leaders have pledged to reduce that nation's budget deficit to 8.7% in 2010, but that's easier said than done.)
During this period gold has been up X% in Euro terms.
According to the Wall Street Journal, by the week of the dinner last month, the size of the bearish bet against the euro had risen to record levels of 60,000 futures contracts-the highest level since 1999. Three days after the dinner,another wave of selling hit the euro, pushing the currency below$1.36. Keep in mind that it traded at $1.51 in December.
Playing a part in the current trading against the euro are derivatives, known as credit default swaps (CDS). The WSJ reported that some of the largest hedge funds, including Paulson & Co., which manages $32 billion,have boughtsuch swaps which act as insurance against a default by Greece on its sovereign debt. Traders view higher swaps prices as warning signs of potential default.
Since December, the prices of such swaps have more than doubled.
Most traders don't expect the value of the euro to crash and burn the way the British pound did in 1992 when George Soros placed his legendary bearish bet against the currency, making $1 billion in the process. Speaking of Soros, his Soros Fund Management LLC was represented at the dinner. Several weeks ago Soros warned that the entire euro financial system is under threat, not only from Greece, but from the growing debt burden of other member countries. He argues that the euro system is fundamentally flawed and that the currency's viability is being tested.
A fully fledged currency requires both a central bank and a Treasury to be available in times of crisis, says Soros. He explains that when a financial system is in danger of collapsing, the central bank can provide liquidity, but only a Treasury can manage the problems of solvency.
This is a well-known fact that should have been clear to everyone involved in the creation of the euro," he wrote in a recent Financial Times opinion piece.
Soros says that "makeshift assistance should be enough for Greece," but warns that the growing threats posed by other debt-laden countries - particularly Spain, Italy, Portugal and Ireland - could prove overwhelming.
The survival of Greece would still leave the future of the euro in question. Even if it handles the current crisis, what about the next one?
(Soros Fund Management LLC, which manages about $25 billion, may be bearish on the euro, but is certainly bullish on gold. It increased its investment in SPDR Gold Trust (GLD) by 152 percent in the fourth quarter, as shown by the recent Securities and Exchange Commission filing. )
Another interesting article in the FT last week was by Otmar Issing, former member of the European Central Bank's executive board and one of the founding fathers of the euro.
Describing the European Monetary Union as an institutional arrangement unique in history, Issing writes that he was one of the economists that warned in the 1990's that starting a monetary union without having first established a political union was "putting the cart before the horse."
Issing points out that participation in the euro zone brings huge advantages--Greece has enjoyed long-term low interest rates. But since a single monetary policy is implemented by the European Central Bank, it is the responsibility of each country to adjust its economic policies so that "the one size fits all."
"But instead of delivering on its commitment at the time of entry to reduce public debt levels, the country has wasted potential savings in a spending frenzy. The crisis with which it is now confronted is not the result of an "external shock" such as an earthquake, but the result of bad policies pursued over many years. Bailing out Greece would reward such behavior and create moral hazard of a dimension hardly seen before."
Soros and Issing are not the only voices raised against the euro. In a recent interview, Dennis Gartman, founder of The Gartman Letter, declared that the Euro is doomed.
There were many who said they didn't think the euro would make it past the first important recession. Well, this is really the first important recession since the creation of the euro... Honestly, I think the euro is a doomed currency.
But these things take time to play out... I think these are terminal problems that the monetary union and the political union are facing, and it's only a matter of time before it ceases to exist. Will it happen overnight? No. It will happen in a slow, very painful, long-standing, horribly drawn-out, ugly affair."
Zorba the Greek in the famous novel by Nikos Kazantzakis is a happy go lucky person who enjoys the simple pleasures of life, a glass of wine, a roast chestnut, the sound of the sea. "All that is required to feel that here and now is happiness is a simple heart," he says.
While we don't want to oversimplify and absolutely not to offend anyone with the following comments, it seems that on average the Greeks have grown more sophisticated in their tastes but have not been willing to work as hard or pay their taxes as diligently as do the French and the Germans. The cost of production in Greece is considerably higher than producing goods in Germany or France. In the long run it is difficult to believe that a German worker will be willing to toil 45 hours per week in order to bail out his Greek compatriot who works 35 hours per week.
So if the euro is being roasted and toasted, what's on the menu for the US dollar and for gold?
Let's begin the technical part of this week's update (charts courtesy of http://stockcharts.com) by commenting on the current situation in the U.S. Dollar, and the general stock market, as this part of analysis once again provides very important clues as to where gold, silver and PM stocks may head next.
USD Index
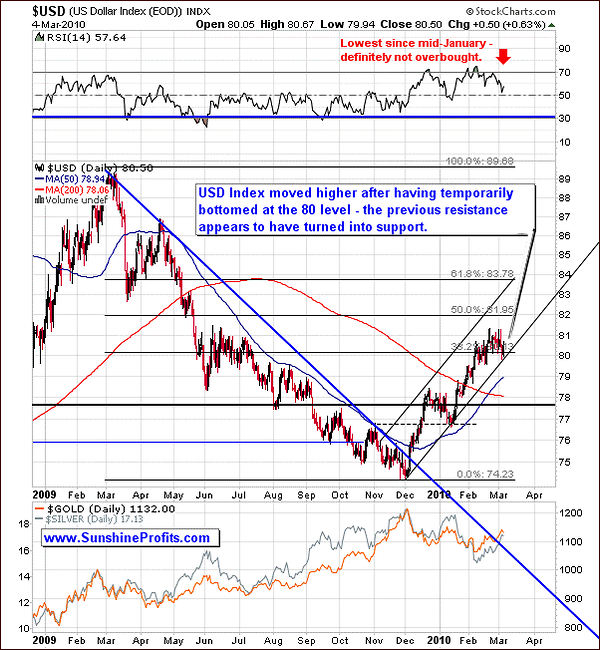
The U.S. Dollar has moved lower to test its previous resistance level. This level passed the test meaning that it provided support as the dollar moved higher shortly after touching it. The rally has not been big so far, but the point is that the USD Index is still within the trend channel and one of the proven rules of the technical analysis is that the price is likely to continue to move in a given direction until there is clear evidence of the opposite. Here, this rule tells us that the USD Index may be expected to move higher until it breaks below the lower border of the rising trading channel. The 82 level provides the closest resistance.
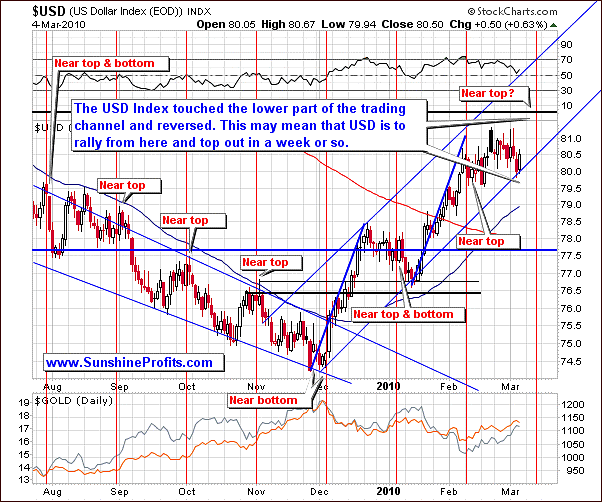
The short-term chart reveals that the USD Index has touched the lower border of the rising trend channel with near-perfect precision. This suggests that USD is to move at least a little higher from here, before topping.
We wrote about a topping USD but we have dedicated the first part of this update to the weak fundamentals of the Euro. In our view, one of the most interesting phenomena in trading in general is that once everyone get on one side of the trade, it's usually best to get on the other side. After all when everyone has already bought then who's left to push prices higher? We'll get back to the U.S. Dollar while analyzing the current version of the correlation matrix, and in the meantime let's move to the general stock market.
General Stock Market
In the latest Market Alert we wrote the following:
The general stock market appears to be topping here, or at least the risk of a temporary downturn is high. Given the high short-term correlation between the general stock market and precious metals this means that the risk of a move lower in the metals (and corresponding equities) is also high.
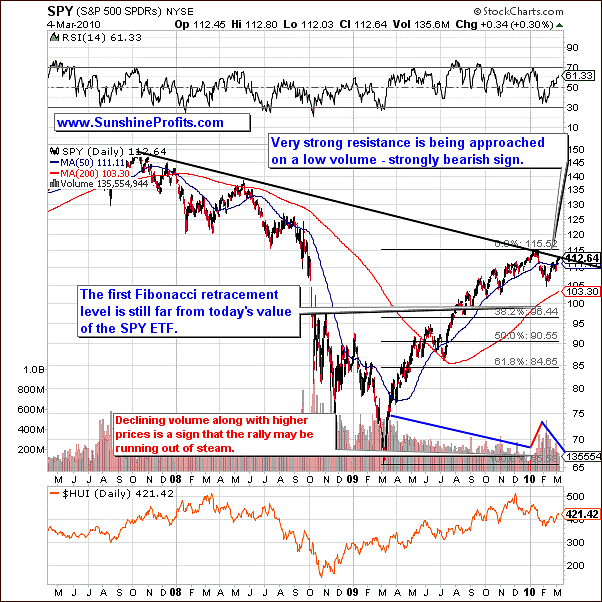
As you may see on the above chart, the SPY ETF (proxy for the general stock market, which allows us to analyze volume) has just moved to the strong long-term resistance level. This level is created by connecting important 2007, 2008 and 2010 tops, so it is in fact a multi-year resistance level. In order to break above such a strong resistance, stocks would need to show some signals of strength. High - and rising - volume during the upswing would clearly provide a confirmation, but we have not seen that recently.
Moreover, we have seen the volume decline along with higher prices. Based on the historical performance of this market (and other ones as well) it is not likely that the general stock market will move above such a strong resistance level right away.
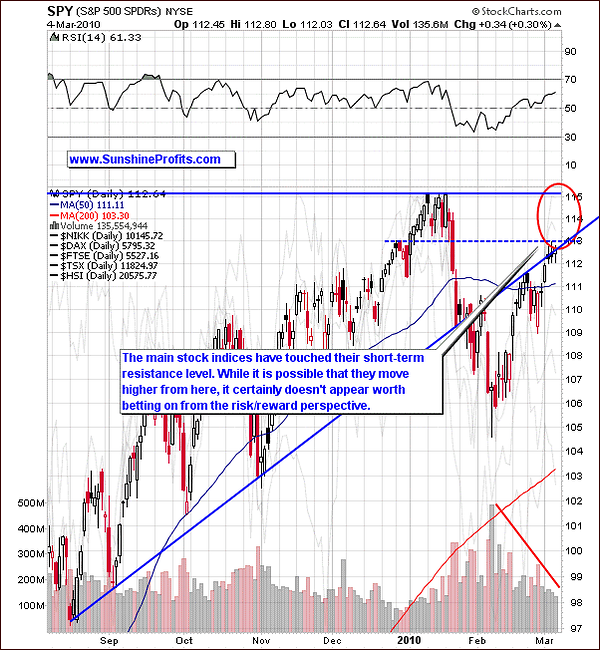
The analysis of the short-term chart confirms the abovementioned point. The SPY ETF is not only right at the strong long-term resistance level - it has also just touched the short-term resistance area. The volume is relatively low also from the short-term perspective and it has been declining during the current upswing.
Therefore, betting on higher values of the main stock indices doesn't seem to be justified from the risk/reward point of view. Whether or not to short the general stock market is a different matter. Situation is not symmetrical, meaning that the fact that the general stock market is not likely to rise doesn't automatically mean that it plunges right away - after all, it may continue to trade sideways for weeks.
Additionally, if one is considering using options for this bet (which is often a good idea for betting on lower prices, because declines tend to be more volatile than upswings as fear is a strong emotion than greed and options' value increases along with volatility - you may read more in one of our previous essays), it is imperative not to purchase short-term options just before a consolidation during which prices trade sideways. Options have time value, which means that their price will decrease over time (very fast in case of short-term options) unless the underlying asset will move in the predicted way.
Therefore, before initiating a short position it might be useful to wait for additional confirmation that the move lower is to take place soon, for instance in the form of a decline on a high volume followed by an upswing on much lower volume.
Correlation Matrix
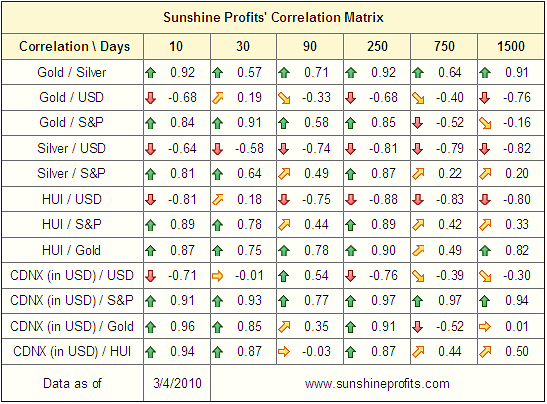
While the values in the correlation matrix didn't change much as far as the general stock market is concerned, but we have changes in the 10-day column for the USD Index rows.
In other words, this is a subtle indication that the USD Index may soon once again become an important short-term driver of the PM and PM stocks' prices.
Given what we wrote while analyzing the U.S. Dollar several paragraphs earlier (that it may move temporarily higher, and then decline), this would mean that gold (and the rest of the PM sector) would move temporarily lower and then rise. Naturally, that is just a speculation on our part, because much depends on the general stock market and the way PMs will react the moves in the main stock indices.
In fact, the high correlation between the general stock market and the precious metals sector was one of the most important reasons that made us send out the latest Market Alert. You may read about other reasons in the following part of the update.
Gold
In the previous Premium Update, we wrote the following:
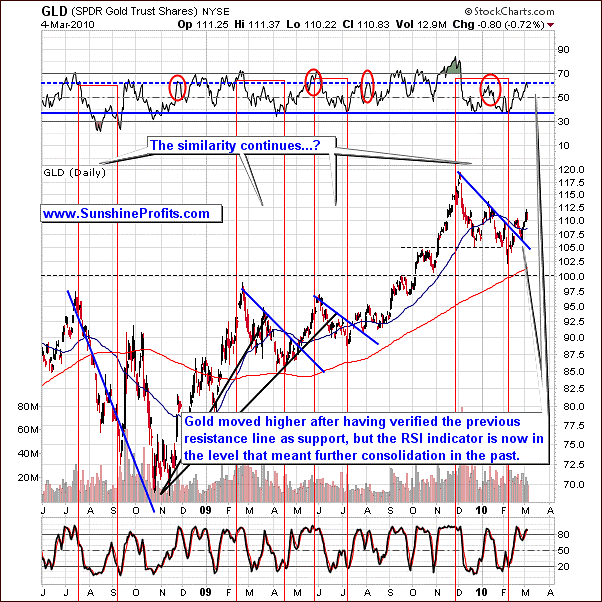
As we can observe on the GLD chart above, the values follow a consistently similar trend. After breaking above the declining short-term resistance lines (marked on the chart with blue color), gold moves lower to test the previous resistance. That was the case also this time as gold has just verified the previous resistance line as a support.
Gold has indeed moved higher during the following days, but it seems that it will need to take a breather once again. Please take a look at the RSI Indicator - it's currently near the 60 level. Please note that this used to signal that a temporary bottom has been reached - we've marked these situations with red ellipses on the above chart.
We also wrote that gold is warming up and preparing to launch higher [from the long-term perspective]. If only gold can break free from its strong positive correlation with the general stock market, then one can assume that the gold market will most likely climb its way up.
As mentioned above, we have not seen the disconnection between gold and the general stock market, so we must remain cautious.
Let's take a look at the short-term chart for more details.
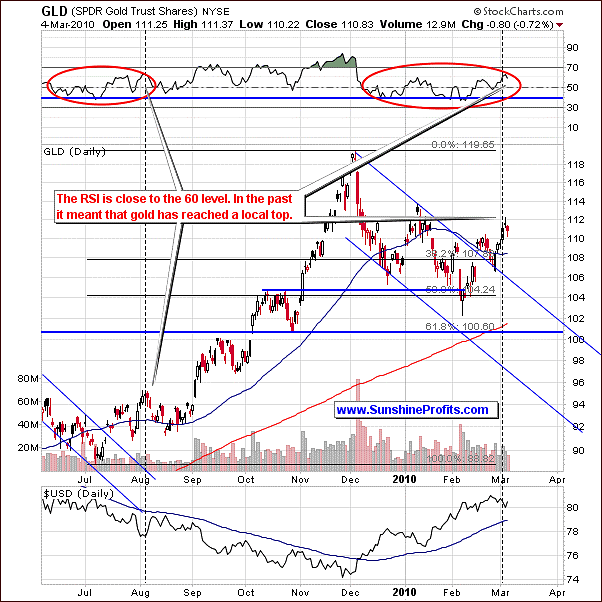
The short-term chart reveals that the situation on the gold market is still self-similar also in the short run. It appears that the RSI Indicator moved has formed a high around the 60 level, just like it was the case in early August 2009, after which gold prices moved lower for about 2 weeks. Since the current move is still very similar to what we've seen in the middle of 2009, we might see some kind of consolidation here - perhaps 2-3 weeks of lower prices.
We will be able to tell you more once we have moved lower for at least several days and we are sure that what we've seen very recently what indeed a local top.
Silver
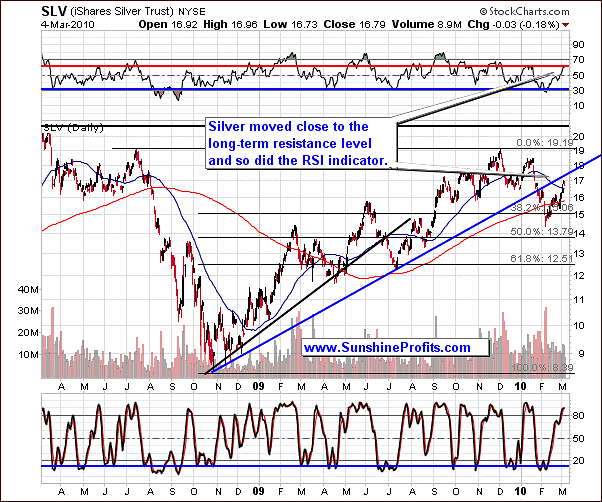
Moving on to the white metal, we see that silver has moved very close to its long-term resistance level slightly above $17 in the SLV ETF, which may mean that this, and other PMs are likely to take a breather soon, or the one has already begun. Please note that the analogous situation in the (black rising line) past meant resulted in the correction, as indicated above - prices declined in early August. This is particularly interesting since this is the same time-frame that contains a similar analogy on the gold market - which serves as a confirmation.
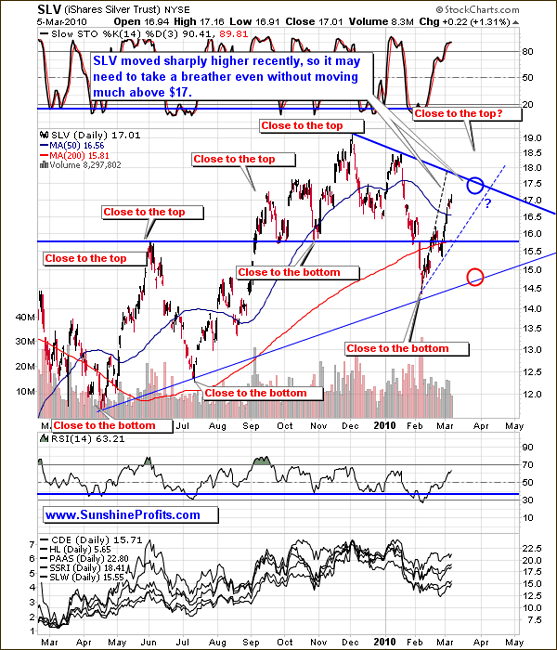
The short-term chart provides us with more details as far as timing is concerned, since it includes the cyclical turning points. Over a week ago it appeared that the next extreme will be a local top and that it will be formed near the end of March.
While the timing itself didn't change much, based on this week's action, we believe that one needs to consider the possibility that the extreme that the next vertical line suggests will be a bottom, not a top. Naturally, the final call is up to you, but in our view the situation isn't bearish enough to open speculative short positions in silver at this point, and it is not bullish enough to keep the long ones open.
Moving on to the precious metals stocks, let's begin with the long-term chart of the HUI Index.
Precious Metals Stocks
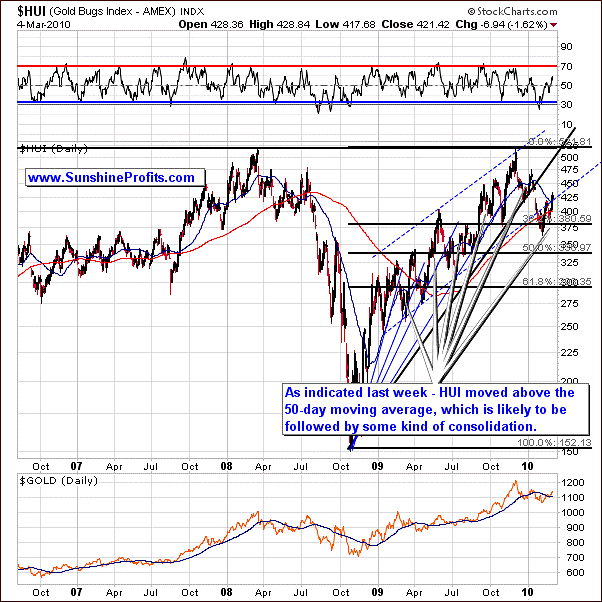
Two weeks ago we wrote the following:
The analysis of the long-term HUI chart suggests that gold stocks may need to move a little higher before forming a temporary top. In the past, local tops have been formed after HUI Index moved above the 50-day moving average, which hasn't been the case yet.
During the past several days, HUI Index has in fact moved above the 50-day moving average, which meant that one might expect a local top to be reached rather sooner than later. This was also one of the factors that we took into account before we decided to send out the Market Alert on Wednesday.
Moreover, the situation on the short-term chart suggests that a short-term resistance level has been reached.
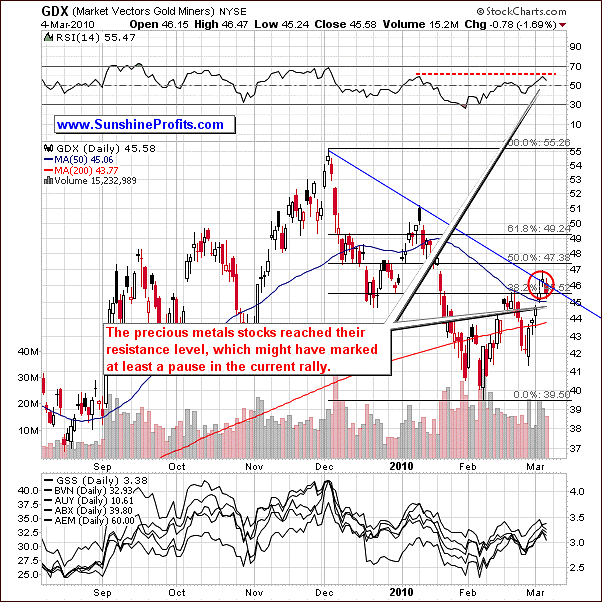
Not only did the value of the GDX ETF move to the declining resistance level (blue line), but it also failed to confirm the breakout above the 38.2% Fibonacci retracement level (black horizontal line near 45.5.)
One of the ways in which a breakout can be confirmed is that the price breaks above a given level and then manages to stay there for at least three consecutive days. This has not been the case here so far. Additionally, the RSI indicator is near the 60 level and the last time that this was the case, we have seen a temporary top - in early January.
One of our unique indicators from the Premium Charts section is also suggesting that we are near a turning point.
Sunshine Profit Unique Indicators
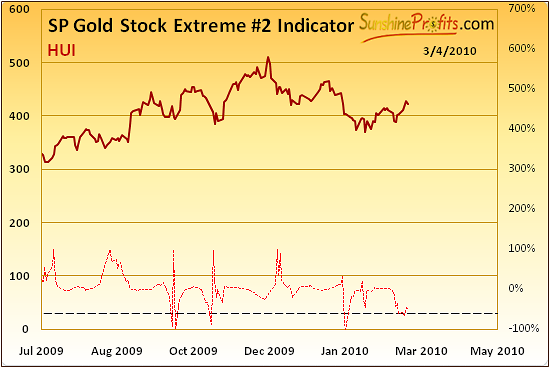
The SP Gold Stock Extreme #2 Indicator (previously known as the Top #2 indicator - we've changed it's name so that it better corresponds to the way it works) has recently touched the dashed line which signaled that we are near a turning point in the metals.
We didn't get a confirmation from the other SP Extreme Indicator this week, but given other factors mentioned above, this is another reason to remain cautious and to take at least some profits off the table by closing the speculative (!) long positions in the metals and corresponding equities. Naturally it is possible that the PM sector has further to go from here, but it doesn't seem very probable that it would get far, and the risk of a sharp downturn is big.
Precious Metals Stocks Outperformance Relative to Other Stocks
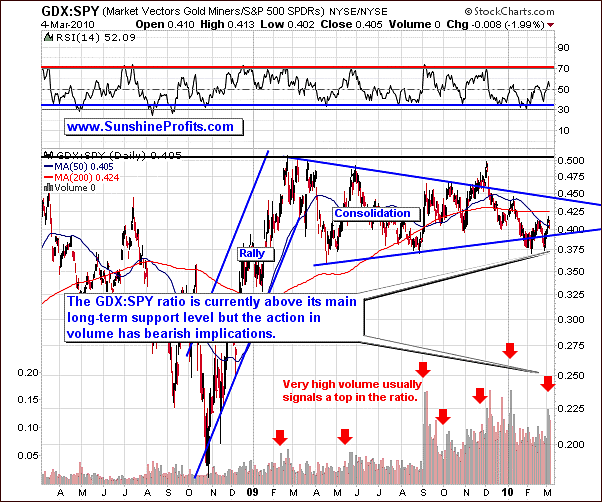
Another confirmation of the bearish short-term points made above comes from the GDX:SPY ratio (it measures the outperformance of PM stocks relative to other stocks).
We have also featured the above chart in the December 4th 2009 Premium Update. Back then we wrote the following:
In the past the GDX:SPY ratio topped on a relatively high volume, and this is also what we have just seen. (...) The top in the above ratio is very likely to correspond to top in the PM stocks, and also to the top in the metals.
In the following days/weeks the value of the GDX:SPY ratio declined significantly along with prices of gold, silver and precious metals stocks. The high volume in this ratio has also accompanied the local top in the early January, and this is also what we have seen right now. Therefore, keeping a speculative (!) long position in the PM sector at this point does not seem to be a profitable decision.
One more "watch out!" signal comes from the analysis of the Gold Miners Bullish Percent Index - a market breadth/momentum indicator that is calculated by dividing two numbers: the amount of gold stocks on the buy signal (according to the point and figure chart, which emphasizes strong moves while ignoring small ones) and the amount of all gold stocks in the sector.
Gold Miners Bullish Percent Index
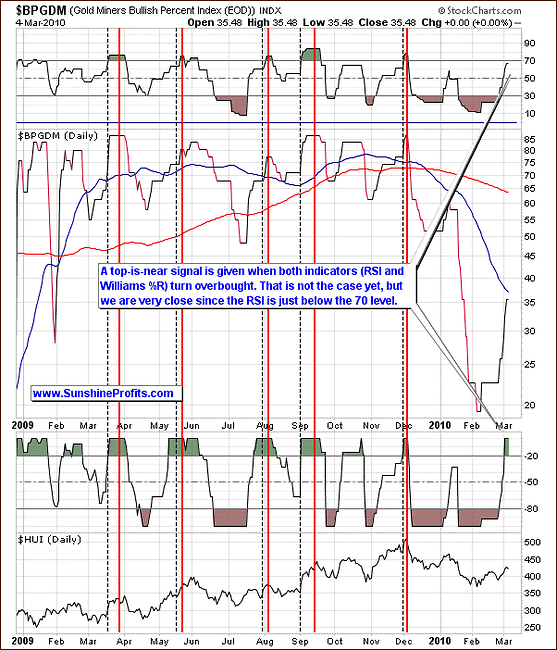
On Dec 4th 2009 we wrote the following:
The high-probability sell signal is given if this index moves higher, and both indicators (RSI and William's %R) used on the above chart become, and then stay overvalued for some time. The initial overbought signal is marked with the vertical dashed black lines, and the top signal is marked with red lines. The overbought signal was given several days ago, so the probability that the top is already in, is relatively high.
As mentioned above, prices declined soon after that. Since Dec 4th 2009, we have not seen the abovementioned signal, but it seems that we are about to see it very soon. The Williams %R indicator is already in the overbought territory, and the RSI Indicator is slightly below the 70 level. Naturally, it didn't go above this level yet, but the situation is risky enough to consider closing out the speculative (!) long positions in the PM sector.
Juniors
As stated in the Key Principles section, the list of top juniors will be updated approximately every 4 weeks, so this is the Update that should contain the revised version of the list. The tables below feature our favorite junior stocks at the moment of writing these words. For more information on how you can use these lists please refer to the Key Principles section, especially to the part dedicated to juniors.
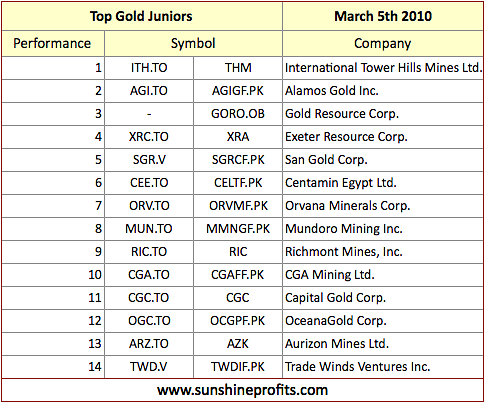
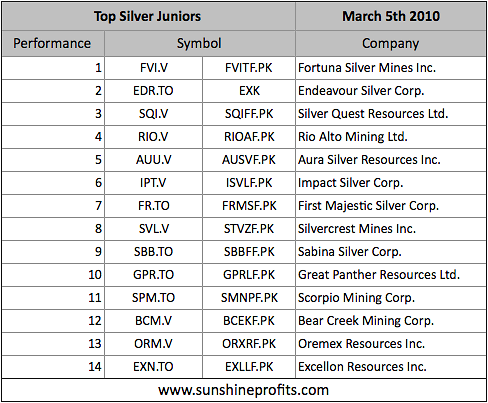
There are virtually no changes since the last month, meaning that the stocks that were strong (on a comparative basis) last month are still holding relatively well.
Please note that - as explained in the January 15th Premium Update - we currently don't recommend owning juniors with a large part of your capital because of their very high correlation with the general stock market and the bearish situation on the latter.
Back then we wrote that if you are risk averse, switching from juniors into physical gold/silver, seems to be a good idea, which turned out to be a good call.
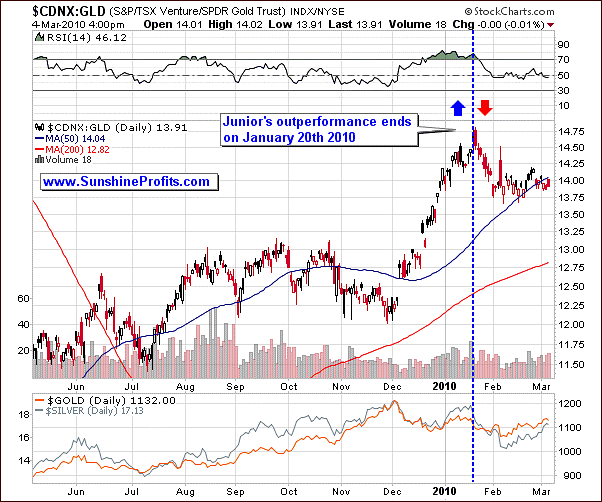
The value of the GDNX:GLD ratio has moved lower since the mid-January. CDNX (the Toronto Stock Exchange Venture index) is commonly used as a proxy for juniors. It consists of about 500 largest stocks listed on that particular exchange, most of which are junior mining companies.
The situation has somewhat calmed down meaning that the ratio has been trading sideways in February, but we have not seen any sings that would suggest that it is safe to move into juniors with a large part of one's capital.
Summary
The fundamental situation on the USD Index has improved, because the situation in the Eurozone is less than perfect, but that doesn't mean that the U.S. Dollar will move much higher in the short-term. Charts suggest that a brief rally is possible, but it is not very probable that it would take the USD Index above the 82 level. It is not certain how big influence would this action have on the precious metals market, because of the rather low correlation between USD and PMs. The precious metals sector moved on average in the opposite way to the U.S. Dollar during the past 10 trading days, but the size of this dataset is too small to make any conclusive calls (it is big enough to make one consider taking some money off the table, though.)
The general stock market still seems to be the most important short-term driver of the PM prices, which has bearish implications for the latter, as the main stock indices are now approaching strong resistance levels and they are rising on a relatively small volume.
Gold, silver and PM stocks' charts give less precise signals, which may mean that they are to trade sideways for some time instead of making a sharp move in any direction, but there are many signals coming from other charts that suggest that we may be near a local top.
Consequently, keeping an open speculative long position in the PM sector does not seem profitable from the risk/reward perspective. In our view, the risk of losing the profits that this rally has generated (and the potential size of the loss) is bigger than the chance of increasing them (especially given how much could be gained in addition to what we have already gained.)
As far as the target for the decline (if one does materialize) is concerned - it is too early to say. We will keep you updated and get back to this topic once we have more information.
This completes this week's Premium Update.
Thank you for using the Premium Service. Have a great weekend and profitable week!
Sincerely,
Przemyslaw Radomski

