
When politicians talk it is always a good idea to try and read between the lines.
This Tuesday China's chief foreign exchange regulator, Yi Gang, told reporters that China is not interested in increasing its gold reserves.
Really?
Mr. Yi's speech was accompanied by a downswing in the gold price - they moved lower by mere $3 within an hour of his speech but since then the market seems to have absorbed the news and moved on. On Wednesday speculation grew that accelerating inflation will force China to raise interest rates.
Investors and newsletter writers (we among them) have long speculated that China has a pressing need to start buying gold to reduce its giant hoard of U.S. dollars. We conjectured that China might buy the 191.3 tons that the IMF wants to sell. After all, what could be more logical than to buy the gold off-market?
But Mr. Yi, who is the director of the fortuitously named SAFE, (China's State Administration of Foreign Exchange) had a few things to say that seem to put a damper on the planned Chinese gold party.
"Gold is not a bad asset, but currently a few factors limit our ability to increase foreign exchange investment in gold," he told reporters.
He noted that gold tends to be volatile and that gold's returns are not steady enough to allow SAFE to increase investment in the yellow metal. Buying gold would cause the price to shoot up.
The exact composition of China's $2.4 trillion of reserves, the world's largest, is a state secret and the subject of intense scrutiny by global investors aware that, with such astronomical sums at stake, even small portfolio shifts can shake markets. Global investors are equally attuned to any clues about the yuan, given its role in China's trade with the rest of the world and the potential spill-over effect a stronger yuan would have on other currencies in Asia.
Trade statistics released this week show that when compared with the same month last year, both Chinese exports and imports grew at a higher-than-expected rate, with the value of imports climbing 44.7%, reflecting growing domestic consumption in mainland China. The value of outbound goods and services surged 45.7% from February 2009 on a recovery in demand for Chinese goods. The growth in exports is likely to add to international pressure on China to allow the yuan (renminbi) to appreciate.
China realizes that it would be difficult to buy all the gold it wants without sending the price through the roof. That would be like an elephant shopping in a china shop. Let's keep in mind that in April 2009 the price of gold received a boost from China's first acknowledgment that since 2003 it had increased its reserves by 454 metric tons to 1,054 to become the world's fifth largest holder of gold. China accumulated the gold quietly without the whole world noticing and without elaborating on where it had sourced the additional bullion. It was believed that the gold came from domestic sources and may have included refined scrap metal.
Based on data from the World Gold Council, China is the world's largest gold producer and the second-largest consumer of gold, after India. Chinese annual gold output is approximately 300 metric tons, while the nation consumes roughly 400 metric tons per year, according to Mr. Yi, who also serves as vice governor of the People's Bank of China. China's gold holdings represent only a small portion of its total foreign-exchange reserves. According to figures of Chinese holdings at the end of 2009, gold comprised approximately 1.6% of China's foreign-exchange reserves at the current market price of gold.
So, if you take Mr. Yi at his words, it would seem that China doesn't have plans to buy gold on the open market. That may well be the case, but we find it hard to believe that China is giving up its quest to increase its gold holdings. It would seem a more prudent course of action to publicly say that you don't want to buy gold, but to buy relatively small amounts on dips when no one is paying attention.
There are other possibilities and here is where we need to read between the lines and see what other Chinese officials have been saying about gold. An official from the China Gold Association told The China Daily that rather than buy gold from the IMF, China would buy gold directly by buying gold mines "abroad" thus giving China a constant and permanent supply without moving the markets.
It is interesting to notice that while gold is up 70% since the summer of 2006, gold stocks, as measured by the Gold BUGS Index, have not done nearly as well. It used to be that a 10% move in gold meant a 20% move in gold stocks. But it seems that this relationship had broken down during the maelstrom of the financial crisis.
China is in an awkward position. It can't buy gold on the open market without sending prices through the roof; neither can it unload U.S. Treasuries without sending those prices through the floor.
Mr. Yi told reporters in the same press conference, that "risk prevention and management is always our priority." He said that Beijing has established a diversified currency for its $2.4 trillion foreign exchange reserves, including the U.S. dollar, the Euro, and currencies of unidentified emerging markets. "The U.S. Treasury market is the world's largest government bond market. Our foreign exchange reserves are huge, so you can imagine that the U.S. Treasury market is an important one to us," he said.
It's like what British economist John Maynard Keynes said. If you owe the bank thousands, you are at the mercy of the bank. If you owe millions, the bank is at your mercy. In other words, if the U.S. owes China trillions, it is not just America's problem, but also China's. Just like the bank realizes that it has a financial incentive to wait for better times and to see that its large creditor does well, so it is in China's interest to express public confidence in U.S. debt and prop it up. (Another version of that saying goes that if you owe the bank a little it is your problem. If you owe the bank a lot, it is the bank's problem.)
If we were present at that press conference we would have asked Mr. Yi if he is so intent on avoiding risk, why the huge Chinese investment in U.S. Treasury notes? Governments that engage in endless deficit spending are clearly not a safe investment, as amply evidenced recently by Greece. In fact, the China Daily recently quoted a top ranking Chinese economist as saying that it would not be a good idea for China to buy Greek bonds.
Greece has a lower debt rating than the US and its statistics have been challenged by the European Commission. It is unreasonable for an economist to support a diversification from an unsafe asset class to a much more unsafe asset class.
Please notice that he described U.S. Treasury bills "an unsafe asset class."
Yi is undoubtedly aware that if China were to be detected bailing on T-notes, the market for them would disintegrate. So what can China do?
By saying that it is not interested in gold China hopes to keep the prices down, and by creating the illusion of confidence in U.S. Treasuries, it can prop up a market "too big to fail" long enough to exit slowly over time. Speaking of the U.S. Economy, let's begin this week's chart (charts courtesy of http://stockcharts.com) analysis by taking a look on the general stock market.
General Stock Market
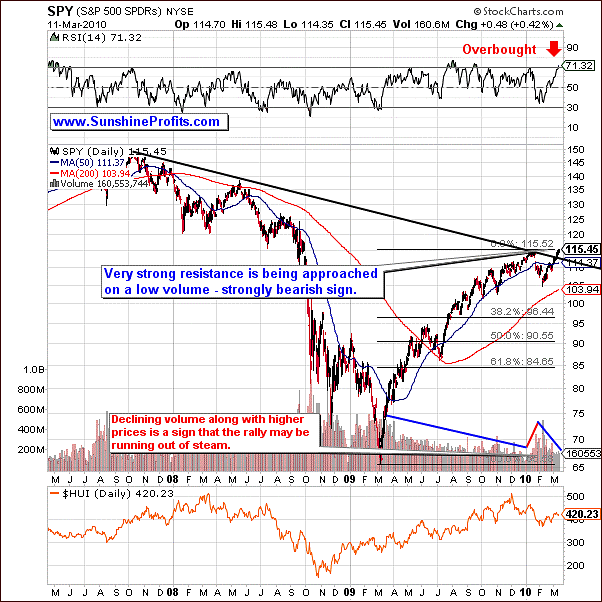
The Spiders ETF (SPY), which we usually refer to as a proxy for the general stock market is exhibiting a short-term uptrend, as visible on the above chart. From the technical point of view it is rising based on the following:
The 50-day simple moving average (here: simple means that it's a simple arithmetic average, not a geometric, nor the exponential one) is above the 200-day simple moving average
Several indicators are moving higher, for instance the MACD indicator and the On Balance Volume (OBV) indicator.
However, there are many signals that the general stock market might move lower soon. Technical evidence that the Spiders (SPY ETF) of the exhaustion of the trend include:
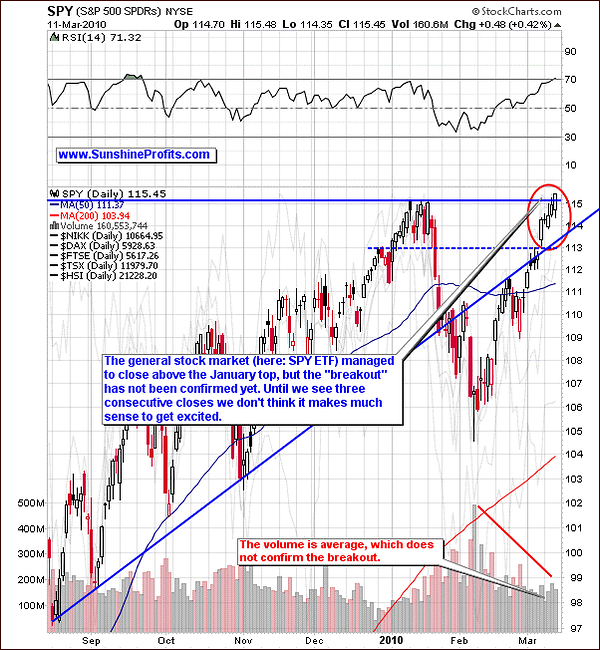
We are trending into a robust resistance zone and it is doing so on relatively low trading volume. The general stock market is now right at the previous top, and is not much above the multi-month resistance level. It seems that there is not enough buying power for the prices to hold the recent "breakout."
The Relative Strength Index (RSI) is currently exhibiting a market that is overbought. In the past, when this indicator moved above the 70 level it suggested that at least a local top is near - it's visible on both long- and short-term chart.
Looking at the chart you can see that during this most recent rally that the 50-day moving average (blue line) has been a likely place that the SPY retreats. That is a very rough estimate, but it gives further evidence that we will probably see at least a short-term pullback.
If the market breaches both the 50-day and 200-day support areas then you could easily see a bigger decline to key Fibonacci ratio support levels. Please note that the closest retracement level (61.8%) is much lower than where we are today - below the 97 level.
Summing up, the short-term probability of a slight decline is certainly high based primarily on lower relative volume, strong resistance and an overbought market. Please keep in mind that if the market breaks below the 200-day moving average then you might want to consider getting defensive (perhaps shorting it) as bigger declines are more than likely. However, if this current resistance zone is in fact broken and verified - the SPY market closes higher for 3 consecutive days on high volume - then the resumption of the uptrend would be confirmed.
USD Index
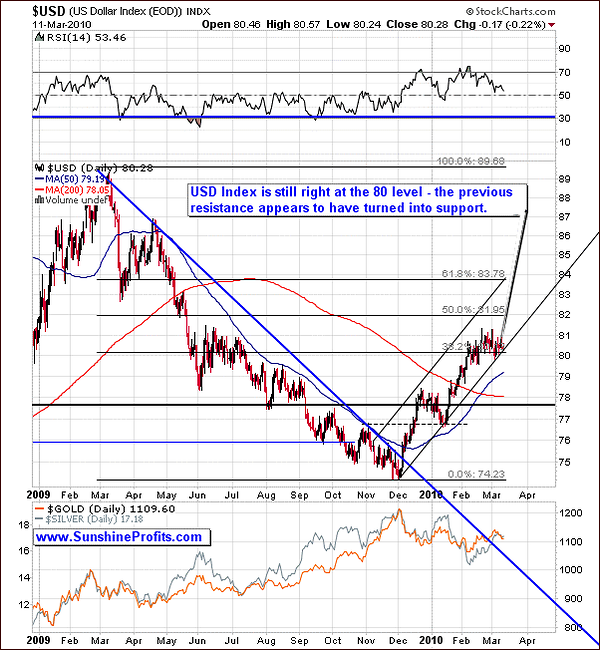
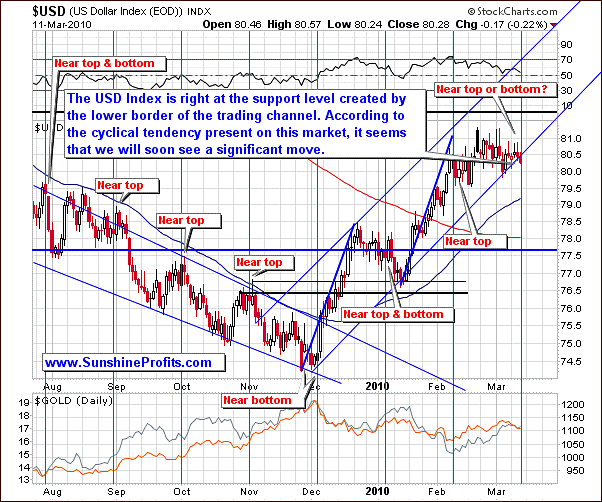
The USD Index is behaving like it is poised to bounce off the key support levels. This is based on the cyclical nature for USD (as visible on the short-term chart) and the fact that it is currently right at the bottom of the trading channel and the Fibonacci retracement level (long-term chart).
The red vertical lines visible on the short-term chart used to mark the moments close to the turning points in the U.S. Dollar. Since it appears that we are not right at the turning point, it is likely that we will see a significant move relatively soon. Naturally, the question is if this move is going to be up or down.
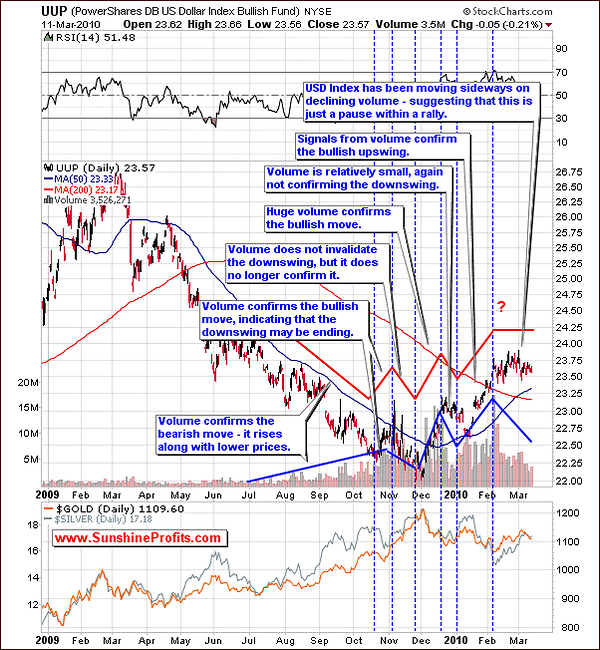
Please note that the USD is currently trading right at a key Fibonacci support level and looking at the UUP exchange traded fund (ETF), which closely tracks the index, you can see that volume is actually declining while the underlying USD is trading sideways. This indicates that this is probably a pause in the short-term trend before resuming the upswing.
The RSI Indicator that used to provide important short-term sell signals in the recent months (as visible on the short-term chart) is now close to the middle of its trading range. This means that a move in either direction is not unlikely.
Summing up, on one hand, the low volume is one of the characteristic things for the consolidation phase, and on the other hand a trend is in place until we see a confirmed breakout, or other strong evidence that lower prices are likely in the short run. So far we have not seen that yet, so the trend remains up.
Another question stemming from the analysis of the USD Index is how this situation can influence the prices of precious metals. This is where our correlation matrix comes into play
Correlations

In the previous Premium Update we wrote that we had seen changes in the 10-day column for the USD Index rows and that it was a subtle indication that the USD Index may soon once again become an important short-term driver of the PM and PM stocks' prices.
However, this week, the 10-day column for the USD Index does no longer indicate the high short-term correlation with the PM sector. The numbers are close to 0, which means that both markets have traded rather independently.
Still, the 30-day column indicates that PMs are now driven by the general stock market, which means that points made in the section dedicated to the latter are one of the key factors while analyzing gold, silver and PM stocks. Speaking of gold, let's see what the charts are suggesting at this point.
Gold
In the previous Premium Update we wrote the following:
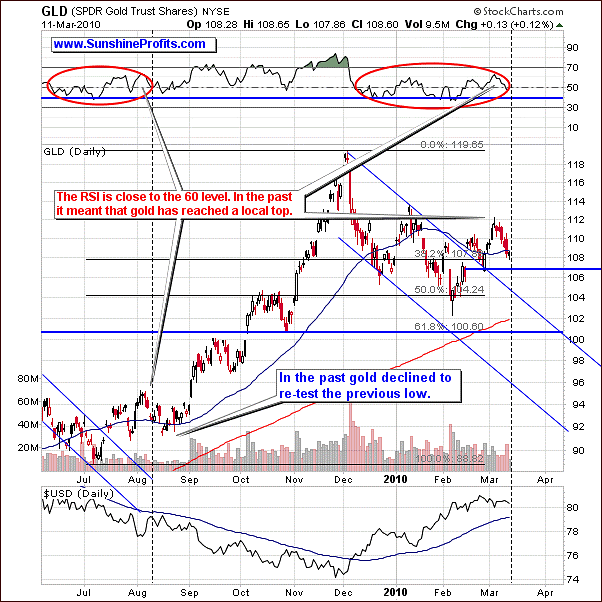
The short-term chart reveals that the situation in the gold market is still self-similar also in the short run. It appears that the RSI Indicator moved, forming a high around the 60 level, just like it did in early August 2009, after which gold prices moved lower for about 2 weeks. Since the current move is still very similar to what we've seen in the middle of 2009, we might see some kind of consolidation here - perhaps 2-3 weeks of lower prices.
This is precisely what we've seen this week - gold moved lower along with the RSI and Stochastic indicators. Please note that we've mentioned 2-3 weeks of consolidation and so far we've seen only one week of the corrective action, which suggests that caution is still necessary. The bullish analogy is that when the previous correction (August 2009) was completed, gold surged very high. Still - as mentioned earlier - much depends on the general stock market.
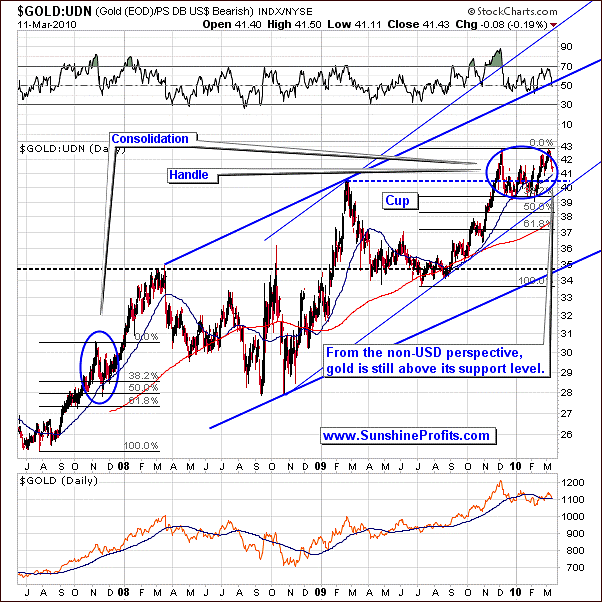
The red ellipses on the short-term chart above mark the self-similarity on the gold market, and the vertical dashed line shows where "we are today" if the situation is to repeat itself so closely as it was the case in the past several days. Please note that the analogy does not only cover the price itself, but it is also present in the RSI indicator, and - what is very interesting - gold's performance relative to the U.S. Dollar.
During the first half of August 2009, gold declined along with the U.S. Dollar, however once the negative correlation returned - in the second half of August - it was a sign that "something is in the works." Soon after that we got a confirmation in the form of a big rally on strong volume, and the massive upleg begun. Taking the historical performance into account, once we see that the negative correlation between gold and the USD Index has returned we might consider it as a "get-ready-to-buy" signal.
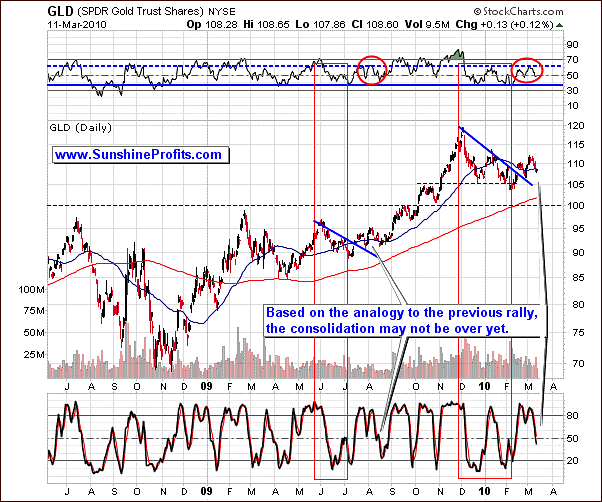
The last of the above gold charts features gold from the non-USD perspective (please read the February 26th 2010 Premium Update for more details), and while it does not provide us with a specific trading signal, it shows that the price of gold is not at a support level at this point. This means that a move lower from here is possible.
Summing up, based on how gold prices behaved in the past, as measured by the Gold ETF (GLD) points to a further pullback to the last bottom (near $1,090). During the similar situation in the past the stochastic, RSI and price were all aligned this way the prices retreated back to make another short-term bottom before returning back to their uptrend. Still, much depends on how the situation resolves in the general stock market.
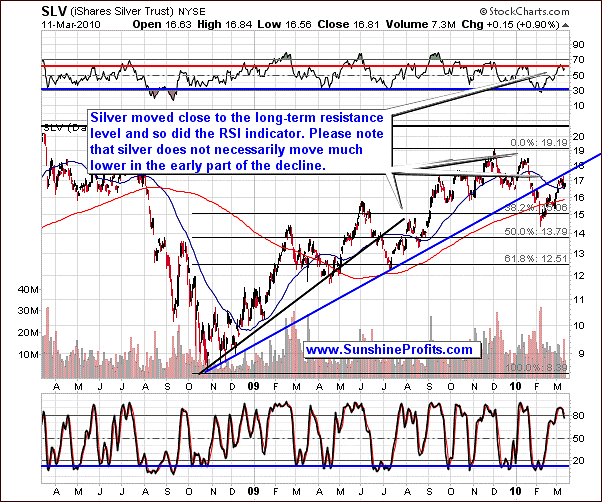
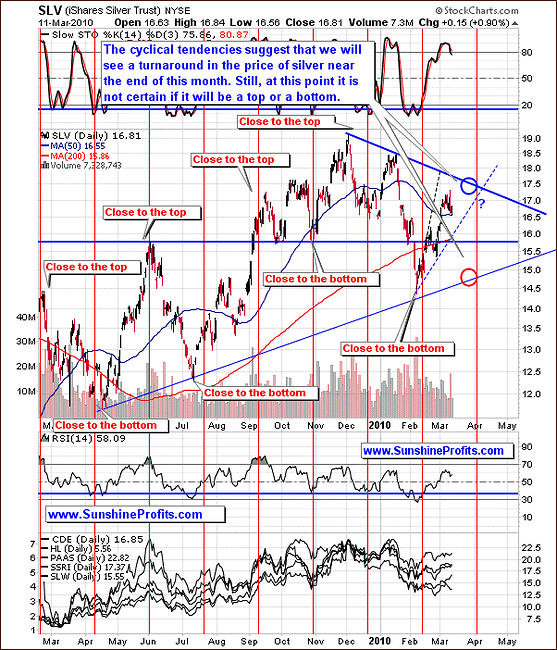
Silver
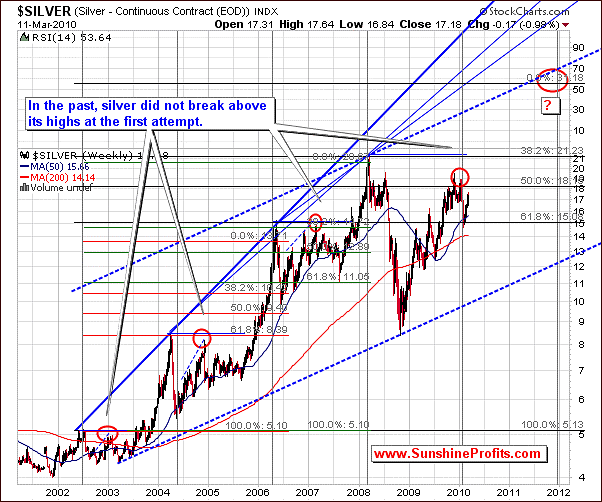
Beginning with the very-long-term chart - silver is still showing long-term strength (along with positive fundamentals) with higher prices projected out to 2011. This estimation is founded in a large part on the long-term cyclical turning points present on the silver market that we've originally featured in the November 13th 2009 Premium Update. Please note how precise that particular signal was in timing the end of the rally.
Consequently, the end of the 2011 is also likely to mark a significant turning point in the price of silver.
However, the shorter-term situation is not as bullish. The last two charts are suggesting that silver will be a bit anemic over the shorter-term. Although it was not clearly visible in the past weeks, looking at the charts with the RSI and stochastic readings in mind, silver's historical cyclical tendencies point to a downturn. This decline could be easily triggered by a downturn in the general stock market.
There's one more thing that we'd like to emphasize as far as silver is concerned. Please note that the white metal has been recently rather reluctant to move lower along with other parts of the PM sector. This might be seen as a short-term bullish sign at the first sight, but we believe that this interpretation might be misleading. First of the two reasons is silver's high correlation with the main stock indices, which have been rising lately (but are not likely to move much higher) and the second one is that this is exactly the way one should expect silver to behave during the topping process.
Please take a look at the mid-August 2009 top, mid-October 2009 top, late-November 2009 top, and the early-January 2010 top. They have all begun with a small consolidation, during which silver didn't move much lower, which gave hope to all silver bulls. Still, a sharp slide followed erasing profits of those who refused to close their long positions in the white metal. Again, if this might be the case also today - we might see silver move to the $15 level.
Summing up, speculative bullish positions right now should be done with extreme caution, and only if you are able to monitor the market for almost the whole session. As stated in the previous updates, we currently don't recommend holding speculative long positions in gold, silver and PM stocks, and there are too few clues to open short positions either. We realize that it doesn't sound encouraging especially for active Traders, but opening a speculative position at this point doesn't seem justified from the risk/reward point of view. Naturally, that is just our opinion and since it is ultimately you, who manages your money, we respect and are perfectly fine with whatever decision you make.
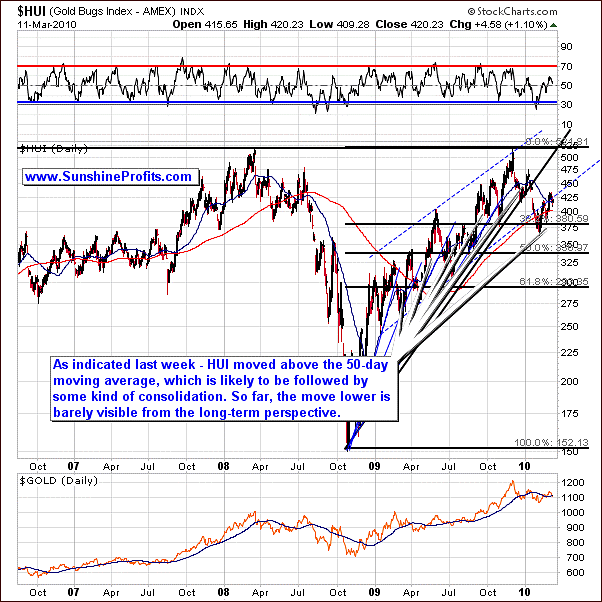
Precious Metals Stocks
In the previous Premium Update we wrote the following:
During the past several days, HUI Index has in fact moved above the 50-day moving average, which [in the past] meant that one might expect a local top to be reached rather sooner than later. This was also one of the factors that we took into account before we decided to send out the Market Alert on Wednesday.
Moreover, the situation on the short-term chart suggests that a short-term resistance level has been reached.
Consequently, the PM stocks moved lower along with the underlying metals. The long-term HUI Index chart shows that gold stocks declined after having bounced off the resistance level created by the lower border of what was previously a rising trend channel. Since gold stocks didn't manage to move above this resistance level, we might see another decline - and possibly a re-test of the Fibonacci retracement level at the 380 level.
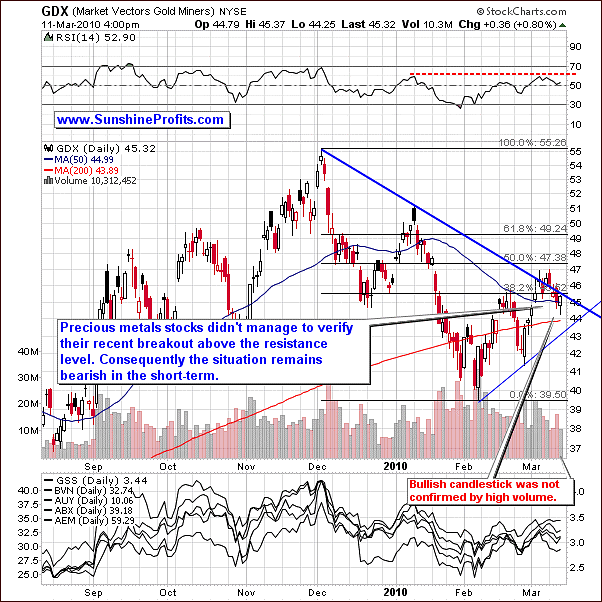
The abovementioned rising trendline is not the only resistance level that the PM stocks failed to break recently. As you may see on the short-term chart the GDX ETF (proxy for the precious metals stocks, which allows us to analyze volume) was trying to move above a resistance level created by the declining resistance line, and the first Fibonacci retracement level (38.2% of the previous decline), but after several attempts it still didn't manage to do so, which by itself is a bearish signal.
Last week we wrote the following:
Not only did the value of the GDX ETF move to the declining resistance level (blue line), but it also failed to confirm the breakout above the 38.2% Fibonacci retracement level (black horizontal line near 45.5.)
One of the ways in which a breakout can be confirmed is that the price breaks above a given level and then manages to stay there for at least three consecutive days. This has not been the case here so far. Additionally, the RSI indicator is near the 60 level and the last time that this was the case, we have seen a temporary top - in early January.
Consequently, PM stocks declined, and at the moment of writing these words are still below the abovementioned resistance level. It seems that breakout is turning out to be a "fakeout", which by itself is a bearish signal.
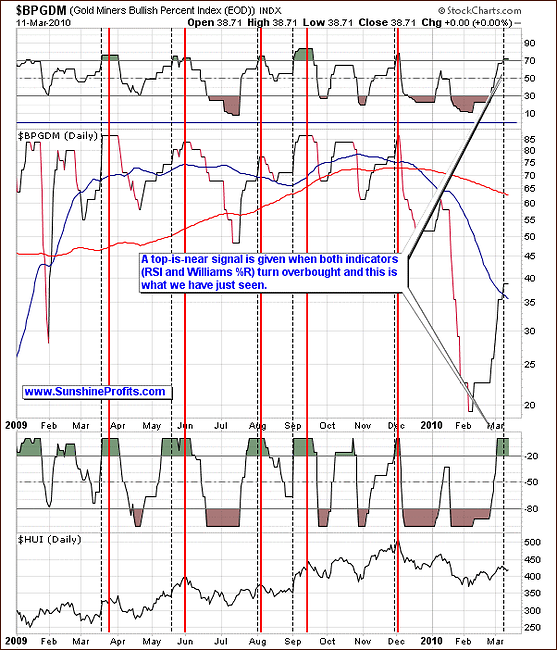
The final bearish signal that we would like to focus on this week comes from the analysis of the Gold Miners Bullish Percent Index. In the previous update we wrote the following:
The high-probability sell signal is given if this index moves higher, and both indicators (RSI and William's %R) used on the above chart become, and then stay overvalued for some time. The initial overbought signal is marked with the vertical dashed black lines, and the top signal is marked with red lines. The overbought signal was given several days ago, so the probability that the top is already in, is relatively high.
As mentioned above, prices declined soon after that. Since Dec 4th 2009, we have not seen the abovementioned signal, but it seems that we are about to see it very soon. The Williams %R indicator is already in the overbought territory, and the RSI Indicator is slightly below the 70 level. Naturally, it didn't go above this level yet, but the situation is risky enough to consider closing out the speculative (!) long positions in the PM sector.
The big news this week is that we have just seen the RSI move above the 70 level, which along with the Williams %R indicator above the 80 level - according to the abovementioned methodology - is a "top-is-near" signal. Therefore, it is a move lower from here that one can expect as far as the PM stocks are concerned, not further gains.
Summing up, looking at the exchange traded fund (GDX), which serves as a proxy for precious metal stocks, and the HUI Index, the longer term trend still points to declining prices. Over the shorter term there is a possibility of a breakout through resistance as it bounces off a Fibonacci retracement level; however the probabilities do not point to it due to the recent breach of the upward trading channel on weak volume. In other words, the odds favor the short-term weakness in the PM stocks. The question remains how low the PM stocks could go. The best answer that we can give you is once again that much depends on the main stock indices, but the closest support level is currently right at the rising thin blue line - in the $43.5 in the GDX ETF, which corresponds to the 400 level in the HUI Index.
Summary
The precious metals market appears to be consolidating after it reached a temporary top several days ago. Based on the analogy to the very similar situation in the past, it seems that the correction is not over yet. The correlation matrix suggests that the most important thing that PM investors need to take into account at this point is still the general stock market, and the situation on the latter remains bearish.
Moreover, please note that none of our unique indicators has recently flashed a buy signal. Therefore, we currently don't recommend holding speculative long positions in gold, silver and PM stocks, and there are too few clues to open short positions either. We realize that it doesn't sound encouraging especially for active Traders, but opening a speculative position at this point doesn't seem justified from the risk/reward point of view.
We will continue to monitor the situation and will report to you as soon as we spot anything that would invalidate points made in this update. One of the things that would indicate that the PM market is ready to move higher would be the return of the negative correlation between USD Index and gold.
This completes this week's Premium Update.
Thank you for using the Premium Service. Have a great weekend and profitable week!
Sincerely,
Przemyslaw Radomski

