
April 15th is the date to watch. That's when the U.S. Treasury Department is mandated by law to issue a report identifying nations that "manipulate the rate of exchange between their currency and the United States dollar for purposes of ...gaining unfair competitive advantage in international trade."
Does China come to mind?
Already the decibel level in Washington is rising and President Barack Obama isfaced with growing congressional pressure to get tough with China over its currency practices, something he had promised to do during his presidential campaign. The impact of China's currency manipulation on the U.S. economy cannot be overstated, said 130 lawmakers in a letter to U.S. Secretary Timothy Geithner.
"Maintaining its currency at a devalued exchange rate provides a subsidy to Chinese companies and unfairly disadvantages foreign competitors," they wrote.
A Treasury Department report labeling China as a "Currency Manipulator" technically would not result in any U.S. actions against China. But invoking the rarely used act-no country has been named since 1994-would likely infuriate Beijing and give Congress new ammunition to pressure for action.
Many economists estimate China's currency is undervalued by 25 to 40 percent, giving it a huge trade advantage by effectively subsidizing its exports making them artificially competitive. Many U.S. lawmakers blame the lost manufacturing jobs and the huge U.S. trade deficit on this factor. In essence, China gets a huge trade advantage. An undervalued Chinese currency means that Chinese products are cheaper for U.S. consumers, and American products cost more in the Chinese market.
Some go so far as to say the undervaluation of the renminbi has become a significant drag not just on the American economy, but also on global economic recovery.
The New York Times minced no words in a strong editorial this Wednesday.
"China's decision to base its economic growth on exporting deliberately undervalued goods is threatening economies around the world. It is fueling huge trade deficits in the United States and Europe. Even worse, it is crowding out exports from other developing countries, threatening their hopes of recovery."
The editorial continued by saying:
"Beijing's intervention is a textbook example of the beggar-thy-neighbor competitive devaluation forbidden by the International Monetary Fund's charter... The world's battered economy is certainly in no shape to keep absorbing China's exports, subsidized through a cheap currency policy. The more countries that say this, the more likely Beijing will consider changing course - and the less likely this disagreement will escalate into a fight that no one can win. "
This issue is nothing new. There have been complaints that China was manipulating its currency by selling renminbi and buying foreign currencies for at least the past seven years. Since 2003, China's central bank has been purchasing huge amounts of dollars to keep the value of its currency artificially low against the dollar. China eased off somewhat in 2005, allowing its currency to appreciate slowly from 8.25 renminbi to the dollar, to about 6.83 renminbi by 2008. As the global recession hit, China made moves to protect its exports. Since then the renminbi has remained at about 6.83.
Today, China is adding more than $30 billion a month to its $2.4 trillion hoard of reserves. The International Monetary Fund expects China to have a 2010 current surplus of more than $450 billion.
In the last report, issued in October, the Treasury Department said it had "serious concerns" about a lack of flexibility in the value of China's currency against other currencies, but didn't go so far as to label China as a "currency manipulator." If China had been thus designated, it would have triggered negotiations between the two countries and could have lead to economic sanctions if the U.S. took a case before the World Trade Organization.
According to Nobel Prize winning economist Paul Krugman, most of the world's large economies are stuck in a liquidity trap as they are unable to jumpstart a recovery by cutting interest rates because the rates are already near zero.
Wikipedia defines the liquidity trap as a situation where the demand for money becomes infinitely elastic, i.e. where the demand curve is horizontal, so that further injections of money into the economy will not serve to further lower interest rates. In other words, no matter how much money is pumped into the system, it is not likely to help the economy by further lowering interest rates, as they are already extremely low.
"China, by engineering an unwarranted trade surplus, is in effect imposing an anti-stimulus on these economies, which they can't offset," wrote Krugman in a recent New York Times column.
So far China seems nonplused by criticism and is behaving with new assertiveness. It is in no mood for lectures from Washington. After all, it is the world's only major economy still growing strongly, and it is the U.S.'s largest creditor. It makes no secret of its disdain for U.S. economic management.
In his annual press conference this Sunday Chinese Premier Wen Jiabao aimed sharp words at Washington, ceding little ground on China's currency policy.
"First of all, I do not think the renminbi is undervalued," Mr. Wen said "We are opposed to countries pointing fingers at each other or taking strong measures to force other countries to appreciate their currencies. To do this is not beneficial to reform of the renminbi exchange-rate regime."
He accused unnamed competitors (read U.S.A.) of trying to bail out their own slumping economies by hamstringing the Chinese juggernaut.
"I understand some economies want to increase their exports," he said, "but what I don't understand is the practice of depreciating one's own currency and attempting to force other countries to appreciate their own currencies, just for the purpose of increasing their own exports."
Does the U.S. dare to alienate the Chinese since they own so much of U.S. debt? Some ask what would happen if the Chinese took their dollar holdings, equal to around 10% of US GDP, and switched them into other currencies?
Remember what we wrote last week about owing the bank money? If you owe the bank thousands it's your problem. If you owe the bank billions, it's the bank's problem.
In his latest column this week Krugman echoed this.
Krugman analyzes what would happen if China tried to sell a large share of its U.S. assets. Short-term U.S. interest rates wouldn't change because they're being kept near zero by the Fed. Long-term rates might rise slightly, but they're mainly determined by market expectations of future short-term rates, he wrote. The value of the dollar would fall against other major currencies, but that would be a good thing for the United States, since it would make U.S. goods more competitive and reduce the trade deficit. On the other hand, it would be a bad thing for China, which would suffer large losses on its dollar holdings.
"In short, right now America has China over a barrel, not the other way around," Krugman wrote.
Krugman reminds us that in 1971 the United States dealt with a similar problem of foreign undervaluation by imposing a temporary 10 percent surcharge on imports. This was removed a few months later after Germany, Japan and other nations raised the dollar value of their currencies. He says he finds it difficult to believe that China would change its policies unless threatened by similar action. He proposed a 25 per cent surcharge on Chinese imports.
"I don't propose this turn to policy hardball lightly. But Chinese currency policy is adding materially to the world's economic problems at a time when those problems are already very severe. It's time to take a stand."
While, both U.S.A. and China appear to be ready to defend their own views, we get the feeling that somewhere behind curtains the Powers That Be are negotiating the way the value of the U.S. Dollar should decline. The authorities in the in the U.S. want to appear like they've got everything under control, and that they do everything in their power to protect the U.S. Voters. At the same time, they know very well that the situation is going to become either bad or very bad. Consequently, the question is how to achieve a stable decline instead of a dramatic plunge in the standard of living / revolts / possibly a serious military conflict.
- "Hey, why not allow the U.S. Dollar to decline gradually, thus improving the U.S. import/export situation, but at the same time tell everyone that it's not our fault?"
- "Great idea, how about the Chinese authorities? Their currency appears undervalued, so let's tell the world that it caused all the problems. There's no way they are going to let it appreciate, so we will have to depreciate the dollar - we might even get someone to think that the Chinese we're responsible for the recent financial crisis!"
- "OK, let's do it!"
The situation is very tense, and if something goes wrong we might see the value of the U.S. Dollar plunge, and the value of precious metals soar. That's why one of the points made in the Key Principles section is about using at least a part of one's capital to invest in the long run. The chance that such a big rally would materialize on a given day is very low, but the consequences (missing the boat) are very big.
On the other hand, if "everything goes right" and the U.S. Dollar declines gradually, it would mean that PMs are likely to rise in a stable bull market. Naturally, it depends on your attitude toward risk etc., but that's why it makes sense to dedicate a part of one's capital to speculation - to earn money along the way.
Moving on to the technical part of this update, let's begin with the general stock market (charts courtesy of http://stockcharts.com), as we've seen particularly interesting patterns this week. This week's update is to a considerable extent a follow-up on the Wednesday's Market Alert, so it might be a good idea to go through it once again.
General Stock Market
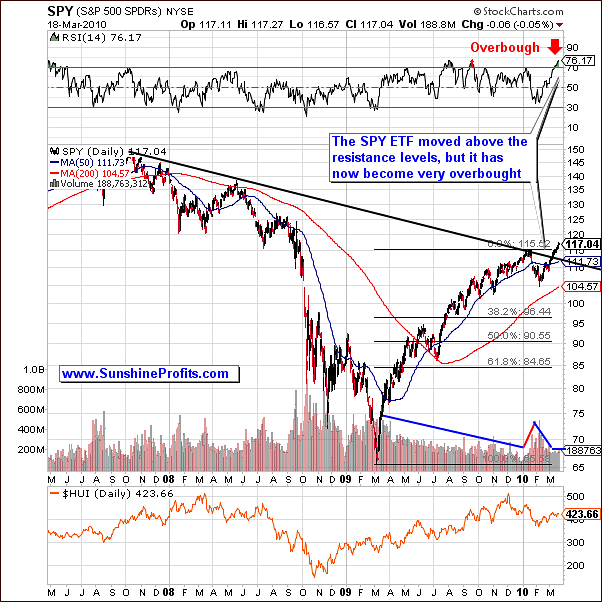
Looking at our usual proxy for the overall stock market the Spiders ETF (SPY) we can see a continuation of the recent uptrend. From viewing the technical indicators on the charts the 50-day simple moving average is still above the 200-day moving average. Keep in mind simple implies a simple arithmetic average versus an exponential or geometric one.
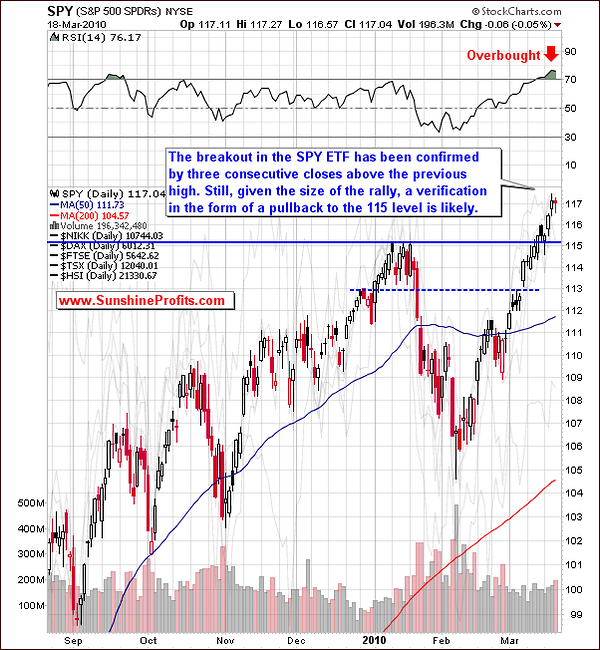
In addition to the up trending moving averages, the Spiders have had 3 consecutive closes above the previous high, which often times confirms the breakout. The Spiders have busted through resistance levels making it more likely for continued higher prices over the short run. Given the loose fiscal/monetary policy (stimulus plan) allowing for historical low interest rates we may indeed see stocks rise in nominal terms. Strong tide lifts all boats, meaning that we might see stocks with relatively weak fundamentals to participate in the upswing as well, thus indices may (!) move higher. Generally, it's not that the fundamentals have changed recently - ultimately it is investor's perception toward fundamentals that shapes the prices, not the fundamentals by themselves, and this is why we need tools such as the technical analysis to estimate what's likely to take place in a few days/weeks/months.
Naturally, the inflationary pressure caused by the loose monetary policy is naturally a positive factor for gold, silver and PM stocks.
Things to keep in mind is the upward trend could be short lived as we are currently in an extremely overbought market as pointed out by the Relative Strength Index (RSI) being over 75. The RSI is a technical indicator that measures the rate of price change.
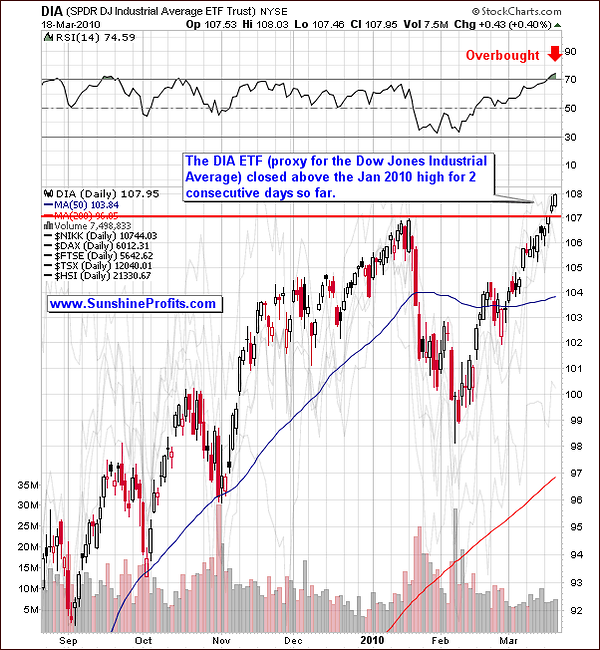
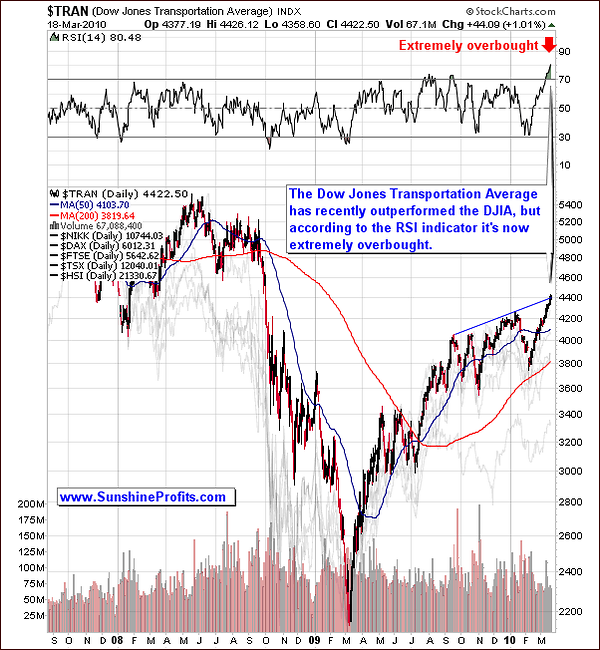
The indicator is indexed to run from 0 to 100 and usually moves between the values of 25 and 75, and values over 70 are considered to indicate an overbought market. Please note that not only is the SPY ETF overbought, but it is also the case with other proxies of the stock market - DIA ETF (so called Diamonds - that's the ETF based on the value of the Dow Jones Industrial Average), and the Dow Jones Transportation Average.
As far as the latter is concerned, please note that it has moved very high very quick and the RSI on this chart is even above the 80 level. It has managed to move above its January 2010 high before the rest of indices, but it now reached a resistance level. This means that a correction of some sort is likely.
Couple this with the tendency of the Spiders to run into price resistance with similar RSI readings in the past as well as the tendency to retrace back to the 50-day moving average and you can see why the continued rise will probably exhaust itself or least take a bit of break pretty soon. You also have a situation where the continued higher prices are being established on anemic volume levels - the volume is not dramatically low (which would serve as a "sell" signal), but they are not very high either (which would suggest that stocks are to move higher even without a correction in the next several days/weeks.)
Summing up, current price action (if we get another close above the previous high in the DJIA and corresponding Diamonds ETF, and we expect it to happen today) certainly indicates that the rally will continue over the short-term. However, look for a pullback to come in the not too distant future as the market is hitting extreme overbought conditions as well as the tendency for the market to retrace at these RSI levels. If recent resistance levels that are now support are breached then look for the Spiders in particular to test the 50-day moving average level. Still, a correction to the previous highs (marked on the charts with a horizontal line) appears to be the most probable outcome.
Meanwhile, the USD Index has also managed to make a decisive move this week.
USD Index
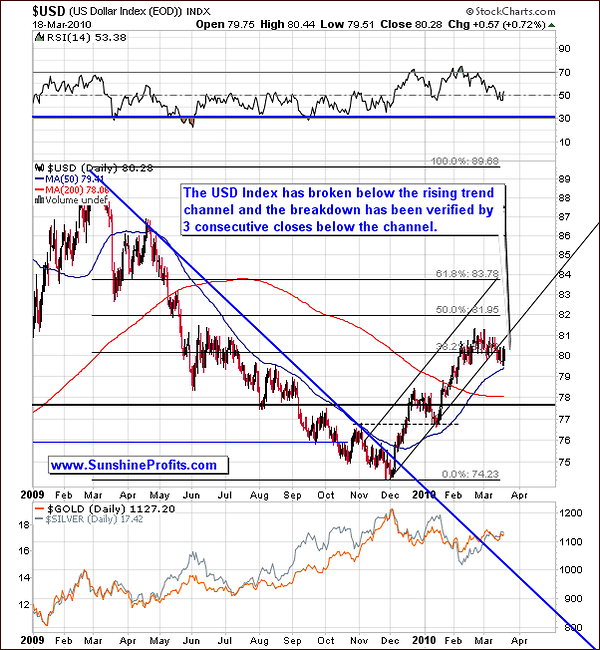
This week saw the USD index break below the up trending channel line. This move was confirmed with 3 consecutive closes below the lower channel trend line, so the next significant move in the index is likely to be down. The USD index still is having a low correlation with the precious metals sector, which means that either action doesn't necessarily influence value of PMs.
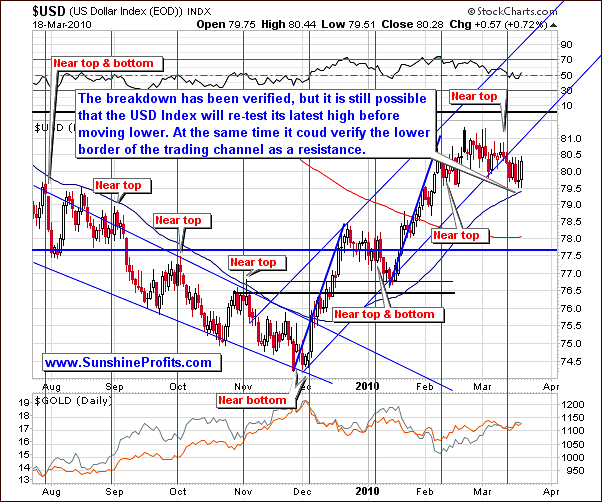
However, what we did see recently is the relatively high (and negative) correlation between the general stock market and the USD Index. Should the latter find some temporary support at its 50-day moving average and move higher, perhaps to re-test its recent high, we could see the USD Index move higher along with lower values of gold. We'll get back to this fact in the following part of the update.
Since the RSI remains pretty much in the middle of its trading range indicating that next move could be in either direction. Again, looking at the chart, watch for a re-test of recent highs before going lower again.
Summing up, there is still a low correlation between PM stocks and the USD Index in the short-term, but it seems that we might see it become visibly negative once again. With a mixed RSI signal and confirmation of the downward breakout the most likely short-term action is climbing to recent highs and then resuming the lower channel breakout, which would serve as a positive factor in the medium-term for the PM sector.
Correlations
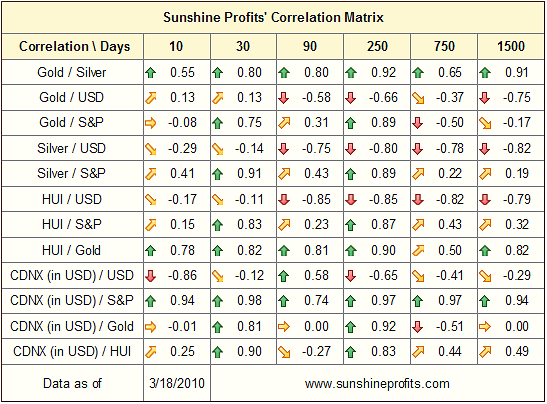
Last week we mentioned that the 30-day column indicates that PMs are now driven by the general stock market, which means that points made in the section dedicated to the latter are one of the key factors while analyzing gold, silver and PM stocks, and this is still the case this week.
Before moving to the analysis of the gold market, please note that there is a subtle difference between this week, and the week before, as far as the USD Index / PMs correlation is concerned.
Last week the 30-day correlation numbers between USD Index and gold, silver, and HUI Index were 0.27, -0.06, and 0.34 respectively. Today we see 0.13, -0.14, and -0.11. These values are nothing to call home about per se, but once you compare them with the values from the previous week we see that they have all declined, suggesting that perhaps we won't have to wait too long for the return of the strong negative correlation between PMs and the USD Index.
Gold
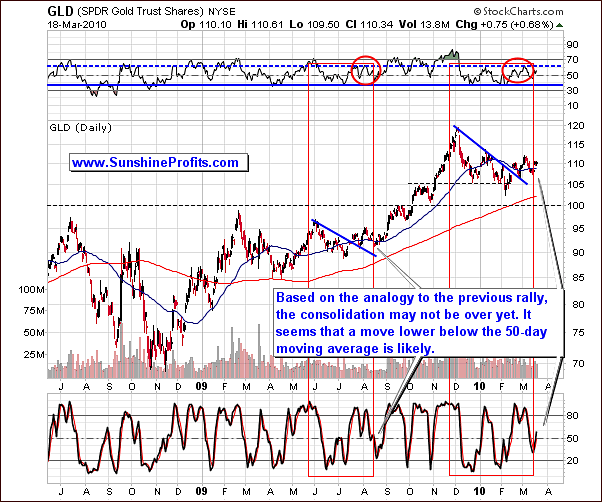
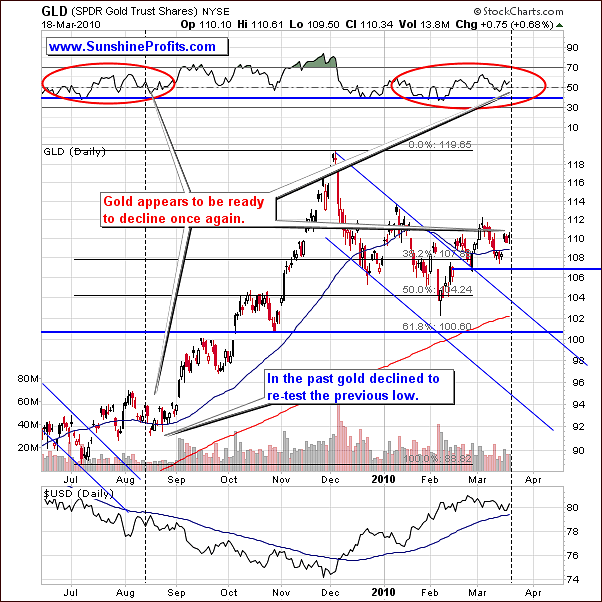
Not much has changed since the last update on the Gold market. One thing to notice is that the RSI and Stochastic are strikingly similar to what was happening in August where prices went down below the 50-day moving average and consolidated before taking off to the upside.
In the current environment look for the Gold Trust ETF (GLD) to retrace back to, or slightly below the 50-day moving average before any significant rally will take place. There still has to be a distinct consolidation pattern followed by higher prices on volume increases. In fact, what we want to see to have confidence that the next leg up in Gold is happening is for volume to be relatively weak during this time that it declines and consolidates at key support levels like the 50-day moving average or the previous bottom near the 107 level in the GLD ETF (about $1,090 in spot gold).
The RSI indicator does not provide us with a specific trading signal at this moment - it simply shows that the price of gold is not at a support level at this point. This means that a move lower from here is possible.
Summing up, weare still looking for some retracement and consolidation in Gold over the short-term - just like it was the case in mid-August 2009. We will especially be watching for weak volume levels when Gold retraces which will match past patterns right before past big rallies. In addition, if volume significantly increases as prices start to move up from key support this would make it highly probable that the next rally in Gold is starting again.
Silver
In the previous essay we commented on the very-long term silver chart, which generated a lot of positive feedback. We wrote the following:
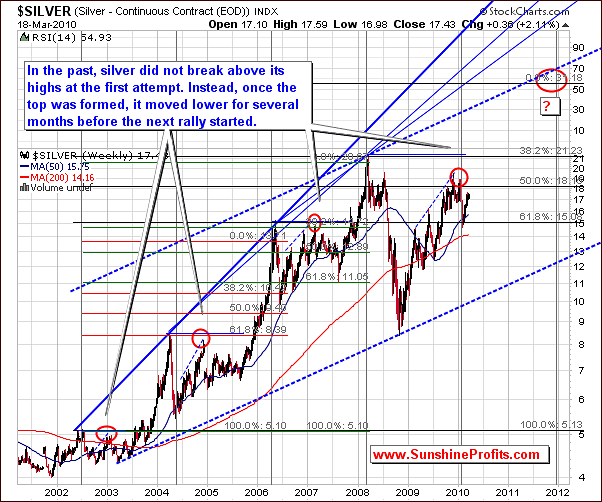
(...) silver is still showing long-term strength (along with positive fundamentals) with higher prices projected out to 2011. This estimation is founded in a large part on the long-term cyclical turning points present on the silver market that we've originally featured in the November 13th 2009 Premium Update. Please note how precise that particular signal was in timing the end of the rally. Consequently, the end of 2011 is also likely to mark a significant turning point in the price of silver.
There is one more thing that we would like to focus on regarding the very-long-term charts, and that is the probable size/range of the current consolidation. Please note that once silver failed to move above the previous high (red ellipses on the first chart + the 2008 top), the time that prices traded sideways from that point was more or less equal the time between the original top and the moment, when prices attempted to break higher.
Should that be the case today, we would need to see silver trading sideways for months before it could finally move higher.
However, there are two reasons that suggest that this is may not be the case this time.
The first one is that the whole 2008 plunge was rather one-of-a-kind event during this bull market, which means that it may be misleading to apply previous trends also to this one. After all, consolidations are needed to discourage the "weak hands" from the market - those, who don't believe in the bull market are in it just to speculate or need to sell, before prices can move up once again. Now, given the size of the 2008 plunge, it seems that the "weak hands" are already out of the market, so silver may not need to consolidate for months before moving higher.
The second reason is that we are currently in the second stage of the bull market (since 2006 or so - that was the time when silver broke above $10, and gold finally managed to move higher in all currencies, not just in the U.S. Dollar), and during this phase corrections are likely to be shorter than it is the case in the early part of the bull market.
The second chart features the range of the correction after silver failed to move above the previous high. Please note that during each correction silver retraced at least half of the previous upswing. Should that be the case also today, silver would need to move below $14 before the final bottom is reached.
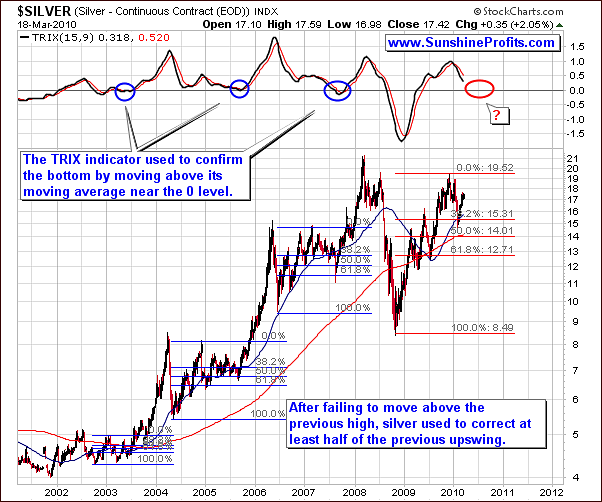
Another reason for a possible short-term top comes from the TRIX indicator, which historically is a very reliable technical indicator in determining major bottoms on the silver market. The way it works is that when the TRIX moves above its moving average above its zero line then the bottom has formed. Looking over the past this has proven to be the case in the silver market. Right now we are not there and it indicates we have more retracing to do before a bottom can be confirmed.

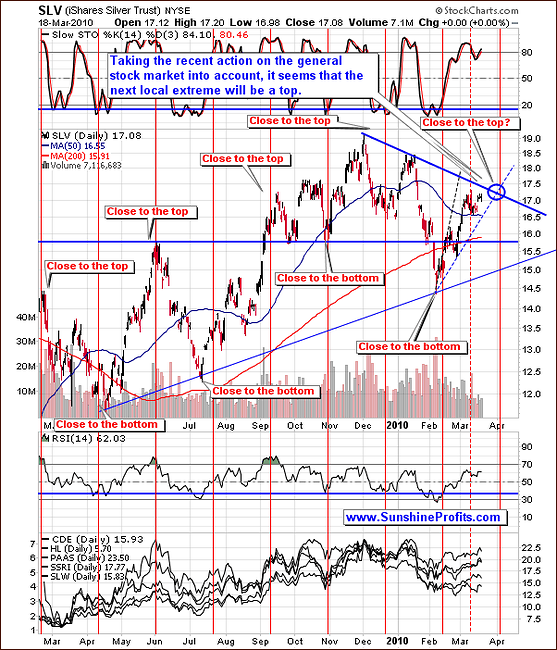
Regular long- and short-term charts appear to confirm that silver is very close to forming a short-term top. Silver has been rising on declining volume and the RSI and stochastic indicators are currently at levels similar to when silver formed a top in the past.
Moreover, silver is now trading close to the resistance level (marked on the short-term chart with declining blue line), and it is currently in the "close to the top" territory. While the cyclical tendencies marked on the chart with red vertical lines are often very precise in timing the turning points, it is not the way they are to be used. Instead, they are to be used on a "close to" basis, meaning that once we get close to the turning point we monitor other tools for confirmation that a move in a given direction is to take place. Consequently, we don't necessarily need to wait for the beginning of April to see silver move lower.
Summing up, one needs to be very careful if one wants to go long this market as it looks like it is ready to put in a short-term top. This could be followed by relatively large move lower. There is some evidence that it could go a little higher before declining as it is highly correlated with the stock market and silver could ride the current positive momentum in the general market. This correlation can be partially explained on the fact that silver is an industrial metal that has an abundance of business applications. Essentially, as business picks up so does silver.
Still, based on today's (Friday) action, it seems that the decline might have already started. Once we are sure that the bottom has been formed, we will be able to provide you with details regarding the next long-term target by updating the ones made in the November 13th (yes, it was Friday) 2009 Premium Update.
Precious Metals Stocks
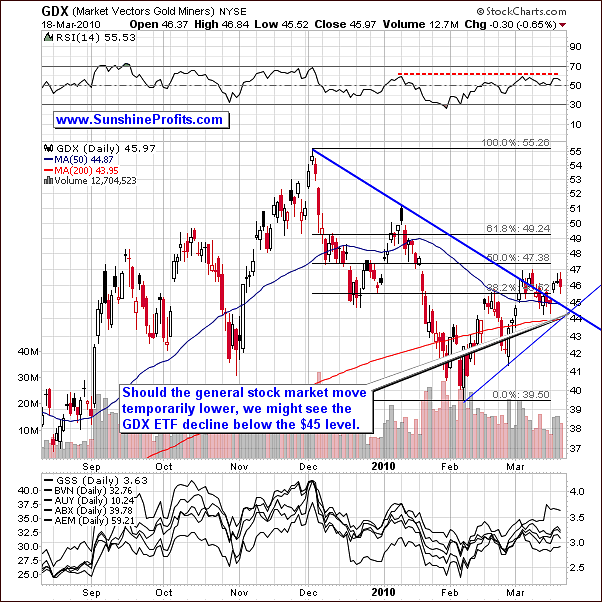
Even though we had 3 consecutive closes in the GDX ETF (proxy for the PM stocks) above the down sloping trend line one should be very careful about taking a bullish stance, because of the situation in the general stock market, which is highly correlated to the PM stocks. Additionally, please note that compared to the SPY ETF, PM stocks barely moved higher, which is not a sign of strength in this market.
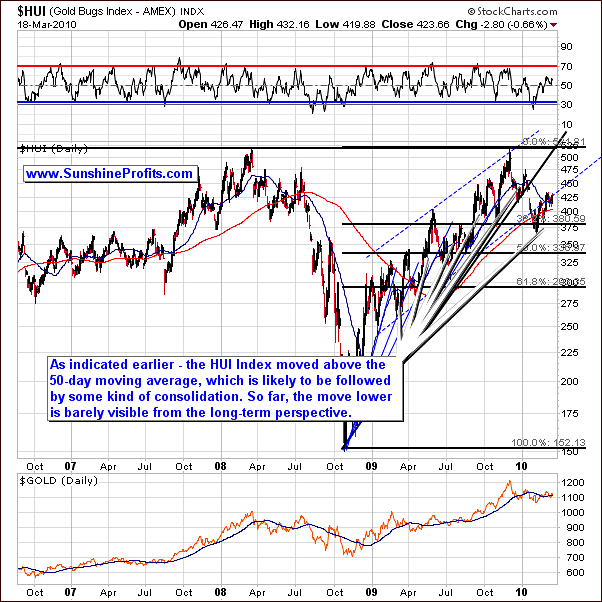
We still don't see a visible move below the 50-day moving average on the long-term chart of the HUI Index, which was the case during previous consolidations, so PM stocks may need to move lower before they are ready to form another sizable rally.
If the stock market starts to reverse and goes to the downside then based on past correlation precious metal stocks should decline as well. If this does indeed occur we will want to closely monitor volume levels because below the $45 level on the GDX could be an attractive place to start getting long precious metals stocks again. Please note that a single close below the 45 level would not invalidate the bullish medium-term implications for the chart, especially if it holds at the $44 level - at the 200-day moving average.
In the previous Premium Update we wrote the following:
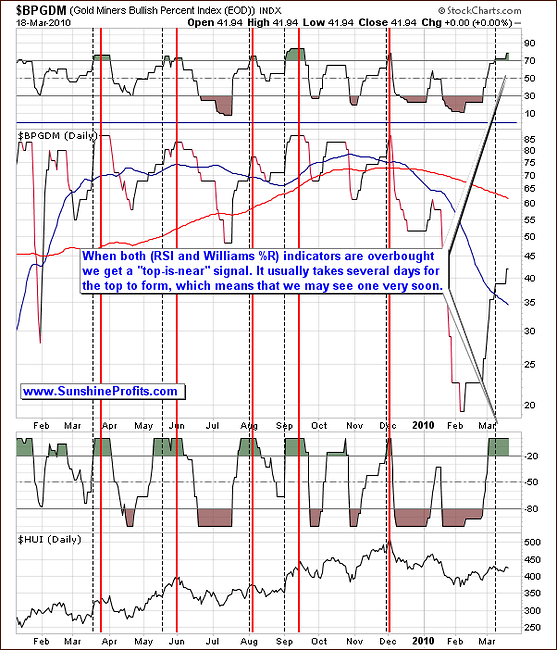
The high-probability sell signal is given if this index moves higher, and both indicators (RSI and William's %R) used on the above chart become, and then stay overvalued for some time. The initial overbought signal is marked with the vertical dashed black lines, and the top signal is marked with red lines. The overbought signal was given several days ago, so the probability that the top is already in, is relatively high.
As mentioned above, prices declined soon after that. Since Dec 4th 2009, we have not seen the abovementioned signal, but it seems that we are about to see it very soon. The Williams %R indicator is already in the overbought territory, and the RSI Indicator is slightly below the 70 level. Naturally, it didn't go above this level yet, but the situation is risky enough to consider closing out the speculative (!) long positions in the PM sector.
The big news this week is that we have just seen the RSI move above the 70 level, and the Williams %R indicator above the 80 level - which according to the abovementioned methodology - is a "top-is-near" signal. Therefore, it is a move lower from here that one can expect as far as the PM stocks are concerned, not further gains.
This week, we still have both: the Williams %R and RSI indicators signaling overbought conditions for the index, which means that a local top is likely to be formed very soon - or we that have just seen one.
Summing up, the fate of the precious metal stocks is tied to what happens in other markets particularly the overall stock market. From a technical viewpoint it seems there is a short-term top forming confirmed by the overbought conditions in Williams %R and the RSI in the Gold Miners Bullish Percent Index. When the short-term decline is finally confirmed by GDX going below the 45 level on low volume and then rising again on high volume, we might see another speculative buying opportunity in the metals.
The last chart that we would like to feature this week is the platinum chart.
Platinum
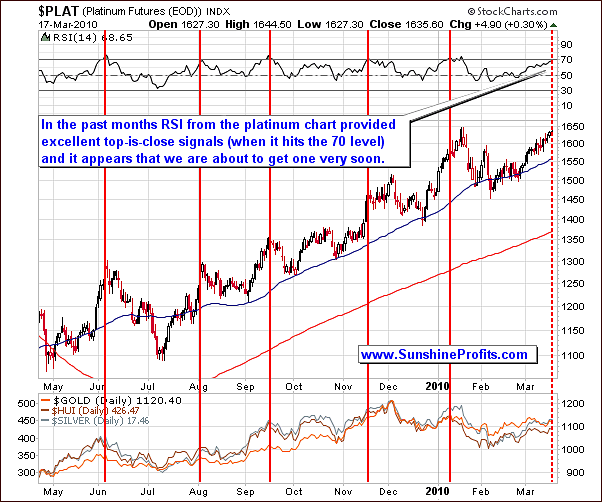
As I mentioned in the October 9th Premium Update, we see that the platinum market has been topping along with signals from the RSI indicator, and the reliability of this particular tool has been remarkable (...) Moreover, the subsequent decline in platinum corresponded to a similar action also in the other parts of the precious metals market - please take a look at the lower part of the above chart for details.
The RSI hovering around the 70-level indicates that a short-term top is certainly near and when taken into account that this indicator has been reliably signaling tops in the Platinum market, it provides us with a high degree of confidence that we are indeed near a top in the whole PM market.
Summing up, by now you are seeing a common technical theme for the metals market. It applies here to Platinum as well. Look for consolidation and retracement to take place before a bottom can be confirmed and we start rallying back to the upside. Platinum is very close to putting in a short-term top, which suggests that the same action is to be expected in other metals markets as well.
Summary
The biggest story this week was that the general stock market managed to move above the January 2010 high. Not all of the proxies for the general stock market confirm this breakout so far (DIA ETF), but it appears that they soon will. This means that the main stock indices may be ready to move higher once this breakout is verified.
The USD Index moved below its rising trend channel and the move lower has been confirmed. Still it may move temporarily higher to verify its previous high. Should this take place along with a rise in gold price, it would provide us with another bullish signal, because (as mentioned last week) one of the things that would indicate that the PM market is ready to move higher would be the return of the negative correlation between USD Index and gold.
Consequently, the precious metals market appears to be ready to move lower (along with the general stock market) relatively soon, and based on today's (Friday) action it seems that the second part of the correction has just started.
This completes this week's Premium Update.
Thank you for using the Premium Service. Have a great weekend and profitable week!
Sincerely,
Przemyslaw Radomski

