
If you saw the Hollywood thriller "Speed" several years ago with Keanu Reeves and Sandra Bullock, you might recall that they were trapped on a bus rigged to blow up if the speed of the bus dipped below a specific level. That, according to one economist, is China's situation. If and when the economy slows down below a certain level, China's economic boom will go bust, like a huge bubble pricked by a pin.
We recently read an interesting white paper on the subject, titled "Watch Out for China's 10 Big Red Flags," by Edward Chancellor, an analyst with GMO, a privately-held global investment management firm.
Chancellor outlined the 10 "red flags" that indicate the formation of a bubble and how China's economy shows many of the classic symptoms of a great speculative mania.
China's economic outlook is of vital interest to gold investors. Chinese demand for gold is set to double within just ten years according to the latest World Gold Council's 74-page report, Gold in the Year of the Tiger. Chinese gold consumption was worth more than $14 billion in 2009, equivalent to 11% of global gold demand. Over the past five years, Chinese demand for gold has increased at an average rate of 13% per annum. The report estimates that China could exhaust its known gold mining reserves six years from now.
So, will the Chinese miracle continue, or will the boom turn to bust?
Here are the 10 "red flags" that, according to Chancellor, indicate the formation of a bubble and how each applies to China.
1. Great investment debacles generally start out with a compelling growth story, perhaps a new revolutionary technology such as railways in the 19th century, radio in the 1920s, or more recently, the internet.
Chancellor points out that it is generally assumed that the Chinese Dream will continue to grow at around 8% annually in the coming years. In recent months China has overtaken Germany as the world's number one exporter, and Japan as the world's number two economy. It has recently surpassed the U.S. as the largest national car market. The inevitability of China's ascent to global economic primacy is reflected in the title of a recently published book by Martin Jacques, "When China Rules the World: The Rise of the Middle Kingdom and the End of the Western World."
2. A blind faith in the competence of the authorities is another typical feature of a classic mania. In the 1920s, for example, investors believed the recently established Federal Reserve would bring an end to boom and bust.
According to Chancellor, both economic theory and history argue against central planning as the optimal mode of economic development. China's rapid growth can be deceptive because the state can invest resources more quickly than can the private sector. However, the quality of investment is lower. In other words, you can't always trust the numbers that a government is putting out.
3. A general increase in investment is another leading indicator of financial distress. Capital is generally misspent during periods of euphoria.
In a market oriented economy, investment levels might be expected to fall during a period of uncertainty. Yet in 2009, China's fixed asset investment climbed by 30 % and contributed 90% of last year's growth. How well was this money spent?
According to Chancellor, infrastructure accounted for more than two-thirds of last year's stimulus spending, with roughly a quarter of it government-directed. China's investment share of GDP is higher than any other Asian economy in history. Unlike the developed world, China has much greater control over its economy. It can force banks to lend, or can force state-owned enterprises to borrow and spend. It can build highways, skyscrapers and bridges more quickly with less paperwork. A recent IMF World Economic Outlook observes that countries with a high investment share of GDP tend to suffer the steepest and most prolonged economic downturns.
4. Great booms are invariably accompanied by a surge in corruption.
All great speculative manias have been accompanied by rising levels of fraud. Only in the time of bust do the Enron's and Madoff's come to light. China has recently slipped to 79th place in Transparency International's 2009 Corruption Perceptions Index, just below Burkina Faso.
The New York Times estimates that up to half of sales of luxury goods in China are purchased to be given as bribes.
5. Strong growth in the money supply is another leading indicator of financial fragility. Easy money lies behind all great episodes of speculation starting with the Dutch Tulip Mania of the 1630s.
Low interest rates are part of Beijing's policy to promote investment. Low interest rates also drive Chinese households into speculating in stocks and real estate. Last year the money supply grew by nearly 20% while interest rates were maintained well below the economy's nominal growth rate.
6. Fixed currency regimes often produce inappropriately low interest rates, which are liable to feed booms and end in busts.
The Chinese currency, the renminbi, is pegged to the U.S. dollar and an undervalued exchange rate has boosted exports and kept interest rates low, as we wrote in March 19th Premium Update (link). Many economists estimate China's currency is undervalued by 25 to 40 percent. China's huge foreign exchange reserves reflect a profound imbalance. One commentator has pointed out that the only two countries which had previously accumulated such large foreign exchange reserves relative to global GDP, were the U.S. in 1929, and Japan in 1989.
7. Crises generally follow a period of rampant credit growth. In the boom, liabilities are contracted that cannot later be repaid.
In response to the global financial crisis, Beijing ordered its banks to lend. Last year new bank lending increased by nearly RMB 10 trillion, a sum equivalent to 29% of GDP. It was as if the economy had received an enormous adrenaline shot. Hangover is what generally follows a credit binge, says Chancellor.
8. Moral hazard is another common feature of great speculative manias. Greed isn't necessarily good and we tend to act irresponsibly during intense periods of speculation.
The major Chinese banks are controlled by the state and are seen as too big to fail. Some argue that Chinese banks have been modernized and now apply modern risk management methods. If they were really maximizing profits why do they still engage in massive policy lending at Beijing's behest, asks Chancellor.
9. A rising stock of debt is not the only cause for concern. Investments financed with borrowed money don't generate enough income to either service or repay the loan
Loans have been used in China to finance infrastructure projects sponsored by local governments. Few seem to care about the practice of concealing nonperforming loans since it's generally assumed that so long as the economy continues growing quickly, bad credit will turn good over time.
10. Dodgy loans are generally secured against collateral, most commonly real estate. Thus, a combination of strong credit growth and rapidly rising property prices are a reliable leading indicator of very painful busts.
High stock turnover, a rising number of new share issues, strong early trading gains and the establishment of new stock exchanges are all classic signs of speculative euphoria. Meanwhile, the real action has been taking place in China's overheating property market. Over the course of the last decade, national home prices rose at annual rate of 8%. Commercial real estate investment grew by 121 % last year. The total amount of floor space under construction in China is equivalent to the size of Rhode Island. The real estate market displays the classic symptoms of a bubble-stretched valuations, rampant speculation, and frenzied new construction. Sooner or later this bubble will burst, says Chancellor.
China's real estate market, and indeed its economy and financial system, have been shaped by a belief that past rates of economic growth will continue. This assumption justifies more investment, which spurs the growth, leading to more investment. According to Chancellor, China's current situation is reminiscent of the late stages of the dotcom bubble, when investors extrapolated past growth rates into the future. China has become a field of dreams: a "build and they will come" economy, to quote yet another Hollywood movie (Field of Dreams, 1989, starring Kevin Costner.) In 2005 they built the South China Mall, the second largest shopping mall in the world with 1,500 store capacity. It has been 99 % vacant since its opening.
If China falters it will likely tank the commodity markets, commodity producers and commodity exporting nations. Chinese appetite for the dollar will diminish driving the dollar lower against the renminbi and boosting American interest rates higher.
What usually happens in times of economic turbulence and fear and when fiat currencies tank? Investors flock to gold.
Moving on to the technical part of this week's update let's begin with the USD Index (charts courtesy of http://stockcharts.com), which is once again the main driver of PM prices (we will write more about that particular topic in the following part of this update).
USD Index
In the previous Premium Update we wrote the following:
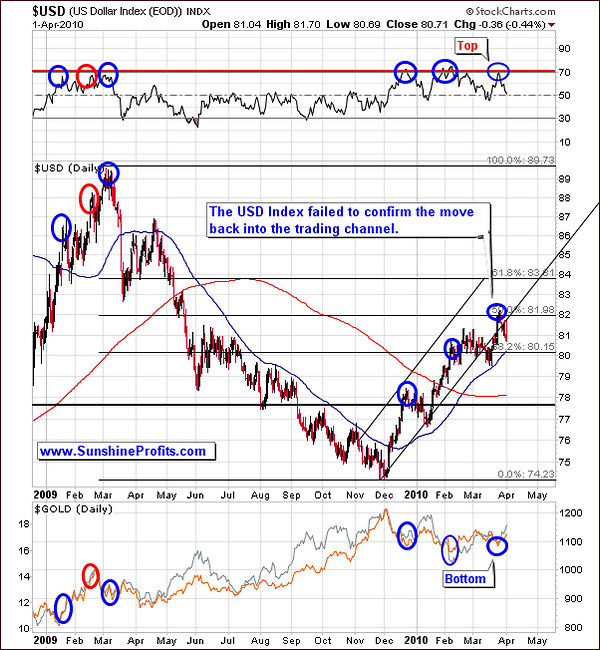
This week the USD index pierced the lower border of the previous trading channel and once again moved inside of it. However, there is still a lot of evidence that this rally is not going to last because the latest upswing is knocking up against resistance at the Fibonacci 50 percent retracement level of the previous (2009 Mar - Dec) decline. Key Fibonacci levels have historically been reliable in identifying key support and resistance, especially on the U.S. Dollar market.
Consequently, the U.S. Dollar moved considerably lower - visibly below the trading channel. This non-confirmation of a breakout is a bearish sign for the USD Index, and a bullish one for the PMs. Please note that once again the RSI at 70 meant a local top in the U.S. Dollar and a local bottom in gold and silver.
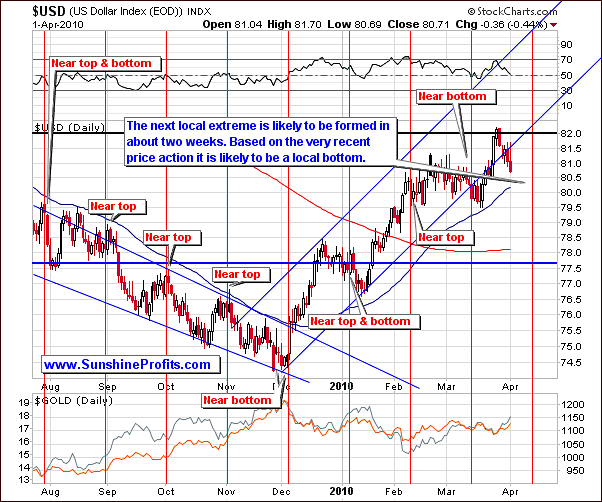
Moving on to the short-term chart you can see how it is approaching its next cyclical turning point, which is likely to be a local bottom. It seems that it will be formed in the middle of April.
Summing up, the USD Index has failed to confirm the move above the previous trading channel, and it is now trading below it, which is a clearly bearish sign. The move lower that we've mentioned in the past updates is even more probable than a week before. This is positive news for PMs in both short and medium term.
General Stock Market
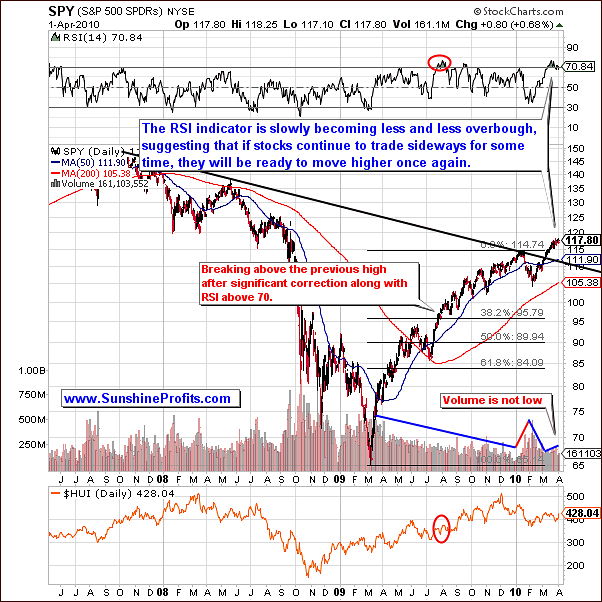
The landscape has not changed that much this week as far as the general stock market is concerned - even though the RSI indicator is starting to decline a bit suggesting congestion and a sideways market. However, as long as the January high is not violated the slow up trending nature in this market is still in place. As indicated on the above chart with the RSI getting out of overbought territory and the relative solid volume this market still has some legs to the upside. Let's take a look at the short-term chart for more details regarding timing.
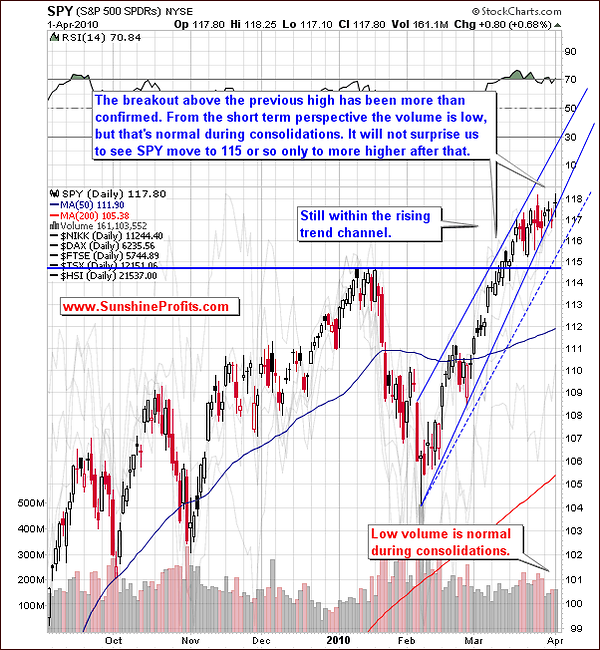
Moving on to the shorter-term chart you can see volume has declined a little but keep in mind this is typically what happens during a consolidation period. Having said that look at that rising trend channel demonstrating we have more upside in the Spiders (SPY), which of course is a proxy for the general stock market. Even if the value of the ETF goes below the rising solid blue line, it will still remain in an uptrend channel created by the dashed line - parallel to the upper border of the channel.
Summing up, it seems that the general stock market is to trade sideways for some time after which it will make another decisive move. Based on the above charts and points made in previous updates, it seems that the next move will be up. Lots of money still on the sidelines, which will start to come back in and will accelerate market appreciation. If the general stock market does indeed rally from here, than it may cause us to verify our views on the junior sector. Namely, juniors will once again become an attractive buy.
Correlations
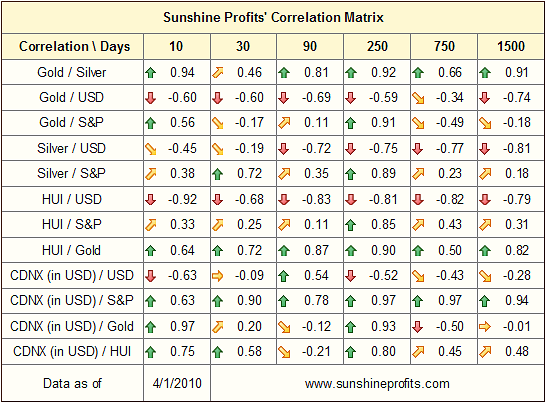
The correlations of the U.S dollar is starting to become more and more aligned with the metals sector, which is something we were looking to see develop. Please take a look at the 30-day column at the values of correlation coefficients for USD and gold / gold stocks - they are significantly negative for the first time in the last several weeks. Moreover, at the same time, the correlation between gold / gold stocks and S&P 500 is much lower. This means that gold and corresponding equities are once again mostly USD-driven in the short run.
Silver is still highly correlated with the general stock market, but it doesn't invalidate points made above, as silver tends to move closely with stocks because it has multiple industrial uses.
Summing up, the correlation matrix shows further evidence of the return of the highly negative correlation between USD and PMs. Additionally, the link between gold, mining stocks and the general stock market is much weaker than it was the case during the past several weeks. As mentioned earlier, this is positive news for PMs, because the return of this correlation is what we expected to see before the next big move up.
Gold
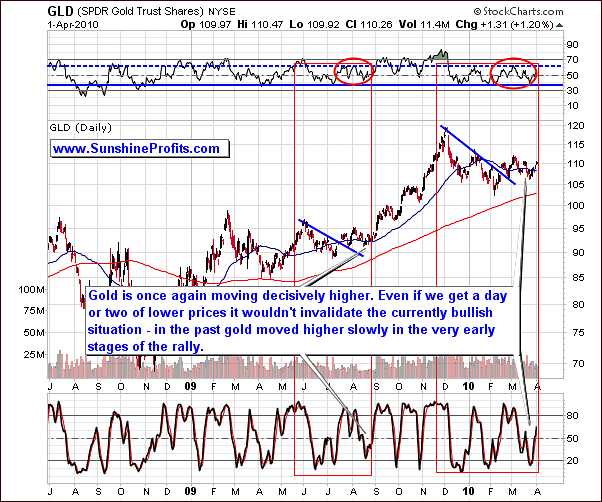
Last week we've summarized that the bullish analysis in gold is definitely still intact given the strikingly similar pattern in place back in August of 2009 where we had some consolidation followed by a significant rally.
Our previous long-term pattern analysis is still very intact and remains bullish. Even if we are going to see gold move a little lower from here, it will not change the bullish implications of the pattern. Let's take a look at the short-term chart for more details.
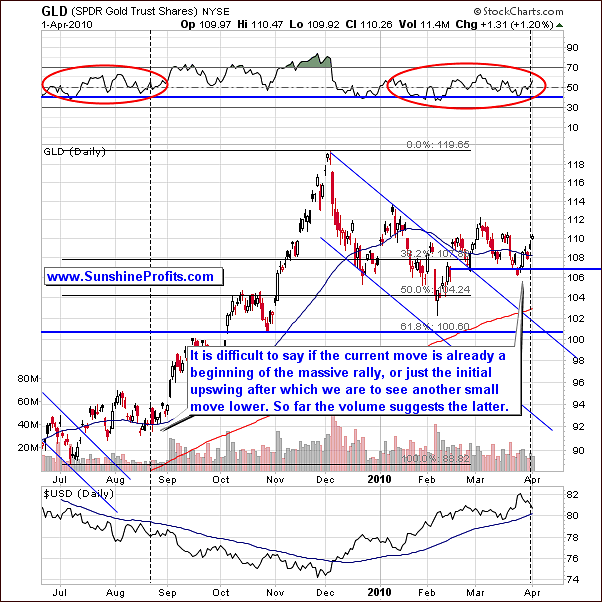
Looking at the short-term chart do not anticipate an immediate move. Sure, it may be the case that gold rallies right away (that's why we had mentioned opening long positions in metals), but based on the similarity to the late August 2009, it seems that we may see gold moving slowly higher instead of rallying immediately. This means that if we see a small correction that takes gold $20 lower or so, it should not make you worried. We will let you know if we believe that higher prices are not to be expected in the short- and medium-term.
Summing up, the situation in gold is still bullish - the technical analysis patterns are in place, and the strong negative correlation with the U.S. Dollar serves as a confirmation.
Silver
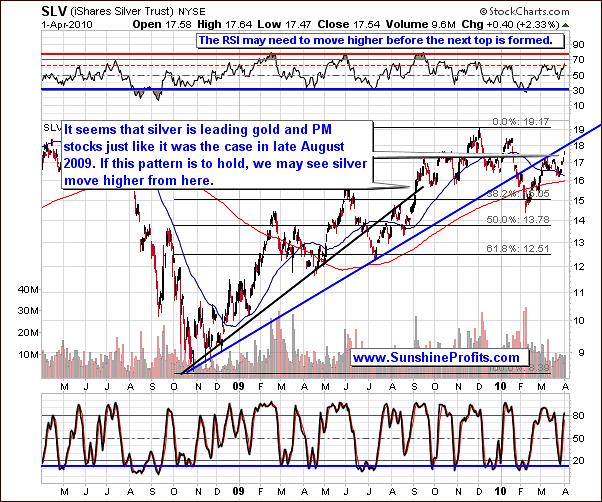
As it was the pattern in August 2009, silver is leading Gold and PM stocks to the upside. The RSI is in the overbought area and suggests some temporary resistance, but this will more than likely not hold as higher ground will be reached soon. Please note that silver topped in September along with RSI much above the 70 level, and this is what we expect to see also this time. Additionally, please see how the 50-day moving average proved to be strong suport during both August 2009 and March 2010.
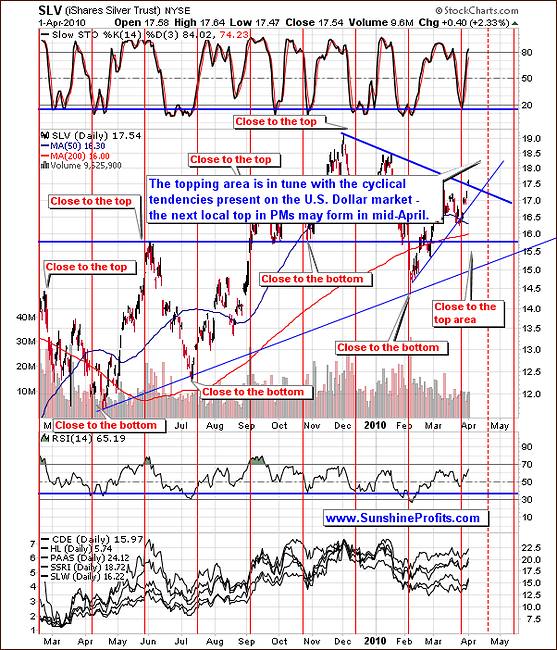
Moving on to the shorter-term chart and looking at the cyclical tendencies we see that we are currently in the "close to the top" area. This means that the top is likely to be formed before the third week of April or so, which might be in tune with the cyclical tendencies present in the USD Index. Please recall that we've mentioned that the U.S. Dollar might form a local bottom in mid-April, which could easily translate into a local top in gold and silver.
On an immediate-term basis, it would not surprise us to see a few days of trading sideways, before silver resumes the rally, as it has just moved above the medium-term declining resistance line.
Summing up, the silver market may consolidate for a few days, but it seems that the coming weeks will provide us with higher prices.
Precious Metals Stocks
In the previous update we wrote the following:
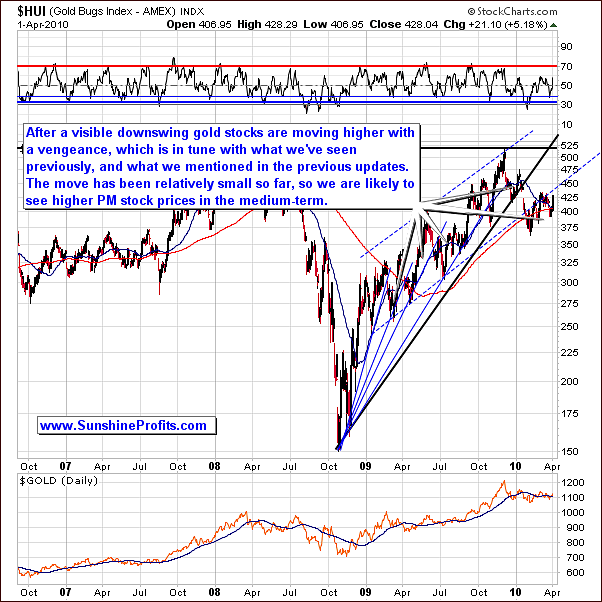
For the most part this week PM stocks moved significantly lower. This can be disconcerting to investors. However, looking at the long-term chart the bullish scenario is still alive and well. For example, the HUI Index has moved above the 50-day moving average this week. Based on the analogy to the previous bottoms this is a bullish signal. Moreover, the RSI indicator on the HUI chart has now touched the thin blue line, which used to mark bottoms during consolidations.
Consequently, we've seen precious metal stocks are rallying and the bottom appears to be in. In relative terms PM stocks have not moved as much as gold or silver, which puts the probabilities for even a stronger rally to come. We might have seen the beginning of this phenomenon yesterday, but this is not very probable based on the volume level.
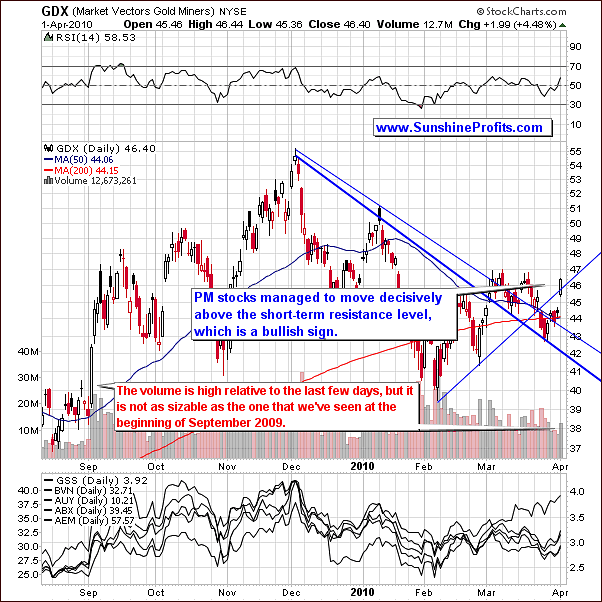
As you may see on the chart above, the volume was relatively high yesterday, but it was not very high - as it was the case in early September 2009. Consequently, yesterday's move is similar to the initial rally at the end of August, which was followed by a mini-consolidation before the real move materialized. This is also what we may see here.
Summing up, the situation remains bullish for the PM stocks. If we move lower on a very low volume it will serve us as a confirmation that the rally is coming. This would be a good time to add to one's long positions in metals and PM stocks - we will send out a Market Alert should that be the case. Meanwhile, let's take a look at the signals that other charts provide us this week.
Other Charts
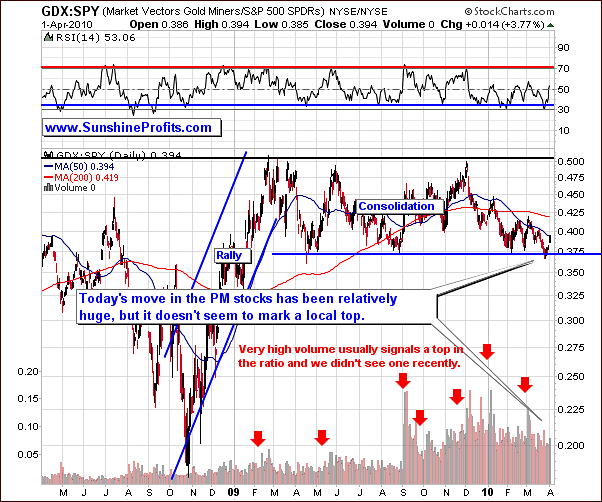
About a month ago we commented on the above chart by stating that in the following days/weeks the value of the GDX:SPY ratio declined significantly along with prices of gold, silver and precious metals stocks. The high volume in this ratio has also accompanied the local top in early January, and this is also what we have seen right now. Therefore, keeping a speculative (!) long position in the PM sector at this point does not seem to be a profitable decision.
Consequently, we have seen a local top in the PM stocks. The question here is if PM stocks are likely to be topping out right now, because yesterday's move took stocks much higher. Looking at the above chart and given the recent rally we still haven't reached heavy resistance. In addition, this latest move up is not confirmed by strong volume. There is still the distinct possibility of retracing and filling the price gap (which could easily translate to the above mentioned small consolidation) but either way the precious metals market appears to be moving higher over the next few weeks.
Additional confirmation of the above mentioned points regarding timing comes from the analysis of the Gold Miners Bullish Percent Index - a market breadth/momentum indicator that is calculated by dividing two numbers: the amount of gold stocks on the buy signal (according to the point and figure chart, which emphasizes strong moves while ignoring small ones) and the amount of all gold stocks in the sector.
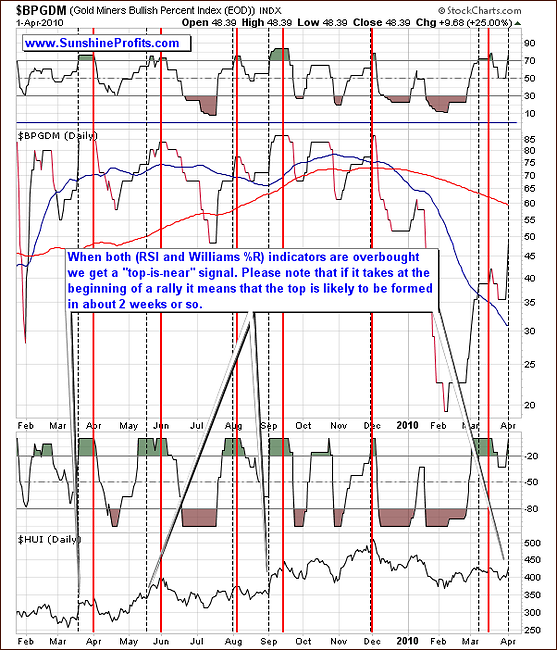
On Dec 4th 2009 we wrote the following:
The high-probability sell signal is given if this index moves higher, and both indicators (RSI and William's %R) used on the above chart become, and then stay overvalued for some time. The initial overbought signal is marked with the vertical dashed black lines, and the top signal is marked with red lines. The overbought signal was given several days ago, so the probability that the top is already in, is relatively high.
Still, taking a more detailed approach, we see that if we get this signal at the beginning of a rally, the top is likely to be formed in about two weeks. That was the case about a year ago, in May/June 2009, and in September 2009.
Summing up, it seems that we are next local top in the precious metals sector is going to take place in about two weeks.
Juniors
As stated in the Key Principles section, the list of top juniors will be updated approximately every 4 weeks, so this is the Update that should contain the revised version of the list. The tables below feature our favorite junior stocks at the moment of writing these words. For more information on how you can use these lists please refer to the Key Principles section, especially to the part dedicated to juniors.
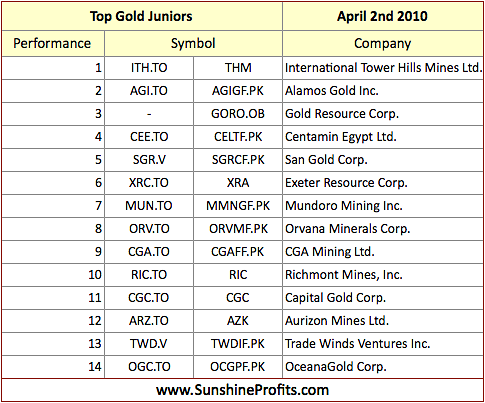
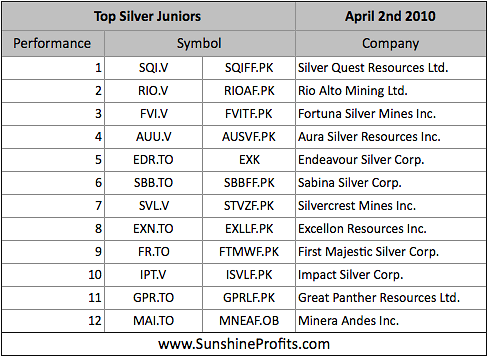
Once again, there are virtually no changes since the last month, meaning that the stocks that were strong (on a comparative basis) last month are still holding relatively well. Still, at this point we are not sure if the junior sector is the place to be because the situation on the general stock market is not clear enough.
As mentioned earlier, it does not point to lower PM prices, but it does not indicate higher ones either, and since junior's outperformance relative to senior mining stocks depends to a great extent on the performance of the general stock market, we would like to get more evidence that the latter is to move higher from here.
Additional Comments
As mentioned in the latest message that you've received from us , this update will also include our comments on the recent CFTC meeting and the implications that it may have on your portfolio. If you are not familiar with the story described in the interview that we mentioned yesterday, and/or you would like to get detailed information, you will find it Ted Butler's archives, and GATA website. The point of the comments below is not to describe the whole process or logic behind arguments of each side (is the PM market manipulated or not), but rather to focus on it might affect you, and what action can you take right away.
In a nutshell, there are very serious allegations and pieces of evidence that gold and silver markets are manipulated (prices are being held at artificially low levels), by large financial institutions which allows them to reap massive profits. Since all manipulations end sooner or later, prices of gold and especially silver are to eventually move dramatically higher. The big news is that this story got much more attention recently because of the recent CFTC meeting in Washington DC regarding the manipulation of the silver market, and the following comments from many analysts including the interview that we mentioned yesterday.
The less bullish side of the coin here is that these allegations (along with suggestions that silver price is to explode very soon) have been made for more than 10 years (please read Ted Butler's early commentaries on the above mentioned website for details), and we still see PMs moving up higher in a steady manner instead of a gigantic upswing. Please note that we don't want to sound disrespectful toward our colleagues here (especially Mr. Butler) - but you have subscribed to get to know our analysis, so this is what we do - we analyze everything that can affect your precious metals portfolio.
While we're at it, we would like to once again comment on the analysis of the Commitment of Traders reports - as mentioned several months ago, the above mentioned points (numbers from CoT reports reflect them) are positive fundamental factor (meaning that PMs are more likely to move higher in the long run), not necessarily a valid technical one (not really useful for timing purposes). It used to be reliable in timing local tops/bottoms in the past, it has not been the case since 2006 or so.
So - what does the above situation mean to your portfolio? Well, if you've been following points made in the Key Principles section regarding the portfolio allocation and you have made purchases of physical gold and silver bullion, then it does not affect your portfolio in a big way. The point is that we believe that silver and gold are long-term buys regardless of whether these markets are manipulated or not. The possibility of manipulation doesn't mean that short-term speculation is not profitable, as it is a good way to make money along the way just in case we don't get a dramatic spike in the value of metals in the next several years.
On the other hand, should metals indeed move much higher soon, it is good to have at least a portion of your capital in the form of gold and silver so that you are sure you won't miss the boat. The only thing that changes (as far as implications for one's portfolio are concerned) is the amount of metal that one should hold relative to the speculative/stocks part of one's holdings. Since the manipulation issue has gathered a lot of attention recently, it makes it more likely that PMs would spike sooner. Therefore, you might want to increase your bullion holdings. We have increased the percentage dedicated to the bullion holdings from 20% to 30% and the Portfolio Structure and Physical Bullion sections reflect that.
Another thing that the market manipulation suggests is that since the price is not entirely free, there is no point in using the technical analysis, which is primarily based on the analysis of past prices and levels of volume. We don't agree with this point, and we hope that you will find that the accuracy of our calls during the past years provides enough evidence against that theory. We have commented on that issue in the Editor Answer's section, but there's one more thing that you might want to consider - interest rates are not allowed to float freely - they are fixed on a given level. This means that the money markets throughout the world are managed and since ultimately the value of each stock/commodity is priced in one of the "managed" (which is another word for "manipulated") paper currencies, then there are virtually no free markets.
Moreover, this is not a new development, it's been around for a long time, and since technical analysis' tools developed in this environment, they take that fact into account. Consequently, the technical analysis is not likely to stop working just because a market is not completely free. On the other hand, applying it to market that is totally fixed makes no sense either. The point here is that we believe that gold and PM stocks are definitely "free enough" to provide accurate technical signals for PM Investors and Speculators. The signals coming from the analysis of the silver market are less reliable, but that doesn't make them totally useless either. Silver can be (and is) analyzed successfully on a short term basis, especially if one analyzes it along with other markets and looks for confirmation signals.
Summary
Bottom line we are still in an overall bullish environment as far as the precious metals market is concerned. The USD Index, which appears to once again be the key driver behind the PM prices appears to be moving lower, which is likely to cause PMs to rally. This may not happen during the next few trading days, but it seems that PMs will move higher over the next two weeks.
Naturally, this is just a speculation on our part, but if you'd like us to put a number on the chance that a move to the previous high in gold will materialize during the next several weeks, we would give it about 60%. We will send out a Market Alert if we see signs that the odds have increased, which would mean that it makes sense to add to one's speculative long position. Naturally, we will send out a Market Alert also if points made in this update (regarding the PM market) are no longer up-to-date.
As far as the long-term part of your portfolio is concerned, based on the recent news it seems that it might be a good idea to increase the amount of the physical gold and/or silver that you own. We do not recommend waiting for lower prices to make this move. Timing the market is speculation, and this is a decision regarding the investment (not speculation) part of your capital.
This completes this week's Premium Update.
Thank you for using the Premium Service. Have a great weekend and profitable week!
Sincerely,
Przemyslaw Radomski

