
Europe was in the news again this week with Greece's financial crisis flaring as doubts about a rescue plan rattled the euro and sent the country's bonds tumbling to their lowest levels since the problems began. In Britain, long-anticipated national election have been set, kicking off an intense 30-day battle between two major parties with sharply different plans to fix the U.K's battered economy and huge deficit.
But an interesting piece of news that stayed under the radar of international news media this week is that Israel's stock market has become the best performing stock market in the world. Crisis be damned, the benchmark TA-25 index of blue-chip stocks reached record heights this week when it broke through the 1,237 level last attained in November 2007, before the financial global meltdown. In dollar terms the Tel Aviv stock market is 7% higher now than it was before the crisis. Brazil's stock market, on the other hand, is still 9% below its all time high. The Dow Jones Industrial Average is 19% below, Germany is 25% below and Britain is 34% below the all time high, according to Israel's financial daily, The Marker.
As we will mention in the technical part of this week's commentary, the main stock indices throughout the world tend to move in the same direction, so long-term positive news regarding one of these indices is positive also for other ones.
Israeli analysts point out that Israeli banks were not affected by the sub-prime problems and the government did not have to bail out its banks or set off an explosion in short-term spending. Instead, it used the crisis to solidify the economy's long-term future by investing in research, development and infrastructure. Even the risk-averse Warren Buffet bought an Israeli company three years ago, his largest purchase outside the U.S.
Already in January of this year New York Times columnist David Brooks commented on the economic miracle of a small, young, constantly embattled country with no natural resources that has emerged as a model of entrepreneurship.
He pointed out that Israel has the highest density of tech start-ups in the world by far. More importantly, these start-ups attract more venture capital dollars per person than any country - 2.5 times the U.S., 30 times Europe, 80 times India, and 300 times China. Israel with only seven million people attracts as much venture capital as France and Germany combined. Israel has more companies on the tech-oriented NASDAQ than any country outside the U.S., more than all of Europe, Japan, Korea, India, and China combined. But it's not just about start-ups. Scratch the surface of almost any major tech company in the U.S. - Intel, Microsoft, Google, Cisco, Motorola, - and you will find Israeli talent and technology playing a major role in keeping these multinationals on the cutting edge.
Israel outdistances its neighbors when it comes to technological innovation. Brooks points out that some oil-rich states without a tradition of free intellectual exchange spend billions trying to build science centers. But places like Silicon Valley and Tel Aviv are not created by money, he says, but rather by a confluence of cultural forces. For example, between 1980 and 2000, Egypt with a population of 72 million registered 77 patents in the U.S. Israel with only a tenth of Egypt's population registered 7,652.
A new book by Dan Senor and Saul Singer, Start-Up Nation: The Story of Israel's Economic Miracle, explores the culture behind Israel's economic success. Adversity of all kinds have forced Israelis to be resourceful, to do more with less, to innovate, and to be global from day one, say the authors. In a New York Times interview Senor, an adjunct senior fellow at the Council on Foreign Relations, explained that part of the success is a typical Israeli attitude of "chutzpah," defined as brazen nerve or incredible guts.
Israelis are educated to challenge the obvious, ask questions, debate everything and innovate. The book cites as an example a trip to Israel of PayPal president Scott Thompson who had just bought an Israeli start-up called FraudSciences. In Israel Thompson met with the Israeli staff and here is what he had to say about the meeting:
"Every question was penetrating. I actually started to get nervous up there. I'd never before heard so many unconventional observations - one after the other. Junior employees had no inhibition about challenging how we had been doing things for years. I'd never seen this kind of completely unvarnished, unintimidated, and undistracted attitude."
Another important component of Israel's success is compulsory army service where certain units become technology boot camps. The three year service also produces a maturity in young Israelis not seen in their peers from other developed countries who spend that time in universities. There is a bias in the Israeli army against specialization resulting in a multi-tasking mentality. Lower ranking officers in the Israeli military have greater command decision latitude than their counterparts in any army in the world.
"The Israelis come out of the military not just with hands-on exposure to next-generation technology, but with training in teamwork, mission orientation, leadership, and a desire to continue serving their country by contributing to its tech sector," says Senor.
In addition, Israel's resource-stretched military teaches improvisation and flattens hierarchies. Soldiers are taught to get the job done and figure out how. And especially in the reserves, barriers are broken; young people command their teachers or bosses, no one salutes and privates can address generals by their first name.
"All this contributes to an informal and anti-hierarchical culture outside the military, which is critical for an experiment-focused, probing, and innovating economy," says Senor.
It is no coincidence that the military-particularly the elite units-have served as incubators for thousands of Israeli high tech start-ups. Israel has its own indigenous military industrial complex, unheard of for a country of its size. As a result, in 1988 Israel joined the club of only about a dozen nations that had launched satellites into space.
Many young Israelis take a post-army trip for about a year to exotic destinations such as South America or Asia, learning to engage with cultures very different than their own. They then go back for their university education-45% of Israelis are university educated, among the highest percentages in the world. Israel ranks number one in the world outside the U.S. in the number of publications per capita in top academic journals.
A third component of Israel's success, according to the book, is its welcoming attitude towards immigrants.
Israel is a country of immigrants - there are over 70 nationalities represented in this tiny country. Two out of every three Israelis are newcomers, or the children or grandchildren of newcomers.
The authors note that immigrants are natural risk takers since they were willing to uproot themselves and start over. In particular, the great wave of immigrants from the former Soviet Union in 1990 to 2000 brought to Israel a tremendous boost in engineering talent just as the tech sector began to take off. Israel is the most pro-immigration country in the world. The job of encouraging and integrating immigrants is a cabinet position with a dedicated ministry behind it.
The writers of the book conclude that all the reasons mentioned above don't quite explain the Israeli technological miracle. They note that Singapore has a strong educational system. They note that Korea has military conscription and has also been facing security threats for its entire existence. Finland, Sweden, Denmark and Ireland, are also relatively small countries with advanced technology and excellent infrastructure that have produced lots of patents. But none had produced anywhere near the number of start-ups or have attracted similarly high levels of venture capital investments as has Israel.
If the U.S. wants to keep its dominant economic position in the world, it would do well to learn the lessons of the Israeli high tech miracle. Thomas L. Friedman, another New York Times columnist, has already highlighted this point in a recent column, titled America's Real Dream Team. He noted that the majority of the 40 finalists in the 2010 Intel Science Talent Search, which honors top math and science high school students in America, hailed from immigrant families, largely from Asia.
"I am a pro-immigration fanatic," he writes. "I think keeping a constant flow of legal immigrants into our country - whether they wear blue collars or lab coats - is the key to keeping us ahead of China. Because when you mix all of these energetic, high-aspiring people with a democratic system and free markets, magic happens."
So, not everything is bad about the world stock markets, but as we have mentioned in the past - the fundamentals are one thing and short-term timing is something quite different.
Moving on to the technical part of this week's update let's begin with the U.S. Dollar (charts courtesy of http://stockcharts.com.)
USD Index
In our previous report we wrote the following:
Consequently, the U.S. Dollar moved considerably lower - visibly below the trading channel. This non-confirmation of a breakout is a bearish sign for the USD Index, and a bullish one for the PMs. Please note that once again the RSI at 70 meant a local top in the U.S. Dollar and a local bottom in gold and silver.
The bearish implications of the breakdown are still in place as far as medium term is concerned, but given the strength on the USD market in the past few days, we can assume that the next top is still a few days away.
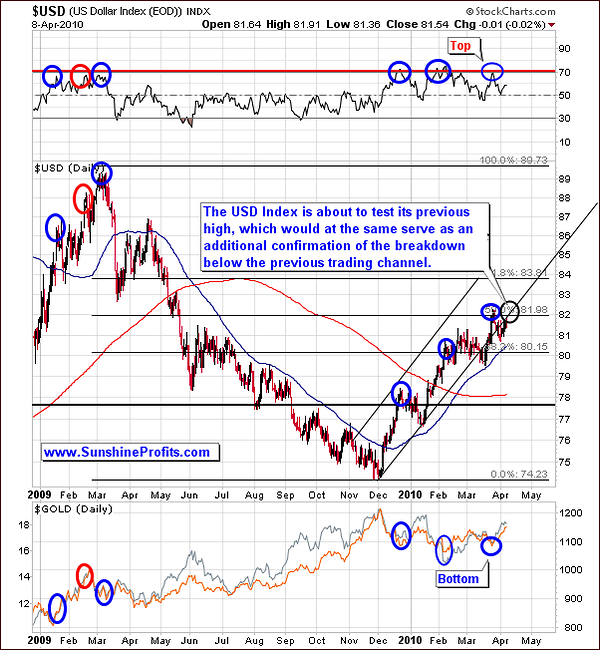
The USD is about to test its previous high, which will further confirm a breakdown below the previous trading channel. Our observation last week about not expecting the rally to last appears safe given that the USD continues to move along this low end line.
The RSI rebounded from last week's bottom further signifying that there will be a struggle to surpass the USD previous high. Therefore, we remain bullish on PM's in the medium-term but cautious in the short-term.
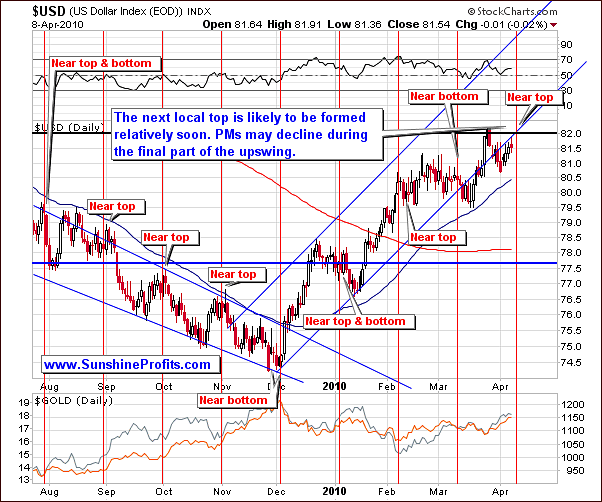
Moving to the short-term chart, the recent trend indicates we are approaching a local top.
In the previous Premium Update we wrote the following:
Moving on to the short-term chart you can see how [USD] is approaching its next cyclical turning point, which is likely to be a local bottom. It seems that it will be formed in the middle of April.
Still, USD moved higher during this week, which means that it is a local top - not a bottom that we are to see soon.
Expect PM's to decline during the final part of this USD upswing prior to resuming their upward trend. This should occur relatively soon - most likely during the coming week.
Another confirmation of the points made above comes from the analysis of the UUP ETF.
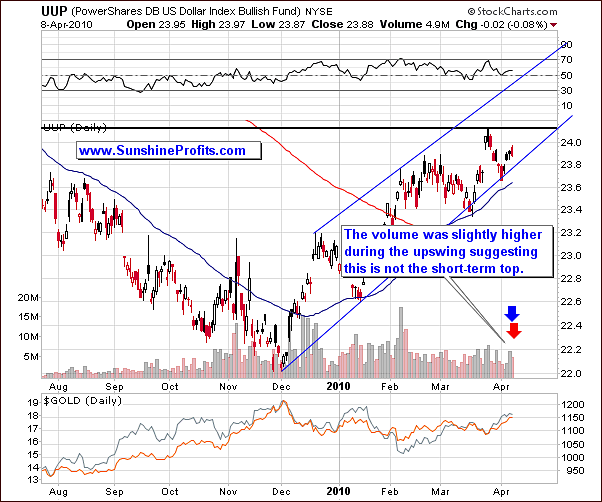
The UUP PowerShares ETF chart (proxy for the USD Index) allows us to analyze volume. The recent volume increase indicates that we have not yet reached a short-term top. Please note that the volume was higher during the recent upswing than it was the case during the downswing, which is a short-term bullish signal.
Please note that the UUP ETF is visibly below the recent high, which suggests that the U.S. Dollar may need to move temporarily higher before the local top is formed. Moreover, the RSI is again on the rise, which makes additional gains likely in the coming days.
Summing up, expect the USD to show little strength upward, with a sideways or slight downturn probable. Consequently, the outlook for PMs is still bullish in the medium terms though you might expect a slight decline before the true upward trend continues.
General Stock Market
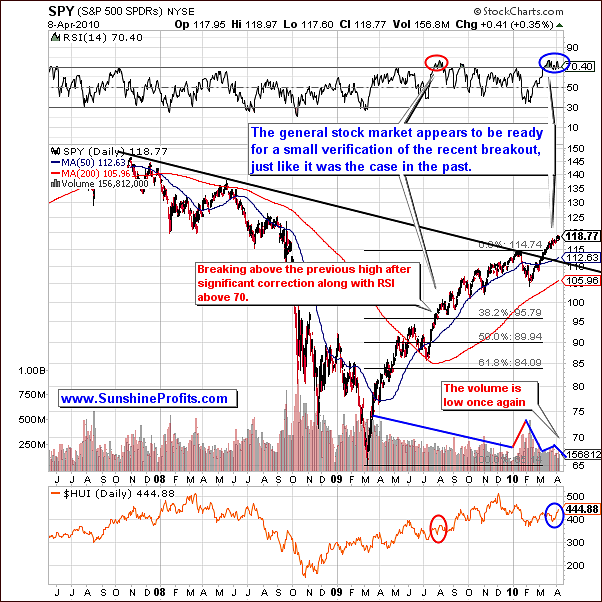
The general stock market appears ready for a small verification of its recent breakout. This situation is unchanged from last week as far as price is concerned. The RSI has maintained its solid 70 level with more time slightly above than below.
The volume has decreased visibly during the very recent upswing, which is a bearish signal. Let's take a look at the short-term chart for more details.
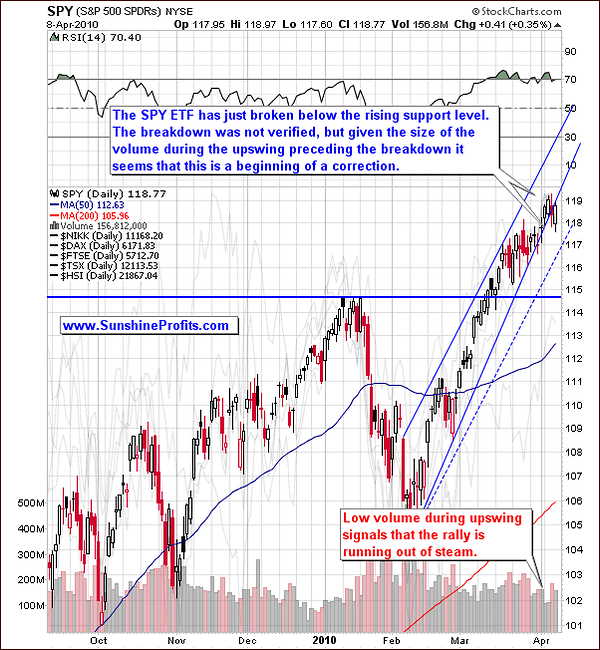
Looking at the short-term chart, the support level appears to be broken. This may signal the beginning of a slight correction as there has been a recent upswing in volume - on a relative basis - along with lower prices. Please note that Wednesday's decline took place on visibly higher volume than what we've seen on Thursday, when it moved back up.
Therefore, based on the above chart a move lower from here appears very likely in the short term. Additional confirmation comes from the DIA ETF and from the Nikkei 225 index.
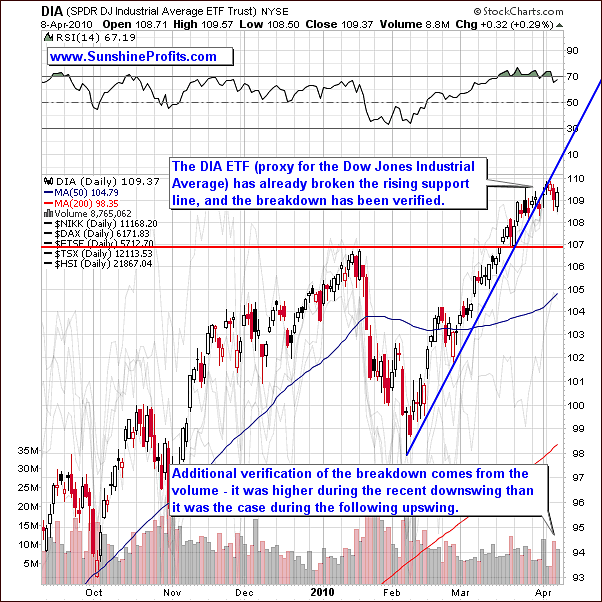
A glance at the DIA Dow Jones ETF Trust shows that it has already broken its rising support line and this has been verified. Note the increased volume as this downswing unfolded - this is a strong verifying signal that the correction has already begun.
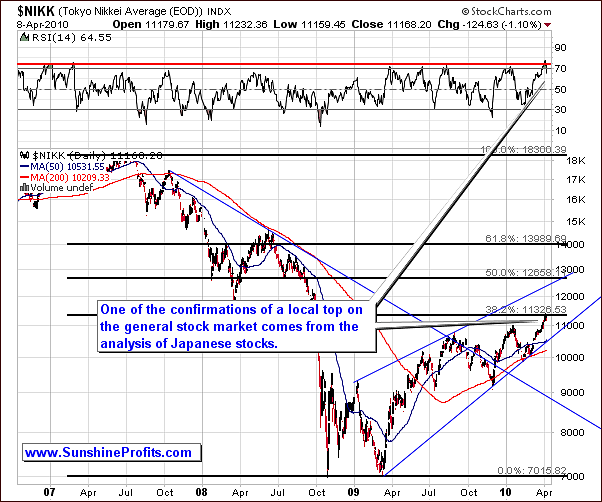
Given today's level of globalization and mobility of capital we can expect many market indices to move at the same time. This does not mean that they would perfectly reflect each other, but the turning points are the main directions in which the main stock indices go are very often in tune.
Consequently, the Nikkei 225 index (Japanese stocks) suggest that the stock markets around the world are to take a breather here, as this index has just moved to the strong long-term resistance level created by the 38.2% Fibonacci retracement of the huge 2007 - 2009 decline.
Summing up, consistent with last week's observations, we might need to see a verification of the previous high before stocks rally further. As you read in the following section, this may trigger a small consolidation in PMs.
Correlations
The correlations of the U. S. dollar with gold and gold stoc
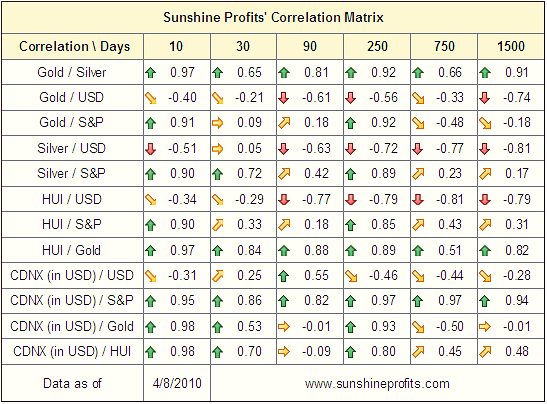 ks have become less negative. We were looking to see an alignment here and this is exactly what is taking shape, although the strength of the correlation has weakened. The 30-day values which were negatively correlated last week have nearly all become less correlated, i.e. closer to 0 or no correlation of any kind. Gold and its corresponding equities are indeed mostly USD driven for the short run.
What is really interesting is the 10-day column and very high readings for the PM sector and the general stock market. Although this does not necessarily mean that the main stock indices will once again become the main driver of the PM prices, it should make you cautious as far as short-term is concerned.
Silver held its high steady correlation with the general stock market. This is due to its multiple industrial uses as compared to other metals.
Summing up, the USD and PM's continue to have negative correlations, a fact that has us hold onto previous expectations of a move up soon to be imminent. Gold increased it correlation with the general market as well which continues to support our view of the weeks ahead for PM's.
Gold
Gold has and will most likely continue to trend upwards in the coming weeks. Though a small correction may be likely very soon, it is probable that the upward trend will be delayed only for a very short period of time. Look for the volume to increase after this brief correction and expect the upward trend to resume probably no later than at the end of this month, most likely during the next 10 trading days or so.
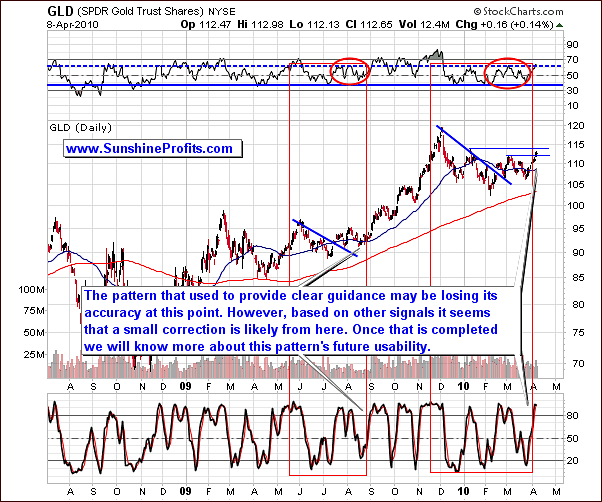
The big news this week is that the self-similar pattern which we were referring to in many previous reports may be losing its accuracy. At this point it is unclear which part of the upswing are we currently in, it the current move up is to look just like the September - December 2009 one. Therefore, we need to use other techniques and wait for the situation to crystallize before we can once again use the self-similar pattern that we referred to in the past.
The short-term chart provides us with details.
As mentioned above, even if the current rally is to be similar to the September - December 2009 one, it is not clear, which part of the previous move are we in today. It seems that we are (or very close to) either the point marked with the blue vertical dashed line (August 2009), or to the one marked with the red vertical dashed line (September 2009). Each of these points suggests that a small consolidation from here is likely, and that that a bigger upswing will follow once it is completed.
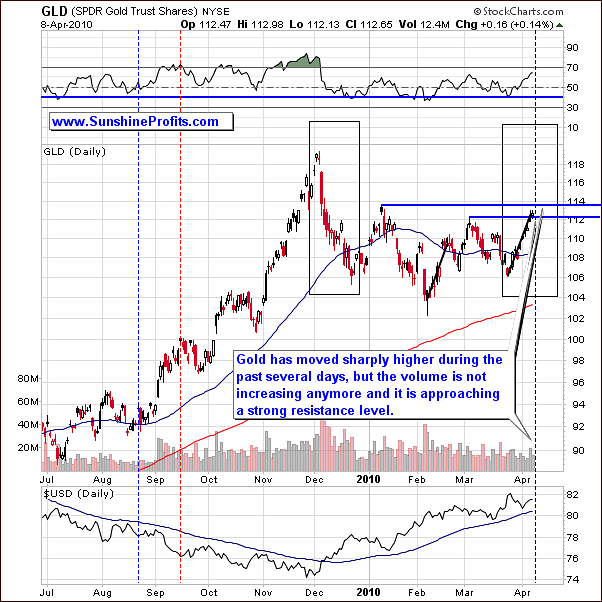
Please note that there is another self-similar pattern that we can spot at this point - we've marked it with black rectangles on the chart. The whole December 2009 - today pattern resembles a reverse-head-and-shoulders formation with the February low being the head, and December 2009, and March 2010 lows are shoulders. Please note that both shoulders have been very similar so far, and if this is to continue, we are to see a small move down before the trend is continued.
A look to the short-term chart reveals low to mid-level volume which indicates that the sharply higher move in the past few days will cease. A strong resistance level is being approached and this will likely cause a sideways or brief correction to occur. Again - the underlying rally will eventually resurface.
Another confirmation of the abovementioned points comes from the chart featuring price of gold from the non-USD perspective.
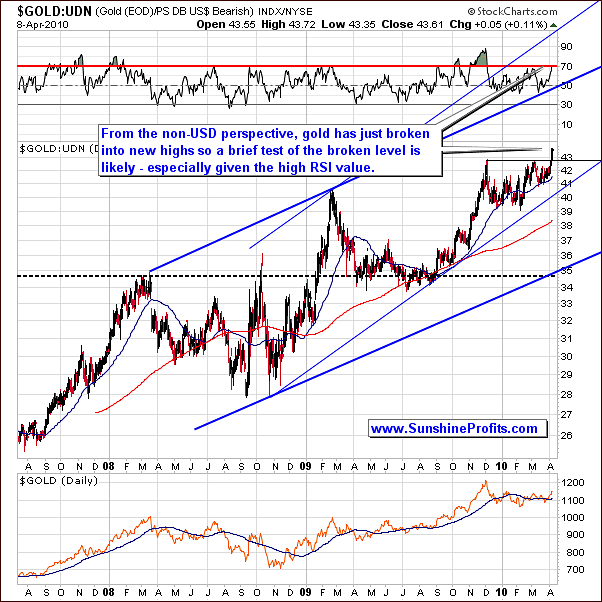
From the non-USD perspective chart (please read the February 26th 2010 Premium Update for more details), gold has broken into new highs and with an RSI of 70, we can expect a brief test of this breakout. Please note that the RSI indicator provided particularly valuable signals in the past. We are in uncharted territory, so this must be monitored very closely. The direction is up, the only questions remaining is how high and for how long.
Our best guess here is that we will see a small consolidation that would take gold to the previous high and then move up once again, thus verifying the breakout.
Summing up, we are still bullish on gold in the medium term; a brief pause or correction is likely to occur short-term but the rally is to resume relatively soon - within the next 10 days or so. The way gold behaves during the next several days will also let us know if the previously analyzed self-similar pattern is still in place, and if so, what does it suggest for gold in the following days/weeks.
The situation in silver confirms points made above.
Silver
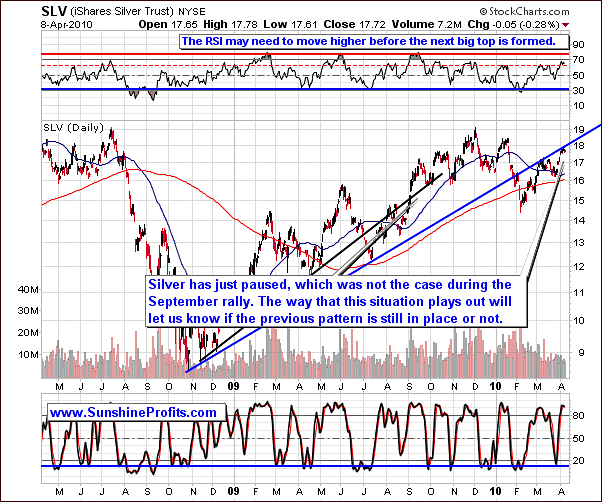
The week's silver activity revolves around one keyword: Pause. As volume on the SLV ETF dropped and held steady below 10M, the recent upward trend slowed to a crawl and took a small step back in the past few days. Some consolidation is likely before the next major move up, just like it is the case with the gold market. A slight correction is likely though its length should be quite short.
Please note that silver is also suggesting that there may be changes in the efficiency of the previously-analyzed self-similar pattern, as the rally has just paused, which was not the case during the huge September 2009 upswing.
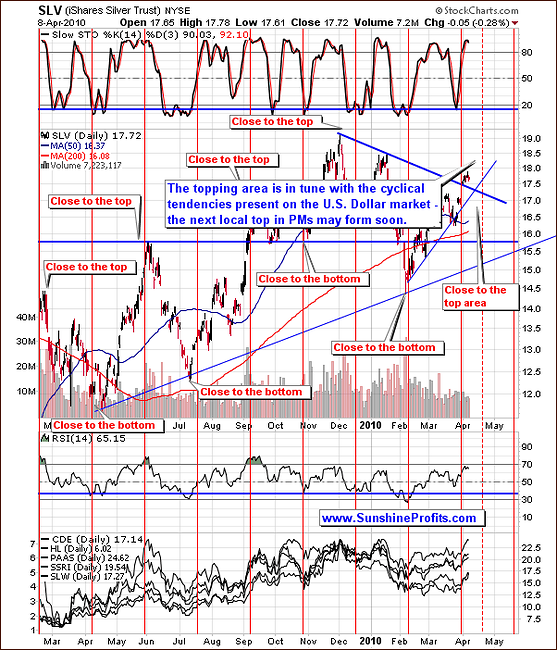
On the short term chart, we appear to be close to the top, and both: Stochastic, and RSI appear to confirm it. Though we may not see a sharp plunge in the week ahead, a small consolidation may be in the cards, especially given the situation on the general stock market.
Summing up, expect silver to be less than exciting in the following week for the long-term Investors, however short-term Traders may see another favorable buying opportunity. We send out a Market Alert if we believe that PMs are to rally in the short-term.
Precious Metals Stocks
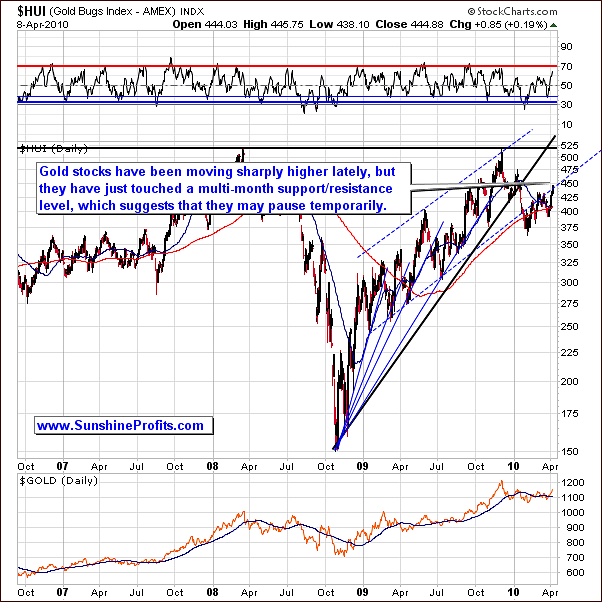
HUI - the Gold Bugs Index now has an RSI near 70 for the first time in six months. What this means is that though sharply moving higher recently, it appears to be ready to pause, especially, as the multi-month support level has been touched The close today is nearly 12% above the Jan-Feb bottom when the RSI was also briefly below 30. The bottom, as mentioned last week is surely in now and a strong rally may follow the soon to be seen pause.
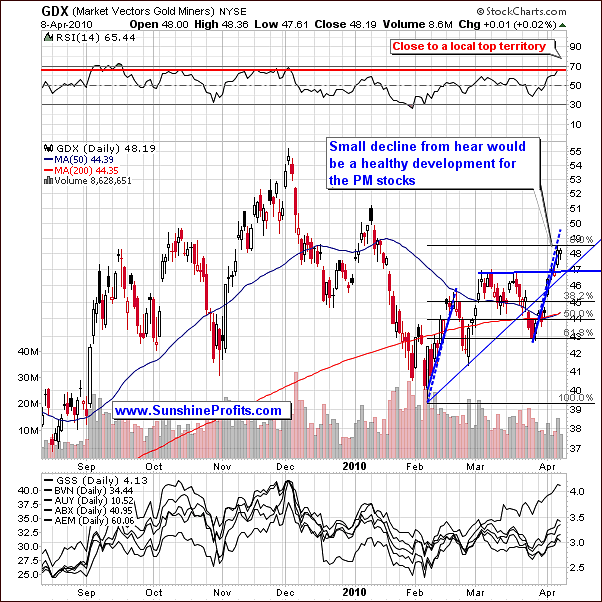
GDX - Market Vectors Gold Miners - the proxy for the PM stocks, which allows us to analyze volume - currently rests at a three month high. A small decline would be healthy for the PM stocks and it would provide another favorable buying opportunity but this may take another week or so to develop.
Please note that the RSI indicator is currently getting close to the 70 level which is traditionally a "sell zone" for this indicator. However, taking a look at its previous performance we see that PM stocks often topped out along with RSI at 65 or so, and this is where we have this indicator today.
Based on the sizes of the previous rallies, and especially the February one, we may expect the current rally to end very soon. Additional confirmation comes from the use of the 1.618 Phi number. Multiplying the Feb - mid-Feb rally by 1.618 we get the target for the next local top (around the $49 level). If we multiply the difference between two important bottoms - the February, and the March ones - by 2.618 (1 + Phi, or Phi * Phi) we also get target for the GDX ETF around the $49 level.
Summing up, the precious metals stocks appear to be ready to move temporarily lower, just like it is the case with the underlying metals.
Additional confirmation comes from the platinum market.
Platinum
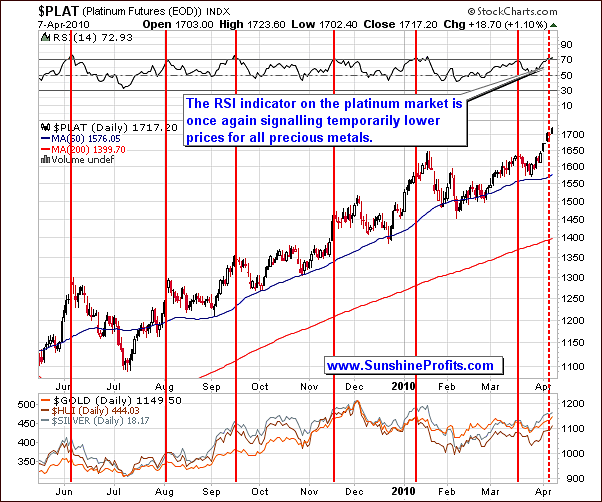
The situation is currently very similar to what we've written about in the March 19th 2010 update. Back then we wrote that we see that the platinum market has been topping along with signals from the RSI indicator, and the reliability of this particular tool has been remarkable (...) Moreover, the subsequent declines in platinum corresponded to a similar action also in the other parts of the precious metals market - please take a look at the lower part of the above chart for details.
The RSI hovering around the 70-level indicates that a short-term top is certainly near and when taken into account that this indicator has been reliably signaling tops in the Platinum market, it provides us with a high degree of confidence that we are indeed near a top in the whole PM market.
So, once again platinum futures and the RSI near 70 indicate temporary lower prices for all PM's in the short-term. With a close above the 1700 level, a correction seems likely sooner rather than later.
Summing up, look for consolidation and retracement to take place before a bottom can be confirmed and we start rallying back to the upside. Platinum is very close to putting in a short-term top, which suggests that the same action is to be expected in other metals markets as well.
Summary
The general stock market appears to be forming a local top, while the USD Index may need to move just a little higher before it resumes its decline. Based on the recent readings from our correlation matrix, this could result in a small decline in the PM sector.
Although the self-similar pattern in gold and silver does not provide us with clear signals this week, other techniques suggest that the precious metals market is reaching a local top. We don't expect the coming decline to be very big, and points made in the latest Market Alert remain up-to-date. Namely:
Even if the market moves higher from here, it seems that it would once again decline to where PMs are today during the next few weeks.
and
If we do get a correction from here, we currently don't expect gold to move below $1,100. Targets for silver and PM stocks are unclear at this point, although silver may not move lower than $17.80, and HUI is not likely to move below 410.
Please note that we have suggested closing the speculative long positions and realizing gains from the previous trade. We did not suggest selling one's long-term PM holdings, and we have not suggested opening speculative short positions in the PM sector.
This completes this week's Premium Update.
Thank you for using the Premium Service. Have a great weekend and profitable week!
Sincerely,
Przemyslaw Radomski

