
Prime Minister Gordon Brown, who will face a tough battle in the upcoming elections, has two nicknames in the British press-- "Golden Brown" and "Goldfinger Brown."
Since anything pertaining to gold is of interests to us at Sunshine Profits, we looked into why the Prime Minister has such monikers. Does he perhaps have a Midas touch?
It turns out that quite the opposite is true.
Brown, who took over from Tony Blair in 2007, acquired the ironic nicknames about 11 years ago when, against the advice of leading bankers, he sold off about 60% of Britain's centuries-old gold reserves. The timing of the sales, from 1999-2002, was "impeccable." In his role as Chancellor of the Exchequer he sold 400 tons at rock-bottom prices. He got an average price of $275 an ounce, raising $3.496 billion. (British gold traders have dubbed the 20-year-low the "Brown Bottom.") Since the unfortunate sale, gold prices have more than quadrupled to $1,159 an ounce.
There is a lesson to be learned here both for nations and for individual investors--hold on to your physical gold and don't worry too much about governments selling or "dumping" gold when its price gets very high - history suggests that governments are not the best traders and not necessarily sell at the top.
With only 310.3 tons of gold left in its Central Bank holdings, Great Britain, once an empire that ruled half the world, ranks number 16 on the list of gold-holding nations, just below Venezuela and just above Lebanon.
There is further irony in the fact that it was Britain that had led the way in establishing a gold standard when Sir Isaac Newton, as warden of the Royal Mint, linked the value of raw gold to the value of money back in 1717. The 1844 Bank Charter Act formalized the gold standard, the Bank of England's promise that every note could be redeemed for its value in gold. The gold standard lasted until Britain was forced to abandon it during World War I. Churchill returned to the standard in 1925 but it was again abandoned in 1931.
Newspaper accounts in the British press estimate that Brown's gold sale cost the British taxpayer about 6 billion pounds.
The gold sale has become a campaign issue and already posters have appeared of a smiling Brown with the accompanying text: "I lost 6 billion pounds selling off Britain's gold. Vote for Me."
According to British newspaper reports, the proceeds from the gold sale were invested in dollars (40%), in euros (40%) and in the yen (20%). It is safe to say that the revenues generated from the fiat currencies don't come close to the spectacular four-fold increase in the value of gold since the sale.
In May of 1999, when Brown announced his plans to sell the gold, the price had stagnated for much of the decade in a secular bear market. British gold simply sat in the vaults gleaming prettily but earning no interest. Some had perceived it as a capital wasteland, an anachronistic relic. Apparently, Brown wanted assets that would generate interest payments. He ignored gold's habit of retaining its intrinsic value over the long term.
Senior executives from leading banks warned Brown that he couldn't have chosen a worse moment to sell the gold. They cautioned that gold traditionally moved in decades-long cycles and that the price was likely to rise. They added that even if he were to go ahead with the sales, the timings and amounts should not be announced beforehand, as the gold price would immediately plummet. Brown did not heed any of the advice. The Treasury pre-announced its plans which caused prices to fall 10% before the sale. The decision to auction the gold rather than sell it quietly on the global markets was surprising. Other central banks, including those of Switzerland and Australia, had sold gold discreetly only announcing the details afterwards.
A day after Brown made the gold sale announcement, Alan Greenspan, then chairman of the US Federal Reserve, said in response to Brown's decision: "Gold still represents the ultimate form of payment in the world... Germany in 1944 could buy materials during the war only with gold. Fiat money paper in extremis is accepted by nobody. Gold is always accepted."
It turns out that Brown's gold sale has been bad for the British but in retrospect some good came out of it for gold investors. As a result of Brown's gold sale, 11 national central banks signed in 1999 what is known as the Central Bank Gold Agreement aimed at bringing stability to gold prices by limiting gold sales by the signatory Central banks to 400 tons a year. The agreement has been renewed three times since its inception and now includes 19 national central banks. In the past few years central banks have become net buyers of gold, rather than sellers, a bullish sign. Just last November India bought 200 metric tons from the International Monetary Fund for $6.7 billion. The transaction was the IMF's first such sale in nine years and propelled India to the ninth-biggest government owner globally.
The original Central Bank Gold Agreement was bullish because it eliminated a great deal of uncertainty in the gold market. Investors finally could be sure that European central banks would not dump too much gold too quickly. This began to restore confidence. Although the secular gold bull would not begin until April 2001, 18 months after the signing of the first agreement, it could be argued that it laid an important corner stone for the huge gains to come.
"Golden Brown" was wrong to dump gold in favor of paper currencies.Gold's breakout against the world's primary paper currencies underscores gold's growing allure as a store of value against further currency debasement caused by profligate government spending. It appears that gold is reassuming its role as an alternative currency unencumbered by the political liabilities of fiat money.
Speaking of the fiat currencies, let's begin this week's technical part with the analysis of the U.S. Dollar. Let's start with the long-term USD Index chart (charts courtesy by http://stockcharts.com.)
USD Index
In our previous report we wrote the following:
The USD is about to test its previous high, which will further confirm a breakdown below the previous trading channel. .....the USD continues to move along this low end line. The RSI rebounded from last week's bottom further signifying that there will be a struggle to surpass the USD previous high.
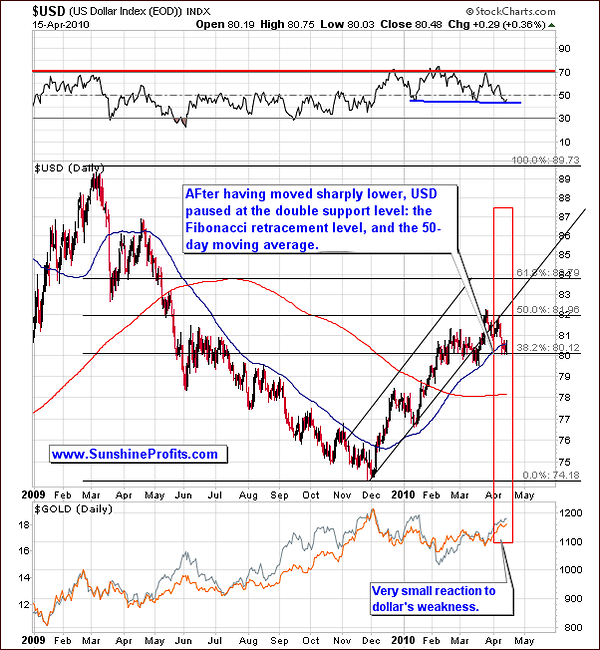
This week, the USD moved a bit lower, confirming the breakdown below the previous rising trend channel. This is an important development for precious metals investors, as the PM markets, of course, move in the opposite direction of the USD. Though this trend has not been true very recently, it is important to note that this week's move further verifies the breakdown below the uptrend. We can then conclude that lower values of the USD are to be expected in the medium term.
Clearly visible in the long term chart is an important note about the USD: currently there is a strong; in fact a double support level as the USD has paused at the Fibonacci retracement level and also at the 50-day moving average. This has historically been a very reliable support or resistance level (especially since April, 2009). If the USD is to break below this level soon (which we expect in the next week or two), it will serve as additional very strong confirmation of the direction in which the USD is going to move. Additionally, the current level (80) is a multi-year support level and consequently an important psychological level to move below. For PM's, this is bullish medium-term. However, this may not be the case in the short-term, since the USD moving to this support level created a possibility of a pullback. The RSI confirms this as it has dropped below 50 (around 45) and in 2010 this has marked a local bottom for the USD. Still, we expect that this time it may cause a small rally.
There has been only a very small reaction to the USD weakness. Gold and silver have recently been consolidating and this means that they may move a bit lower before the bottom is in. This holds true for mining equities as well.
Moving to the short-term chart, the lack of corresponding action is even more visible, which confirms points raised earlier.
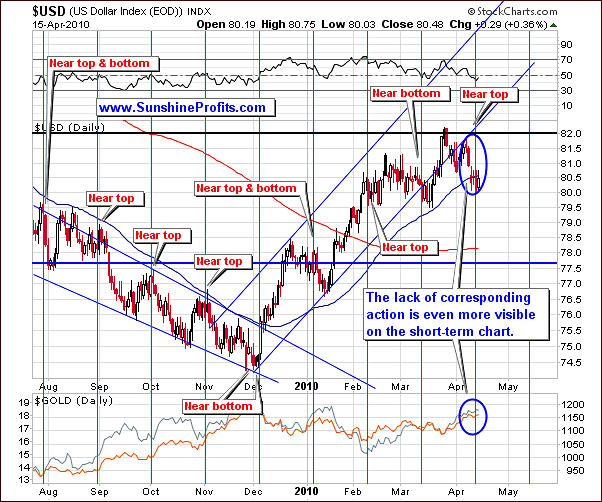
The vertical red lines seen in the above chart have strongly aligned with tops and bottoms with the next intermediate top or bottom expected in mid-May. Naturally, this does not mean we will not see any other local extremes along the way.
Having said that, let's take a look at the UUP ETF chart in order to analyze volume.
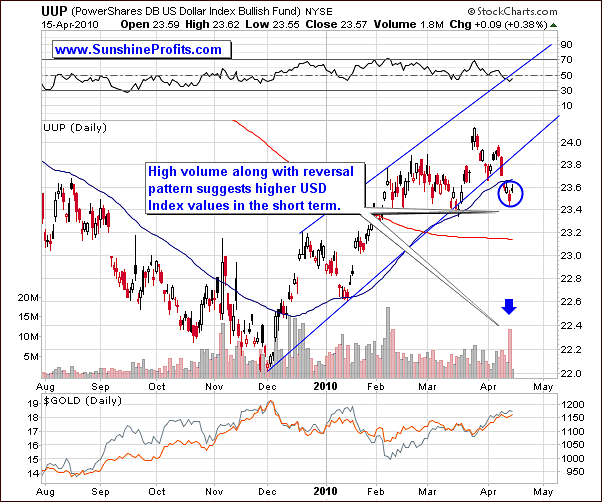
Last week we mentioned that it was not likely that we have reached a short-term top on that particular day, as the volume was higher during the recent upswing than it was the case during the downswing, which was a short-term bullish signal.
Actually, the short-term top actually was reached. Though it was likely last week that the USD was to move higher, the signals do not always forecast with complete accuracy. Technical analysis by definition analyzes the pending trends and projects what is most likely to occur. The fact that it does not always come to pass is something we simply must live with, always holding to the notion that it will steer us correctly more often than not. Actually, this is one of the reasons why we prefer to use various techniques, measure their performance and adjust our approach - it allows us to improve the reliability of the whole analysis, and thus performance.
Moving on to this week's situation, the signal is bullish, as we have seen strong volume during the reversal pattern. Also called a V-formation, we have seen prices dip and then move back up with very strong volume. This indicated heavy selling followed by an increase in price on the same day. This is a bullish, short-term signal as it reveals that the buying power was strong enough to absorb the huge sell orders - this is what the high volume means here.
Summing up, the weakening USD will most likely continue to struggle, which is a good sign for PM investors in the medium term. However - based on the analysis of the U.S. Dollar - we expect some additional downward moves for gold, silver, and other metals before the bottom is in. As we stated last week and can comfortably repeat: The outlook for PMs is still bullish in the medium term though you might expect a slight decline before the true upward trend continues.
General Stock Market
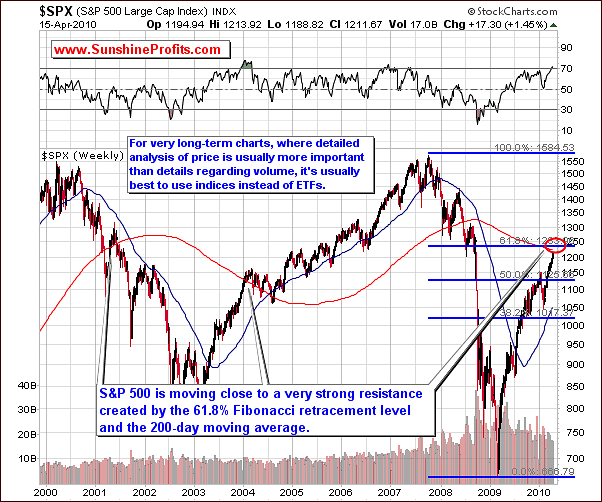
The general stock market appears to still be heading for a correction, as volume continues to be low and prices have continued to trend upwards. This week we will begin with looking at the S&P 500 Large Cap Index chart as is gives a better analysis than the ETF when price alone is concerned. ETF can, at times distort price and reduce the reliability of our technical tools from the very long perspective.
Focusing on the Fibonacci Retracement level (approaching), this may stop the rally or provide support if it is broken. Also, the 200-week moving average also may provide support or resistance. We've commented on this particular tool in the March 26th, 2010 Premium Update. Back then we wrote the following:
The above chart points out that over the last 10 years the 200-week moving average used to provide support but did not provide strong resistance. This phenomenon is in fact visible also on the SPY ETF chart.
Another interesting thing is the way the value of the S&P 500 shaped in 2004 - please note that it has broken through the 200-week moving average without a pause, and then stopped around the 2002 high. After this took place the S&P 500 found support at the 200-week moving average. Should that be the case also today, we might see further strength in the main stock indices followed by some kind of consolidation once it moves above the area marked with red ellipse.
The short-term chart provides additional details, but first let's zoom just the 3-year chart.
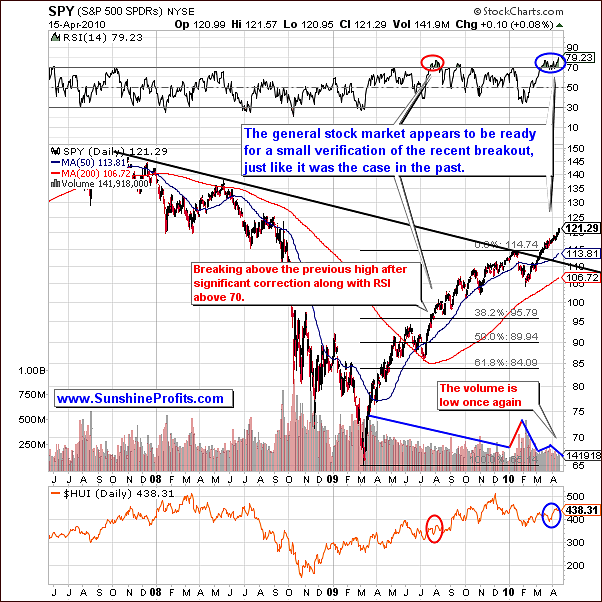
There are virtually no changes on the 3-year chart since the last week. The volume is still relatively low, RSI indicator suggests even more overbought condition than it was the week before.
Therefore, even though they are already severely overbought, over the next month, stocks may rise above this resistance level and top out above it. Naturally, we may see a move lower even without stocks breaking above this resistance level, but currently odds slightly favor the former outcome.
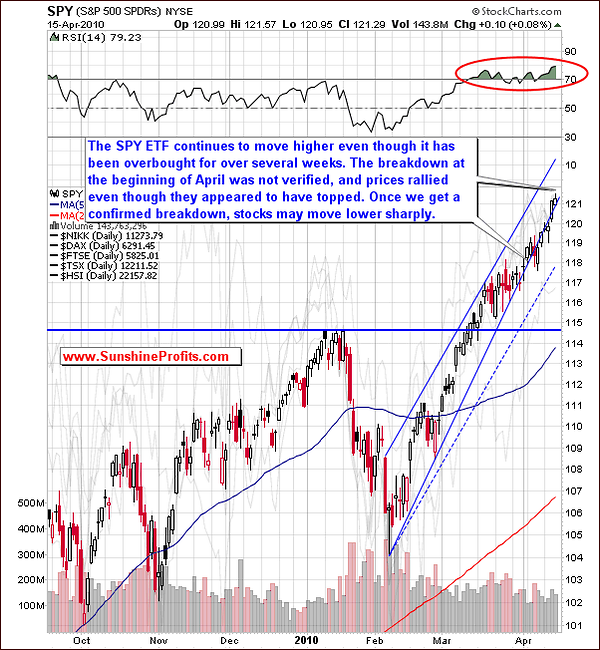
Moving to the short-term chart, we recall that last week we stated that the breakdown below the rising support line had not yet been verified but the volume indicated that verification was likely. This did not occur, and consequently prices moved up once again. At this point we must now conclude that it was a "fake breakdown." The rally continued as the market became even more overbought. The RSI close to 80 indicates that once we get a confirmed breakdown, the decline could very well be quite sharp.
Many stocks are overbought and investors will rush to close out of their positions and take their profits off the table once they get slightest signals that the correction is very likely.
The coming correction may be after the 200-week support level is slightly surpassed (as we saw early in 2004). This could also happen sooner if a breakdown below the rising support line is verified prior to surpassing the 200-week support level.
The implications for precious metals are unclear at this point as we will see in the upcoming correlation matrix. Another interpretation would be that PM's didn't rally strongly even given the positive influence from the main stock indices. We will get back to this as soon as more information becomes available as our intent is to always provide direction for those invested in the PM sectors.
Summing up, a correction is inevitable for the general stock market, but its exact timing is unknown at present. The overbought status of today's market indicates that the longer this correction is delayed, the sharper the decline will be. Today's signals do not indicate that this downturn is to take place immediately. The implications for PM investors are neutral - to - negative, and thus it is in tune with what we wrote in the USD Index section.
Speaking of the influence that the USD and the general stock market may have on gold, silver and mining stocks, let's take a look our correlation matrix.
Correlations
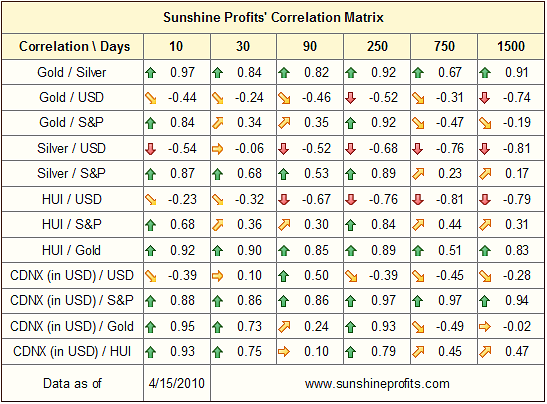
This week there are not many changes in the above table. Many of the values are very low (close to 0). This is especially true for the USD and the general stock market as well as for gold and gold stocks. Silver is aligned with the general stock market especially in the 10 and 30 day columns. This is normally the case.
There is a greater correlation between metals and the general stock market than with the USD. However, this is not very significant. Once again, very few changes and neither the USD or the general stock market is a sure bet for supplying any signals for the metals and mining stocks.
Summing up, we must pay specific attention to other tools such as the gold, silver and metals charts themselves and rely on other techniques rather than the correlation matrix. The correlation factors can give additional insight however; we must utilize other tools to give us clear direction. As always, we will keep our eye on the correlation between the USD and general stock market and report to you accordingly.
Gold
Last week we stated that gold has and will most likely continue to trend upwards in the coming weeks. Though a small correction may be likely very soon, it is probable that the upward trend will be delayed only for a very short period of time. Also, the self-similar pattern, which we were referring to in many previous reports, may be losing its accuracy.
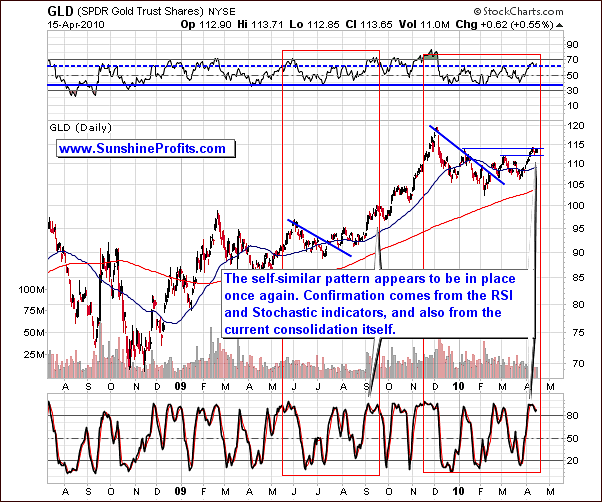
The good news this week is that the self-similar pattern seems to have returned. At least that what the long-term chart is suggesting, although confirmation of this is not crystal clear. There are some differences but it is much more useful than last week.
Gold's price moved higher and we are now seeing some consolidation as the RSI is higher than its recent previous highs. The Stochastic indicator also points us to a situation similar to September 2009. However, the rally is not as rapid and has not been confirmed by high volume. We expected to see higher volumes but they did not occur. History tends to rhyme, not necessarily to repeat itself word by word, and it seems that this is exactly what we've seen recently.
We are now trading between resistance and support levels. Previously we saw trading between February and June highs. The current correction should last for the next few days, which should make it slightly more visible on the long term chart.
Moving on to the short-term chart, recall that last week we mentioned that a reverse-head-and-shoulders formation with the February low being the head, and December 2009, and March 2010 lows are shoulders (...) if this is to continue, we are to see a small move down before the trend is continued.
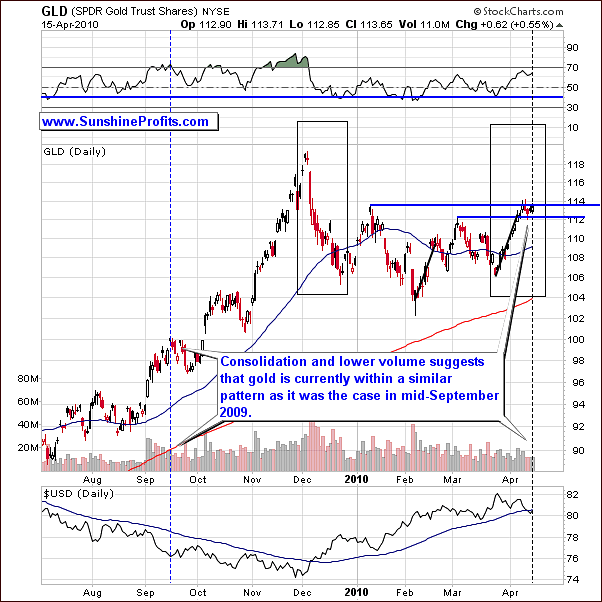
We have previously mentioned that it might be the case that the patterns marked with black rectangles will be similar and symmetrical, with declines being brief and sharp. This is what occurred in December; however it is not what we saw this time. Therefore, it is no longer highly probable that both moves will be as symmetric as we had expected. It has been somewhat invalidated by the lack of volatility in recent days. That particular pattern is therefore not very reliable going forward as far as details are concerned.
In September 2009, the consolidation consisted of sideways movement in the $1,000 range with the ETF moving between $97 and $100. This zigzag pattern of high-low-high-low yielded a second low, which was deeper than the first. We expect this again as our initial low is in for this consolidation and we are again on the upswing. Therefore, it is still probable that we will next see a downward move before the rally resumes.
Let's talk about expected value for a moment. It seems that the odds are about 2:1 that gold will move lower from here temporarily - to about $1,140, before it rises to $1,220 once again. You would have better odds to buy low and ride the rally from there, so it seems like a no-brainer. However, please note that if you were on the sideline, you might miss the rally by not entering in time. The odds of 1:2 translate into about 33% probability for the market to rise without looking back. However, the potential loss in missing is very large (more than twice as large as the potential additional profit that you would gain by buying the coming low). Therefore, wouldn't it be better to go long right away rather than at the end of the consolidation?
The situation is not simple in determining what action one should take, because the action would vary depending on one's approach to the market. Therefore, we decided to describe the whole situation with odds and targets instead of making a singly buy or wait recommendation.
Summing up, last week we stated that we are still bullish on gold in the medium term; a brief pause or correction is likely to occur short-term but the rally is to resume relatively soon - within the next 10 days or so. At this point in time, we still expect gold to move sideways or decline slightly in the near-term. Still, we remain bullish medium-term, consistent with what we stated last week.
Silver
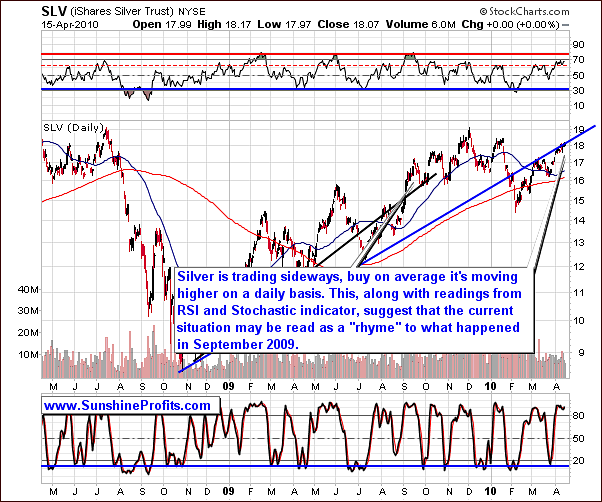
Silver's long-term chart is quite similar to what we featured last week. Our long-term price trend has changed little from what we saw a week ago. We expected a sideways market and actually saw some increase in price, but the momentum behind this upward move was quite weak. The current trend is quite similar to what followed the September 2009 rally and the similarity is also visible in the RSI and Stochastic indicators. This serves as a confirmation of what we previously discussed earlier in the gold section.
Please note that silver's self-similar pattern - just as it is the case with gold - does not provide crystal clear signals, but in sum it still suggests that the lower prices are likely before the rally resumes.
The expected move lower should not dip below $17.00 - $17.50 as we see it. This downward move is expected soon, probably in the week ahead, but again should be well below a 5% move downward.
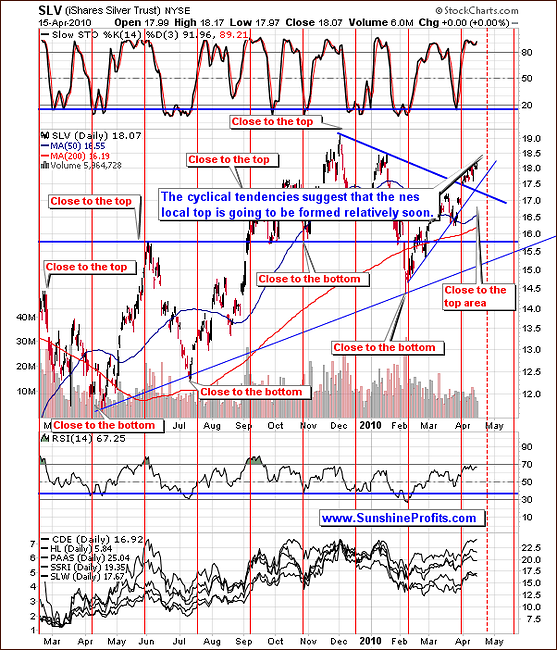
Moving to the short-term chart, we see that silver is still in the "close to a local top" area. As with the USD index, charts are quite cyclical. The fact that we are closer to a top than to a bottom indicates that we will see the former relatively soon and some downward movement in price will follow. Again, the $17 - $17.50 area (just slightly more than 3% decline) is where we feel it will eventually settle.
Summing up, expect silver to reach its local top soon and then move slightly downward. There appears to be little downside risk right now with this metal as it is slowing as it nears the top and then will drop only slightly according to the signs we see presently. As always, we will send out a Market Alert if we believe that PMs are to rally in the short-term.
Precious Metals Stocks
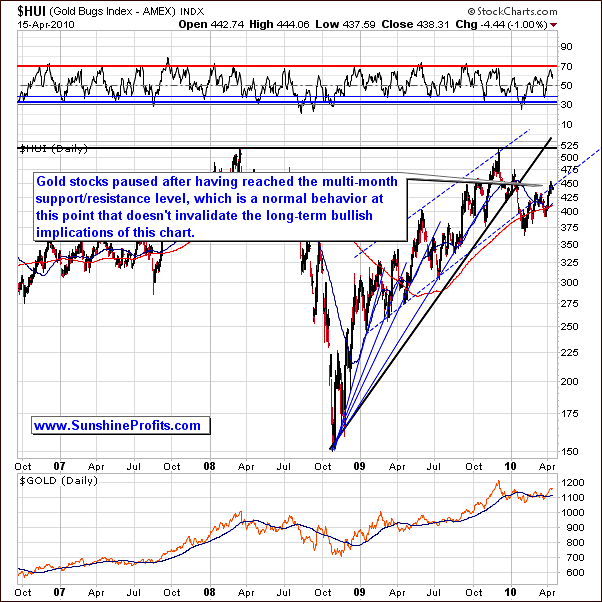
Moving on to the situation in the mining stocks, it seems that the situation develops quite normally. Although there are voices saying that the rally in gold stocks is over and they are to decline from here, we don't see that on the above chart.
As mentioned in the previous update, we've stated that though sharply moving higher recently, it appears to be ready to pause, especially, as the multi-month support level has been touched. Consequently, the current pause is something natural, not necessarily a signal of a coming plunge. The real question, which must be addressed, is "how low will prices go?"
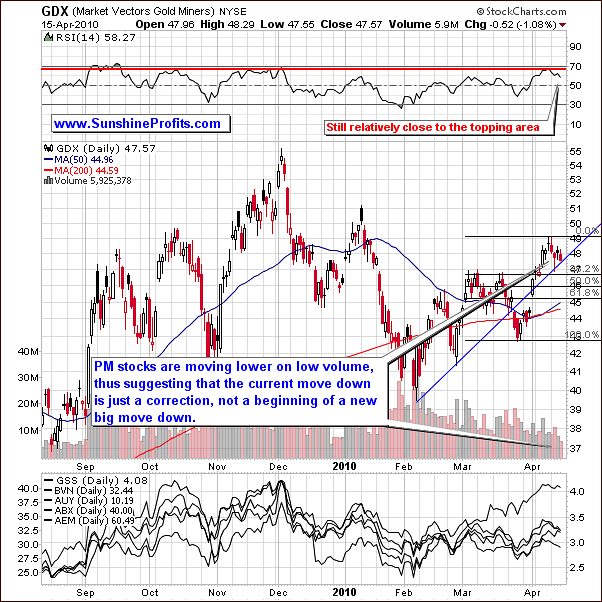
The short-term chart of GDX (Market Vectors Gold Miners) ETF suggests that we are to expect the resistance level of 49 to hold as the upper point with an expected support at $47 and even more likely $46. This is similar to what we expected gold to do (in the gold section of this week's update) and a slight decrease is very likely. If there is an increase in price at this time, expect the % to be greater than that of a decrease.
Again, the discussion between probability and the expected value (in other words - what is more likely to happen vs. what does each outcome mean to you) from the gold section applies also here.
Additional confirmation of the points made in this update comes from the analysis of the Gold Miners Bullish Percent Index - a market breadth/momentum indicator that is calculated by dividing two numbers: the amount of gold stocks on the buy signal (according to the point and figure chart, which emphasizes strong moves while ignoring small ones) and the amount of all gold stocks in the sector.
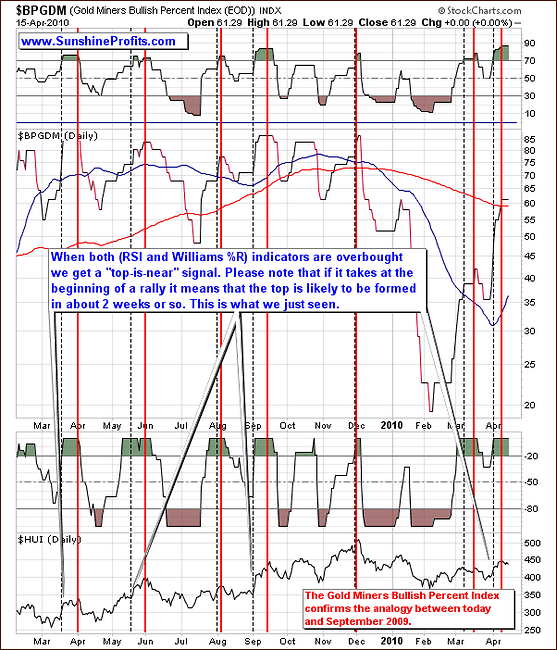
We have featured the above chart also in the April 2nd, 2010 Premium Update, when we wrote the following:
The high-probability sell signal is given if this index moves higher, and both indicators (RSI and William's %R) used on the above chart become, and then stay overvalued for some time. The initial overbought signal is marked with the vertical dashed black lines, and the top signal is marked with red lines. The overbought signal was given several days ago, so the probability that the top is already in is relatively high.
Still, taking a more detailed approach, we see that if we get this signal at the beginning of a rally, the top is likely to be formed in about two weeks. That was the case about a year ago, in May/June 2009, and in September 2009.
Consequently, we have just seen a local top, and since that was the case, the whole situation on the market becomes more similar to what happened in September 2009, and this means that another small move lower in the next several days is likely.
The final confirmation comes from our unique indicators, which have recently flashed buy signals.
Sunshine Profit's Unique Indicators
The indicator that was the first one to flash a buy signal (the indicator moved below the lower dashed line) was the SP Gold Bottom Indicator.
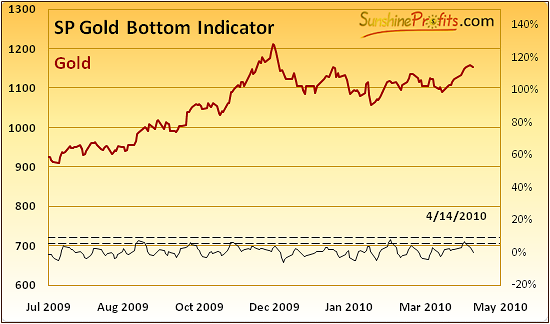
According to its name, we've designed this particular indicator to signal favorable buying opportunities in gold and this is exactly what it did this week. Please note that buying opportunity does not necessarily correspond to the exact bottom - it is rather a time/price combination, which will provide you with decent returns in several weeks, not necessarily right away.
Therefore, what this indicator signaled this week was that we are to see gold moving higher in the medium term - which confirmed what we had written in the previous update - namely, that we are still bullish on gold in the medium term.
As far as short-term implications are concerned, please take a closer look at the above chart. There were several times when we've seen the buy signal during the past several months, and each time some kind of consolidation followed. Naturally, this is not very informative, because we already know that we have a consolidation right now, so the question is if we have seen the end of the correction or is it still ahead of us.
Based on the previous signals from the above mentioned indicator and what price action followed each of them, it seems that we will need to see more visible downswing before the rally continues. So far we've seen only a few signals from this indicator in the past several years (Sep 2009, Oct 2009, Nov 2009, and Feb 2010) and 3 out of 4 times (except Nov 2009) a visible correction materialized before rally's next stage. Therefore, this is what we expect to see also today.
Our other indicator - the SP Gold Stock Bottom Indicator also confirms the above points.
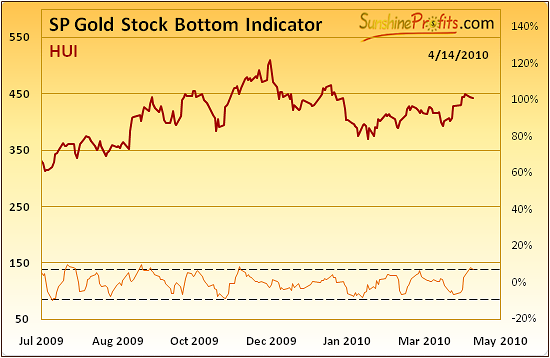
This indicator is based on a different mechanism than the previous one and it is dedicated to gold stocks instead of the metal itself, but since gold tends to move along with gold stocks, it makes sense to analyze also this indicator even if one is only interested in gold itself.
Please note that the above indicator often trades similarly to the previously featured SP Gold Bottom Indicator, thus confirming it signals (or not). The key point here is that this week's action in this indicator surely confirms the analogy with what we've seen in September 2009.
Yes, the main use of the SP Gold Stock Bottom Indicator is to signal favorable buying opportunities, but it please keep in mind that it is always useful to pay attention to the context of a given signal. This time this approach suggests that the PM sector is indeed to rally from here, but not necessarily right away.
Summary
The USD Index appears to have reached a support and is likely to rally insignificantly from here, while the general stock market continues to climb higher even though it is massively overbought. Still, at this point gold, silver, and mining stocks appear to be moving on their own instead of following signals coming from any of the above mentioned markets.
It seems that the whole PM sector is likely to move lower from here before resuming the rally. However, since the cost of missing it is greater than the potential increase in profits achieved by buying closer to the bottom creates a specific situation. It seems that the odds are about 2:1 that gold will move lower from here temporarily - to about $1,140 (silver to $17 - 17.50, GDX ETF to $46).
Therefore, if you have a Trader's approach meaning that "there's always the next train" and you prefer to enter transactions only at "screaming buy" points, you might want to wait for the bottom to be formed.
However, if you really hate "missing the boat" and you prefer medium- and long-term trades instead of several quick ones, it might be a good idea to go long right away (especially that PMs have just moved considerably lower at the moment of writing these words) without waiting for the final bottom. When we have sent out the sell alert on April 7th, it was highly improbable that the PM sector would move much higher soon. Today, this probability is considerably higher, as we are close to the end of the correction, not to its beginning.
This completes this week's Premium Update.
Thank you for using the Premium Service. Have a great weekend and profitable week!
Sincerely,
Przemyslaw Radomski

