
It’s no secret that the U.S. is borrowing too much, that China manipulates its currency and that Europe’s fiscal troubles are growing at the same time that “the luck of the Irish” is running out. There does not seem to be any international political will to cooperate to rectify any of these imbalances.
The G-20 meeting in Seoul, South Korea, achieved nothing to improve global imbalances and end the currency conflicts.
Not that we had great hopes.
Is it any wonder that investors are feeling like the other shoe is about to drop? This week European officials, increasingly concerned that the Continent’s debt crisis will spread, were warning that any new rescue plans may need to cover Portugal as well as Ireland to contain the problem they tried to resolve just six months ago.
And gold? With the $1,400 per ounce mark under its belt, after it corrects, gold will most likely shoot up for the next target and again you will see newspaper headlines saying that gold broke all time highs.
About Those “All Time High” Headlines
When you see headlines like “Gold sets record high” on the front page, take it with a grain of salt. As we have pointed out in the past, gold is at a record only if you don’t adjust for inflation.
The actual record was set 30 years ago, when the price of gold, in today’s dollars, hit more than $6,000 (taking static way to measure inflation into account), or over 340% higher than it closed on Thursday.
The price of gold began rising a decade ago, around the same time that oil prices began rising (we decided to link to the chart instead of featuring it here, as it might appear misleading, as it is based on the official inflation numbers, not the real, static ones - still, you can clearly see the big moves on this chart). Both fell sharply in the 1980s and 1990s, but began to increase around 2000, partly due to economic growth in Asia raising demand for commodities.
When the financial crisis occurred in 2008, oil and gold both fell, although gold’s fall was milder and it soon began rising again. Over the last two years, it has nearly doubled in price.
Stimulus Effective Under Certain Circumstances
A recently published paper that studied the stimulus efforts in 44 countries showed some interesting findings. Ethan Ilzetzki of the London School of Economics and Enrique G. Mendoza and Carlos A. Vegh of the University of Maryland argued in their National Bureau of Economic Research paper that fiscal stimulus can be quite effective in low-debt countries with fixed exchange rates and closed economies.
But stimulus measures are generally not as effective in countries like the U.S. with high debt and floating exchange rates. The authors of the paper pointed to a series of specific circumstances that throw a wrench into the effectiveness of increasing public spending: How much of the stimulus money ends up flowing abroad? How do investors respond to fear of future interest rate increases?
New York Times columnist David Brooks mentioned the study and wrote in a column this week:
When you look around the world at the countries that have come through the recession best, it's not the countries with the brilliant and aggressive stimulus models. It's the ones like Germany that had the best economic fundamentals beforehand.
It all makes one doubt the wizardry of the economic surgeons and appreciate the old wisdom of common sense: simple regulations, low debt, high savings, hard work, few distortions. You don't have to be a genius to come up with an economic policy like that.
Our take is that the Fed knows that the stimulus isn't going to work as advertised, but they decided to go with it anyway, simply because they are desperate.
The Fed on the Defensive
Speaking of geniuses and economic surgeons, in an unusual move, top Fed officials came out this week to defend their recent move to inject $600 billion more into a sluggish economy. The Federal Reserve has come under attack both at home and abroad with a torrent of criticism from foreign leaders, Congressional officials, economists and Alan Greenspan, the former Fed chairman.
Perhaps what unsettled the Fed officials most was an opinion piece by Greenspan in The Financial Times last Thursday. Greenspan said the United States was “pursuing a policy of currency weakening” and increasing the risks of trade protectionism.
Another barrage of criticism came in the form of an open letter this week to Ben Bernanke, in which a group of conservative economists, writers and investors urged that the Fed’s action “be reconsidered and discontinued,” arguing that the bond purchases “risk currency debasement and inflation.” The group included Michael J. Boskin, a former chairman of the White House Council of Economic Advisers; the historian Niall Ferguson; and the economist John B. Taylor, one of Bernanke’s most prominent critics.
In a rare on-the-record interview, William C. Dudley, president of the Federal Reserve Bank of New York said that the Fed’s move was not intended to affect the value of the dollar, but rather to encourage a quicker, stronger recovery. He said:
We have no goal in terms of pushing the dollar up or down. Our goal is to ease financial conditions and to stimulate a stronger economic expansion and more rapid employment growth.
And in an interview with The Wall Street Journal, the Fed’s new vice chairwoman, Janet L. Yellen, defended the decision in broadly similar terms.
Dudley rejected the idea that the Fed might be setting the stage for uncontrollable inflation in the future. Dudley cautioned that: One shouldn’t view this instrument (quantitative easing) as a panacea or a magic wand that’s going to make the economy recover rapidly. It’s going to be a long and bumpy road to a strong and vigorous expansion, but this will be helpful rather than hurtful.
We say, that remains to be seen.
India’s Heart of Gold
The World Gold Council released its numbers for India gold demand and they are looking very good. Last year the total Indian gold demand accounted for 15% of the global gold market at $19 billion.
Key findings include the following:
• Over the past ten years, the value of gold demand in India has increased at an average rate of 13% per year, outpacing the country’s real GDP, inflation and population growth by 6%, 8% and 12% respectively.
• The country currently has one of the highest saving rates in the world, estimated at around 30% of total income, of which 10% is already invested in gold.
• Based on WGC estimates, the nation owns over 18,000 tons of above ground gold stocks worth approximately US$800 billion at today’s gold price and representing at least 11% of global stock.
• This is equivalent to nearly half an ounce of gold ownership per capita, a figure which is significantly below consumption in western markets, representing scope for additional future growth.
To see what the short term future holds let's begin with an analysis of the USD Index (charts courtesy of http://stockcharts.com.)
USD and Euro Indices
Short-term USD - US Dollar Index Chart
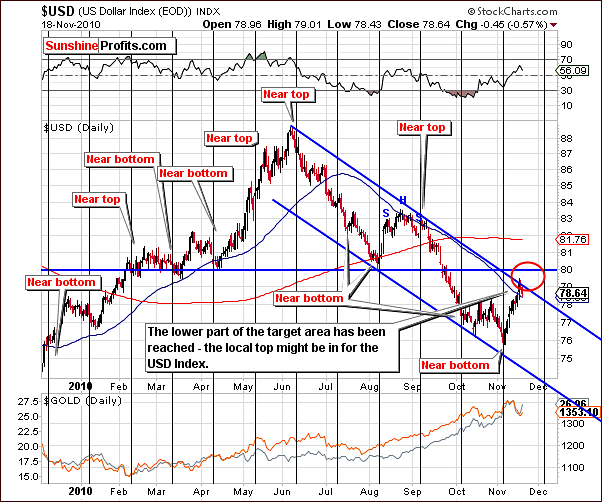
We again begin this week’s Premium Update with the long-term USD Index chart. This week, the index values reached the lower part of our target ellipse. Betting on higher USD levels is likely no longer profitable. In other words betting on lower gold prices may or may not be advised since there is some uncertainty for the short-term gold trend.
Being out of the gold market or holding long-term capital out of gold, silver and mining stocks does not seem to be a good idea right now. Resistance levels have been touched and the upper border of the declining trend channel is very much in play. Please note that the USD Index is not yet close to its next cyclical turning point, which may suggest that the buck is going to trade more or less sideways toward the 80 level or so before declining once again.
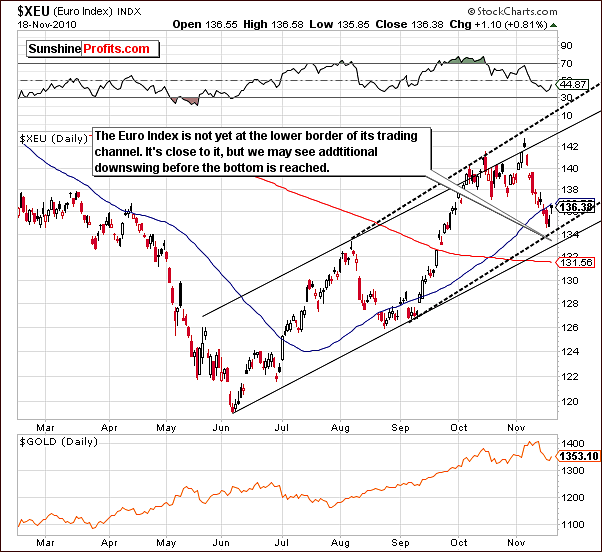
We decided to just make a quick, short point about the Euro Index this week. While the analogous target on the previous chart has surely been reached, the rising trend channel has not been touched here and is a sign of some weakness in the euro. This could lead to further strength in the USD Index and a move up to the 80-level is quite possible in the next week or so.
Summing up, the USD Index remains close to a local top and the Euro Index analysis may imply further strength for the dollar. This weakness in the euro and subsequent strength for the USD is not, however, expected to be a huge influence. Concerning precious metals, the bottom may have been seen already but a slight move lower is still a possibility. More on that in the following section of this update.
General Stock Market
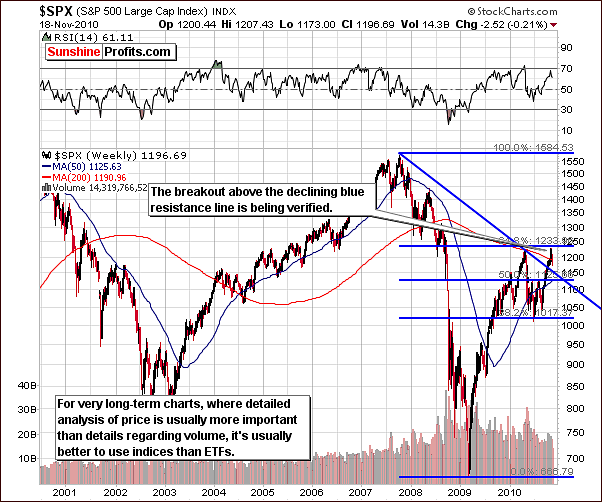
In this week’s long-term S&P 500 Index chart, we see that a correction to the breakout above the declining trend line (marked above with blue) is underway. The 61.8% Fibonacci retracement level based on 2007 through 2009 has once again provided resistance for the rally. Further slight declines may be seen before the current decline is over and stocks resume their rally - thus finally breaking above the abovementioned resistance (currently at $1233).
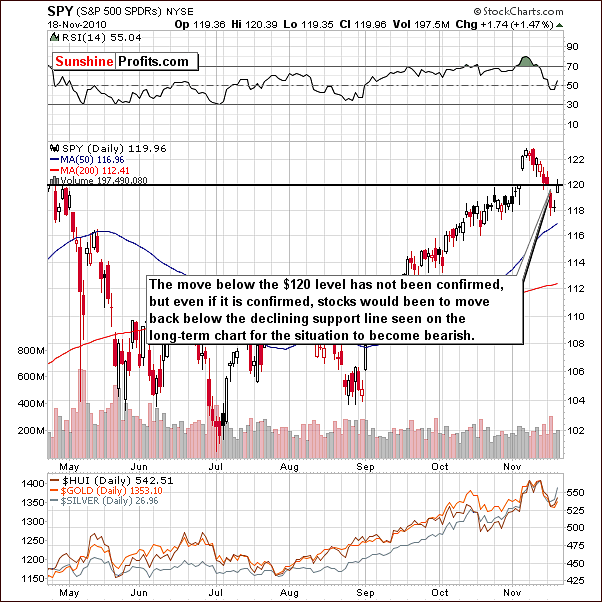
The short-term SPY ETF chart this week shows a level below the previous high of 120. However, only 2 days fell below this level before an intra-day move back above it (actually, right to it) was seen, so the breakout has not been invalidated.
Consequently, the bias remains bullish for the main stock indices, however - as mentioned a few paragraphs earlier - it will stay bullish even if stocks move lower temporarily as long as they stay above the declining long-term resistance line.
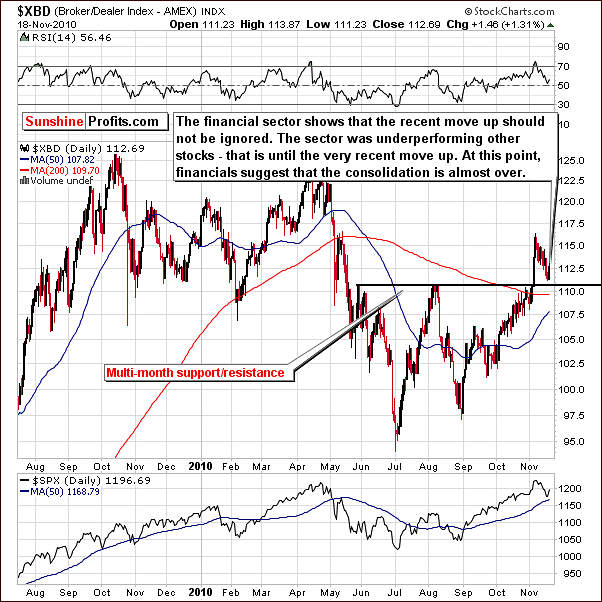
The Broker Dealer Index chart measures the strength of the financial sector. This week it is clear that the breakout above the multi-month resistance level has not yet been verified. It seems likely that further declines from the present 111 level may be seen. It was often the case that the financials lead other stocks, so at this point the fact that they did not move below their important support levels can be viewed as bullish.
Summing up, the general stock market at this point appears to still be bullish. Currently we are seeing a correction of the breakout above the long-term declining resistance line. It is not clear at this time whether this correction has completed. Strong support level, have not been reached, but they may not need to be reached as the move below the previous high has not been verified.
The implications for precious metals are similar but it is important to note that any declines seen should not be of major concern as long as stocks don't break below their long-term support line. The likelihood of higher prices corresponding to general stock market sideways movement is also quite possible.
Correlation Matrix
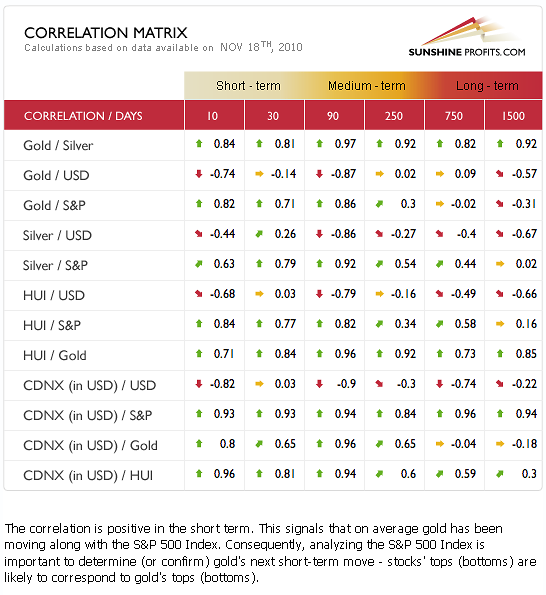
This week’s Correlation Matrix shows that short-term coefficients for gold and the general stock market are similar to those seen for silver and mining stocks (the description is visible above). The 30-day column shows that correlations with the USD are mixed. There appears to be a tendency for reversal back to the long-term tendencies - that is the correlations being negative. In other words, it seems that the precious metals sector will once again rise along with the dollar's decline.
A local top in the USD Index will likely influence gold, silver and mining stocks in a positive manner. The local bottom seen for metals will likely be followed by a rally. Overall the Correlation Matrix confirms points made earlier in this update and suggest that caution is necessary in the short-term.
Please remember that this improved correlation matrix is interactive as an explanation of each coefficient’s meaning and importance can be seen at the bottom of the chart when the cursor is placed above each part of the table.
Gold
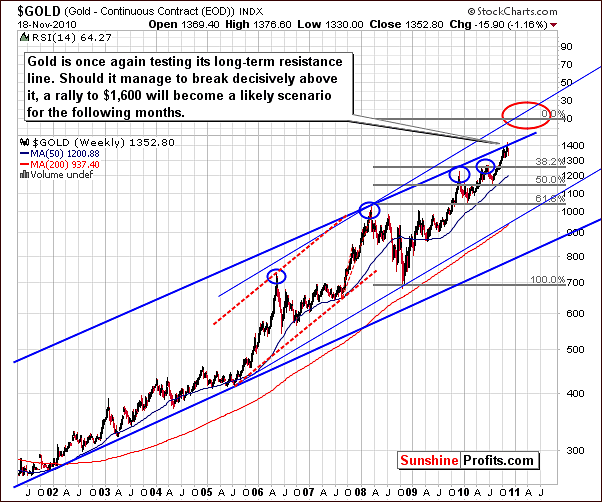
In the very long-term chart this week, we see that gold has not moved above the upper border of the very long-term trading channel. As we have stated in previous updates, this is an important resistance level. It was likely that some consolidation will be seen in the near-term so this should not be of any great concern as it is quite a natural phenomenon.
The important point is that our next target level, after moving above the trading channel will be close to $1,600. This target has been arrived at by utilizing two technical tools. One is the upper border of the accelerated trading channel and the second is extrapolation made my applying the 1.618 phi (φ) number. Both tools indicate a likely move to the $1,600 level perhaps in the first quarter of 2011.
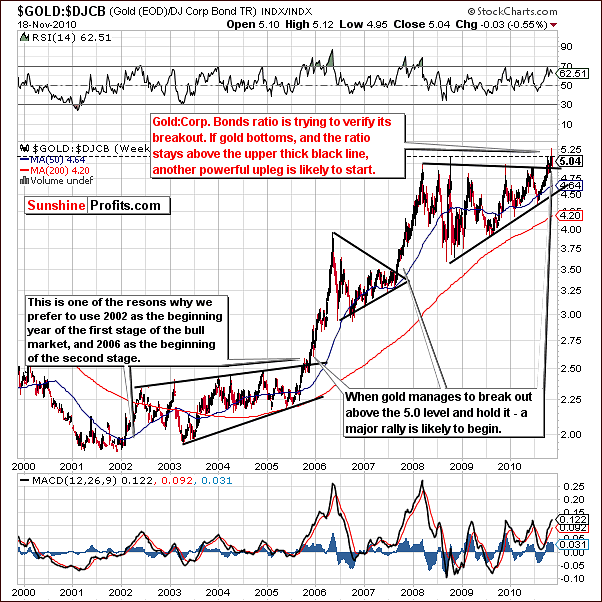
Our second gold chart this week looks at gold vs. corporate bonds. Clear trends have been seen in the past and for this reason we are including this chart as yet another perspective in analyzing gold’s current trends. Previous consolidation periods and breakouts have been followed by strong rallies with very sharp increases seen after the breakout occurs. This chart clearly allows you to separate the consolidation phase from the big rallies. Additionally, once the breakout is seen, the rally takes gold quickly higher. It seems that this may indeed be happening now. Such a move can be seen near the 5.04 Thursday closing level.
In previous updates we have stated that if this index level holds above 5.0, a major rally is quite likely. What we have seen in recent days is, even with slight corrections and taking intra-day highs into account, this level has indeed held. The small consolidation seen immediately after a breakout is quite normal, and should not be viewed as bearish.
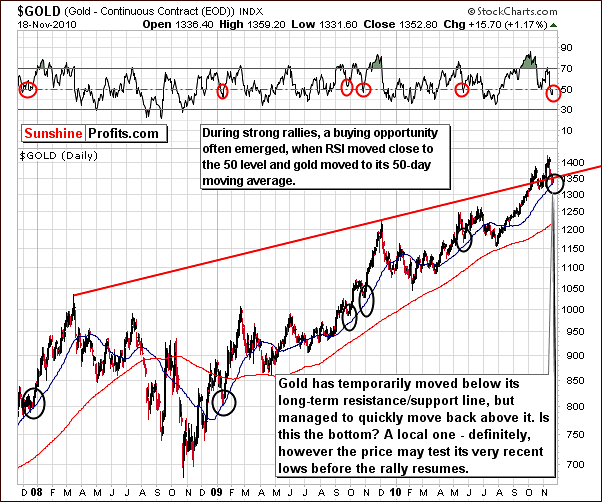
We now turn to gold from a USD perspective in this week’s long-term chart. A first observation is that a move was seen below the long-term support level followed by a move back to it. This could be either a retest of a breakdown or a breakdown, which has not been verified. It is likely that the former is true as we have only seen two days below the support level. Normally, at least a three-day period is needed to verify a breakdown.
Above the price chart, we can see that the RSI is slightly below the 50-level. In the past, when this has coincided with gold’s price near the 50-day moving average during a big upswing (as is the case today), the local bottom has been in. This analysis prompted our Market Alert this week as we suggested that it appeared investor’s long-term capital should be back into the gold market.
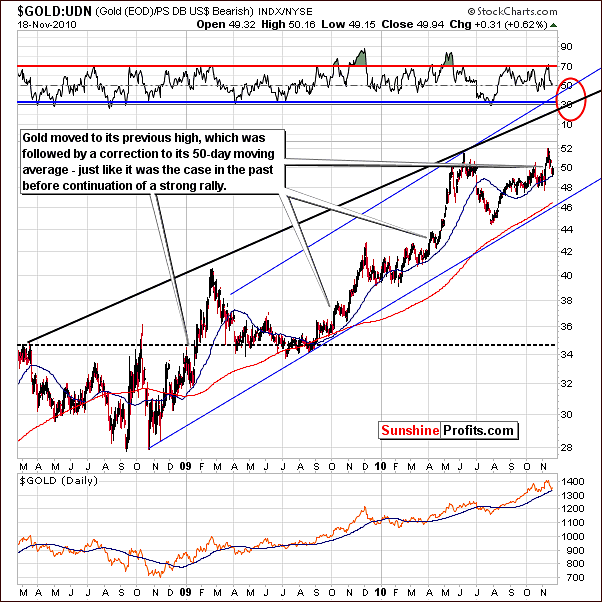
We now look at gold from a non-USD perspective, which analyzes gold’s average price in other currencies worldwide. Historically, this view has been useful in verifying gold’s price movement in that the influence in the US dollar trends can be set aside to some extent.
The 50-day moving average is an important tool in this chart as well. Normally, and especially for the past several months at least, this average has been an important support level. We’ve recently seen a move back to the 49-level along with an RSI close to 50 as in the USD chart. Taking these points into account, the outlook for gold appears bullish for the medium term.
Although some sideways movement may be seen for a short time and, in fact, gold’s price may decline slightly from a USD perspective, the probable redundant trend remains up. Much higher levels appear likely, as indicated by the red ellipse in our chart. The $1,600 USD price level will likely bring gold much higher from a non-USD perspective as well.
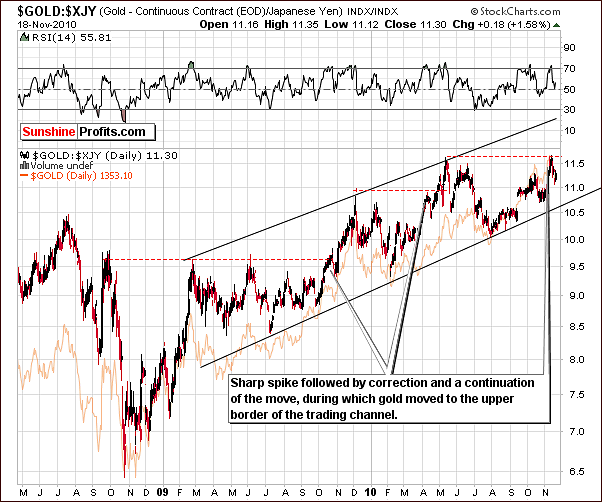
Another perspective is to look at gold in terms of the Japanese yen. Quite often, quick sharp spikes are seen followed by just as sharp moves up. This is quite characteristic of this perspective and we've seen similar patterns in the past - it meant a consolidation during a bigger rally. That could be the case also today. A likely move will be to points above the upper border of the long-term trading channel, much higher than levels seen today.
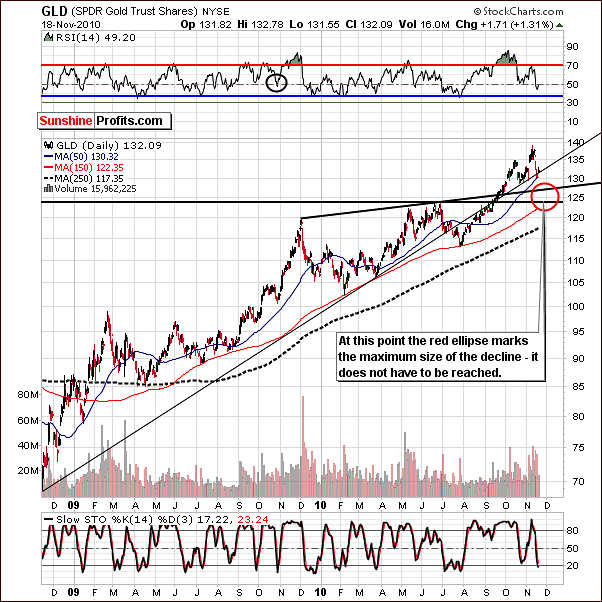
We now return to a view of gold from a USD perspective in another long-term chart. Here we will analyze the possible downside that this rally might have. Several support lines are currently in close proximity to today’s price level and it’s likely that the first of these will hold. Therefore, it seems that any price decline will likely be quite small and is illustrated in the chart by the target of $127 or so in the GLD ETF ($1,300 in spot gold). Please note that the probable outcome is not that the metals would move lower from here right away. Instead, gold could rally toward $1,380 and after that decline once again. Either way, the area marked with the red ellipse is likely to stop any declines seen in the following weeks.
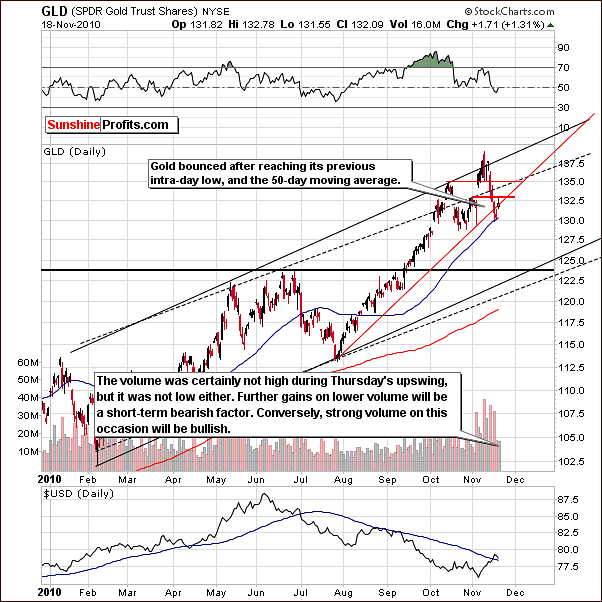
This week’s final gold chart is the SPDR Gold Trust Shares ETF. This chart provides a useful analysis of volume levels. Since levels seen in recent days have been somewhat average, the implications from the volume levels themselves are inconclusive to some extent at this time.
We will continue to watch volume levels for the next few days and this could be quite informative. For example, if a move toward the 135 level ($1,380 for spot gold) is seen accompanied with very low volume, a short-term decline will be quite likely. However, if prices rise on huge volume, it would indicate that the rally has likely resumed immediately. As always, we will keep our Subscribers informed, providing additional analysis as required especially if indications are that a decline appears imminent.
Summing up, gold appears to be correcting within a bigger rally, which appears to be headed to the $1,600 level. The question today is whether or not this correction is over. It appears at this time that at least the first part of the correction has completed and we may have possibly seen the final bottom. If not - then the downside appears to be limited from the long-term investor's perspective. The next several days will provide conclusive information to this point and yield much information as to where gold’s price will go from here. The next two weeks or so are somewhat unclear at this point but we remain bullish as we look out several months and into 2011.
Silver
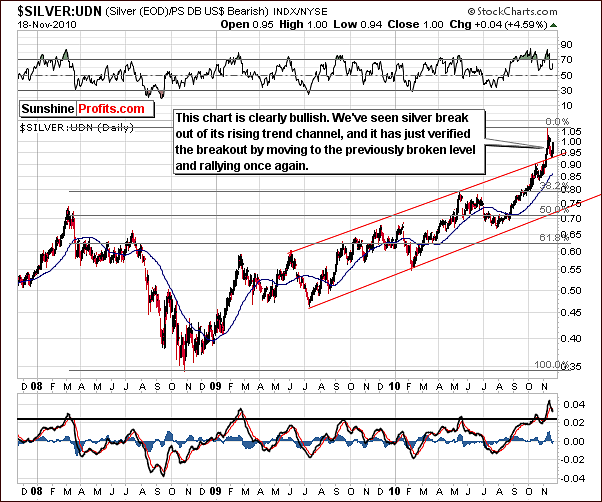
We begin our look at silver this week with the non-USD chart. It is clear that silver has broken out above the rising trend channel in a profound and decisive fashion here. True to its historical volatility, a sharp decline followed the breakout but stopped when silver touched the upper border of the rising trend channel. Keep in mind this is from a non-USD perspective and is based on a long-term channel.
At this time there has been a verification of support. Silver’s price is again on the rise and the breakout has been verified. These are very bullish indicators but it is prudent to always keep in mind that the white metal’s volatility does generally increase risk to some degree.
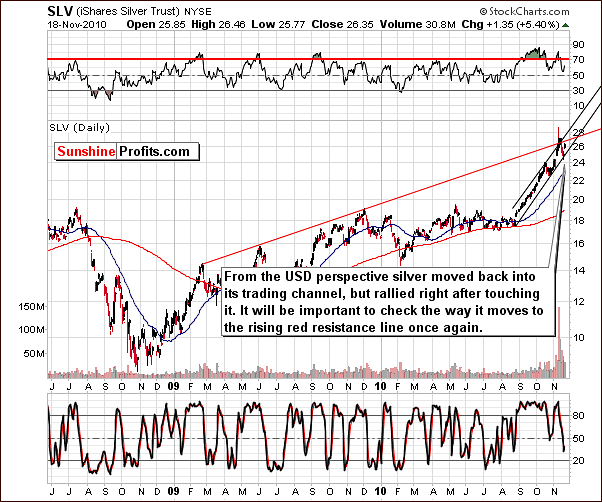
The long-term USD silver chart this week reveals that silver’s price did not move above the rising resistance line. A recent decline however was stopped by a significant support level, the lower border of the rising trend channel. This support level is based on short-term price movement beginning in late August and carrying through today. After reaching the support level, silver bounced back with vengeance.
The critical question now is how silver will perform and how it will approach the rising red resistance line in our chart. If a breakout above this line on strong volume is seen, it is likely that significant gains will follow. However, if the resistance line holds and prices decline, a short consolidation phase is likely before further price level increases are seen. Indications are bullish for the short-term but we must continue to monitor silver, as there is still the possibility that we have not yet seen the final bottom of this consolidation period.
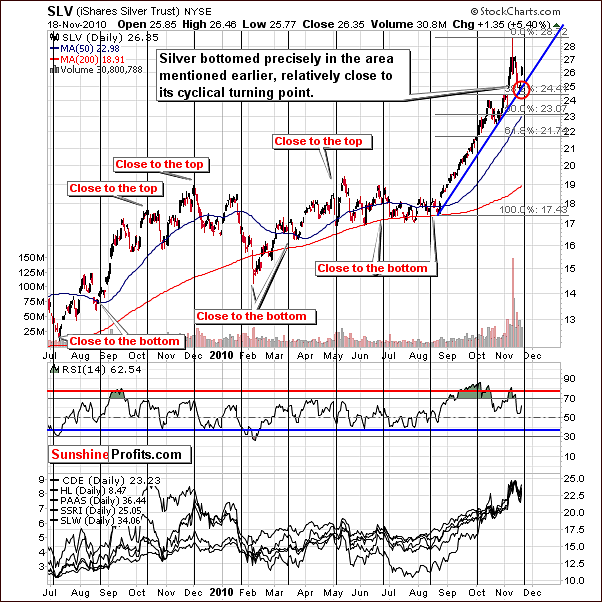
In the short-term chart, we clearly see that silver reached a local bottom precisely as expected and did so quite close to the cyclical turning point. This increases the probability that the bottom is in but once again we must keep in mind silver’s unpredictability.
Summing up, the general outlook is quite bullish for silver, especially when taking into account silver's strength shown on Thursday when its gains surpassed that of gold or mining stocks. However, its unpredictability must be acknowledged and the exact timing of its price moves often remains difficult. For this reason, the possibility that another bottom could soon be seen must be kept in mind and the situation requires monitoring on an ongoing basis - with gold and mining stocks in mind as well, as these markets often confirm each other's moves. We will remain up to this task and pledge to keep our Subscribers informed as such situations develop.
Speaking of mining stocks, let's take a look at the XAU Index chart.
Mining Stocks
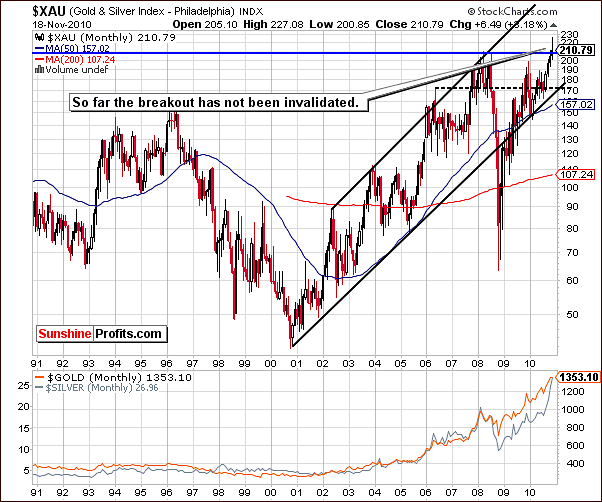
This week’s XAU Gold/Silver Index chart reveals that index levels have moved above previous highs and the breakout is presently being tested. Although not yet validated, this is a significant development, as the index values have been in place for a couple of days. Therefore the situation appears to be bullish. It seems unlikely that this trend will reverse.
Looking back to 2005, a very similar trend can be seen. At that time (in the final months of 2005), the index moved to the level of the previous highs, declined and then moved up significantly. It seems quite possible that today’s trend will follow this very pattern. We will continue to monitor this situation closely and utilize our Market Alert capabilities when warranted.
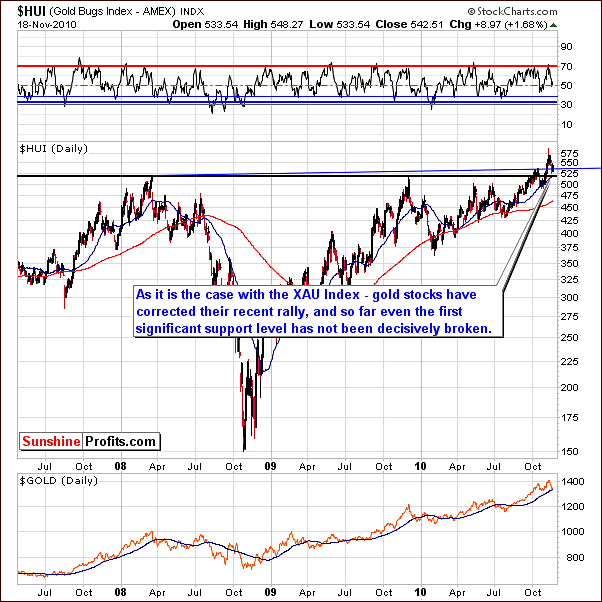
The HUI Index serves as a proxy for gold stocks, and on the above chart we have confirmation of points made earlier in this update. The rally here is significant and the breakout is being verified. Two important resistance lines are being tested as support. So far the first support line was not decisively broken. We've seen intra-day moves below it, but finally the HUI index levels are now above it. This is a bullish indication for mining stocks going forward.
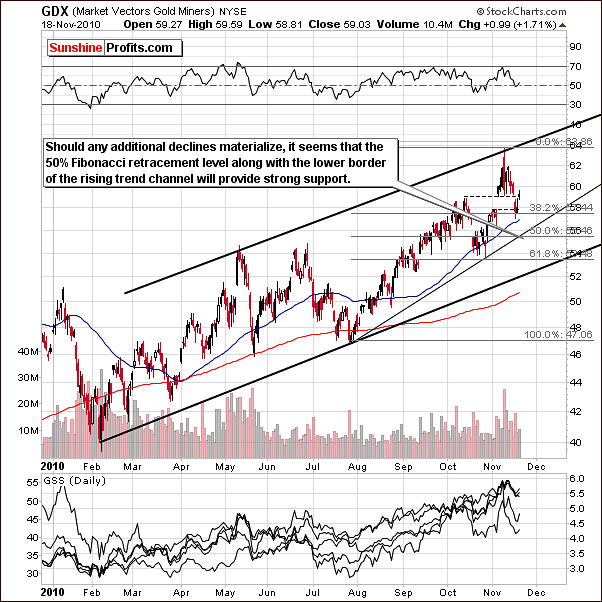
The GDX ETF shows that recent increases have been accompanied by relatively low volume. This is normally a bearish signal, but given the situation generally in precious metals markets, it seems likely that this trend could change in the days ahead and bullish indications could appear. For this reason, we will monitor volume levels as they will likely provide much information, as was the case with the GLD ETF - if they are sustained for a few more days.
Should a decline be seen here, it is likely to fall no further that the 50% retracement level, which is slightly below $56. Since this level is not significantly below where we are today, it should not be of real concern for the long-term. The downside is quite small and furthermore, the overbought levels seen last week are no longer in place.
Summing up, the long-term chart for mining stocks is of utmost importance this week. It provides bullish sentiment although the short-term is somewhat unclear at this time. There is some question as to whether the bottom has been reached but in all likelihood, mining stocks will trend upward in much the same manner as we envision for gold and silver. Long positions appear justified at this time. We will continue to watch for any bearish signals and report to our Subscribers when warranted.
Sunshine Profits' Indicators
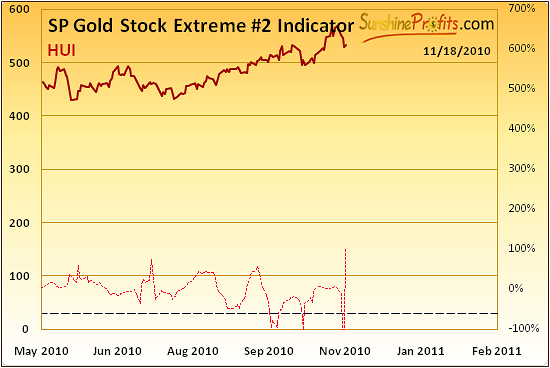
This week’s Sunshine Profits Gold Stock Extreme #2 Indicator flashed an extreme signal. The implication is that the local bottom has likely been reached taking previous declines into account. This further confirms the validity of our Market Alert issued earlier this week, in which we stated that higher values for precious metals were likely.
Letters from Subscribers
This week one of the most common questions we've found in our inbox was about implosion of the bond market and if it could take gold, silver and mining stocks substantially lower.
Let's begin with an approximate definition of a bond. It's a paper promise of A to pay B a given amount of paper money. With the bond markets falling apart, the trust in the paper (fiat) dollars (and other currencies as well) would deteriorate. Where would people turn to in times of such a dramatic events? Especially, with no bonds to be considered as a "safe haven"? Most likely this would be to the place they have always turned to throughout the history in case of financial turmoil - precious metals. Consequently, we would not be afraid of this type of financial meltdown to hurt metals in the meaningful way. Still, as mentioned last week - we strongly suggest owning the physical metal instead of "unallocated, pooled" etc. gold. Please read the letters section in the previous update, or go through the Key Principles section for details.
Now, we would like to answer the question about GSC (TSX) which has declined in price substantially. Our Subscriber wanted to add to his position if he could reasonably determine the cause of the decline.
The problem with Golden Star (GSS or GSC.TO) is that its price share is often influenced by factors other than the price of the metals and things like that can (and most likely will) happen. It is not possible for anyone to know all the details regarding all the companies, but that doesn't prevent you from including only the best gold and silver stocks in your portfolio. While you cannot know all the details yourself, you can check how other investors assess this company. If markets are rational in the long run, then all we need to do is isolate the required information from the random price moves; after all, each of them is caused by investors' decisions.
The point is that GSS has a low value of the R-square coefficient, which is another way of saying that its exposure to the price of gold is relatively low. It is very bad from the long-term perspective, not too good from the medium-term perspective (out of the top 10 stocks it has the lowest R-square value), and again the situation is very bad from the short-term perspective. The short-term value is being influenced by the very late move down, but the overall tendency holds. Golden Star is certainly not our first choice when it comes to selecting gold and silver stocks. Consequently, we believe that one should switch from GSS to other stocks.
So now, the question is “which ones?” That depends on the type of investment that you're planning to make - different stocks are applicable for different time frames. Be sure to check our Leverage Calculators and choose stocks from the top of the ranking that have high R-square value (generally you should be fine with stocks, whose R-square value is greater than 70%). Hope this clears up some of your questions and leads you to greater profits.
Summary
The USD Index is likely close to a local top. Stocks are verifying a breakout above the declining resistance level and declines are quite possible in the near-term. Precious metals have been given some momentum and should have a positive trend even if stocks consolidate somewhat. T volume analysis in the coming days will clarify the likelihood of an immediate big rally.
Suggestions made in this week’s Market Alert remain valid. Precious metals and mining stocks are likely to move higher and small amounts of speculative capital could be utilized for the short term even though a re-test of the previous lows is not out of the question.
Long-term positions should be re-entered for those who moved out of this sector and have not employed their capital back in the market. It is strongly advised that the Leverage Calculators found in our tools section be utilized for those wishing to add gold- or silver mining stocks to their portfolios. After all, these tools were designed to steer Investors in the direction that best fits their goals.
A note about next week
Many important markets will be closed for Thanksgiving and the day after (or the trading will end sooner) and thus the trading week will be quite short. We will therefore not publish our regular Premium Update next week but will issue a short summary on Wednesday as well as utilize our Market Alert capability if needed.
This completes this week's Premium Update.
Thank you for using the Premium Service. Have a great weekend and profitable week!
Sincerely,
Przemyslaw Radomski

