
Vindication is sweet. Die hard gold advocates have been considered either lunatics or misguided zealots clinging to a barbarous relic.
But with the spiraling price of gold and the frequent news coverage, gold has begun to lose some of its disreputable edge and gain legitimate luster. We are no longer laughed at.
But now it's official. The yellow metal has gotten the golden seal of approval. This week none other than the President of the World Bank said leading economies should consider readopting a modified global gold standard to guide currency movements. This is a surprising reversal of 40 years of official economic thinking.
Gold touched a high of $1,424 an ounce on Tuesday, although the price remains well below the peak of the early 1980s once inflation is taken into account.
Writing in the Financial Times, Robert Zoellick, the bank's president since 2007, says we need a successor to what he calls the "Bretton Woods II" system of floating currencies.
To remind you, established in 1944 and named after the New Hampshire town where the agreements were drawn up, the Bretton Woods system created an international basis for exchanging one currency for another. It also led to the creation of the International Monetary Fund (IMF) and the World Bank.
In an effort to free international trade and fund postwar reconstruction, the member states agreed to fix their exchange rates by tying their currencies to the U.S. dollar. American politicians assured the rest of the world that the dollar was dependable by linking it to gold at $35 an ounce. Nations also agreed to buy and sell U.S. dollars to keep their currencies within 1% of the fixed rate
The Bretton Woods system collapsed in 1971 when President Richard Nixon severed the link between the dollar and gold in order to prevent a run on Fort Knox, which contained only a third of the gold bullion necessary to cover the amount of dollars in foreign hands. By 1973, most major world economies had allowed their currencies to float freely against the dollar. What followed was a transition period marked by plummeting stock prices, higher oil prices, bank failures and inflation.
Writing just ahead of the G20 meeting that took place this week in Seoul, Zoellick calls for a system that is likely to need to involve the dollar, the euro, the yen, the pound and a renminbi that moves towards internationalization and then an open capital account. The system should also consider employing gold as an international reference point of market expectations about inflation, deflation and future currency values. Although textbooks may view gold as old money, markets are using gold as an alternative monetary asset today.
Zoellick is not exactly calling for currencies to be backed by hard assets again and what he is proposing seems vague, but it seems like this idea of using gold as fixed reference point is a small step in that direction.
The press has seized on his gold comment with front-page banner headlines even though Zoellick mentioned gold almost in passing as his fifth and last proposal. The other items he advocated were an agenda of structural reforms to reduce imbalances; major economies should agree not to intervene in the currency markets; the US needs to tackle its deficit; China needs to become less export-dependent and emerging markets need to make their own currency policies more flexible.
But the world press has ignored those items focusing instead on his statement about gold.
What can we say? Gold is sexy.
A few days later Zoellick clarified his position on gold in a CNBC interview saying that he had been misunderstood and that he is not in favor of returning to the gold standard. However, he said, gold is the "elephant in the room" that must be addressed by policymakers. It's being used as an alternative monetary asset because of unease about the strength of developed economies.
What "the price of gold has been telling people is that there is a lack of confidence in some of the fundamentals growth policies," Zoellick said.
What we find interesting is that a figure of the stature of the president of the World Bank is saying on the record that gold could play some role in a new global currency system. Gold is being spoken about in high places. This underscores an obvious need for discussions on monetary reforms at the highest levels.
Zoellick's views reflect the discomfort that exists with the international system, where China's intervention to hold down the renminbi is blamed by the US and others for contributing to global account imbalances. There is also a growing loss of confidence primarily in the U.S. dollar whose value is expected to fall, especially in the light of the Fed's QE2.
Doubts about the overall monetary system are being felt at all levels. Investors worry that the Fed's move last week to pump $600 billion into the nation's banking system, as well as a surge in borrowing around the world, will undermine paper currencies, making gold a refuge once again.
Over the last two months, the dollar has declined 6 percent against its principal peers, but gold has jumped 17 percent.
The Fed's decision has met with sharp criticism from several of America's crucial trading partners, including Germany, China and Brazil.
They say flooding the world with unwanted capital at a time when their own economies are already growing increases the chances for future inflation while encouraging one country after another to devalue its currency.
Germany's finance minister this week criticized the US Federal Reserve's decision to pump an extra $600bn into financial markets "It is not consistent when the Americans accuse the Chinese of exchange rate manipulation and then steer the dollar exchange rate artificially lower with the help of their [central bank's] printing press," he said.
Could the world go back to a gold standard? Although there have been occasional calls for a return to using gold as an anchor for currency values, most policymakers and economists regard the idea as liable to lead to overly tight monetary policy with growth and unemployment taking the brunt of economic shocks.
Gold standard or not, the long-term future of gold looks good. To see what the short term future holds let's begin take with an analysis of the USD Index (charts courtesy of http://stockcharts.com.)
USD Index
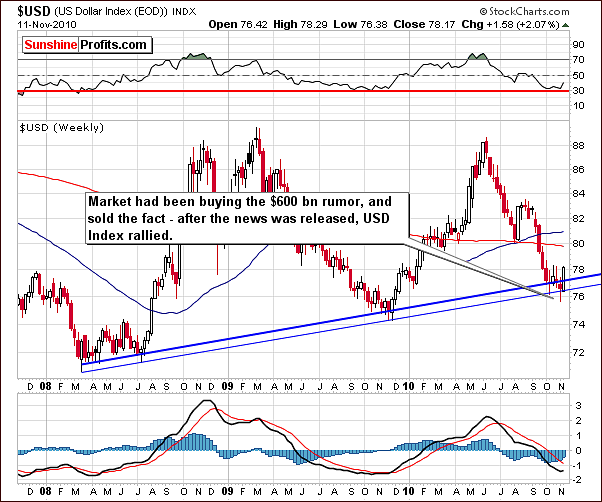
Once again we begin this week's Premium Update with the long-term USD Index chart. The quantitative easing step taken last week seems to have had the opposite effect on the USD Index when compared to what one might have expected. One theory is that there is a belief other currencies will follow and the currency war will gain intensity. Another thought is that since the step was widely publicized, markets had already reacted prior to the actual official announcement.
The dollar rose sharply this week and precious metals showed significant strength by declining only slightly. The USD Index decline appears to be over for now, however further effects of the QE2 move may still have surprising influences in the weeks ahead.
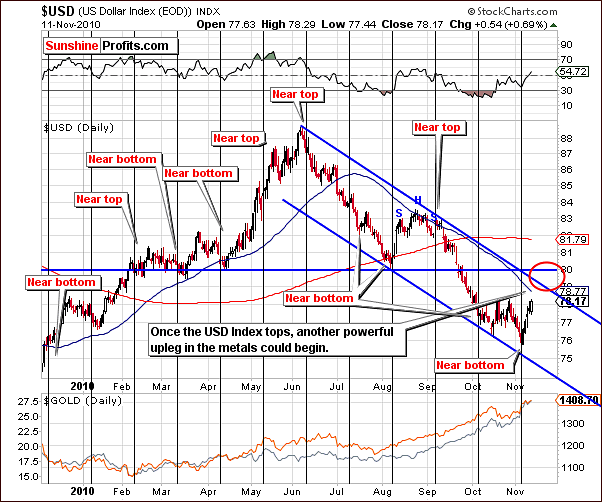
The short-term chart this week shows that the dollar reached a local bottom precisely at the cyclical turning point. This was also the case last August. Since this rally has been ongoing, gold, silver and mining stocks saw their rally end but prices did not plunge - consequently, once the USD does decline, the rally in the metals could be resumed. The area marked with the red ellipse on the above chart includes what we believe to be the next local top for the USD Index.
Summing up, the USD Index is relatively close to its local top and therefore a local bottom should be seen soon for precious metals. This may very well provide a good buying opportunity for investors in gold, silver, and mining stocks.
General Stock Market
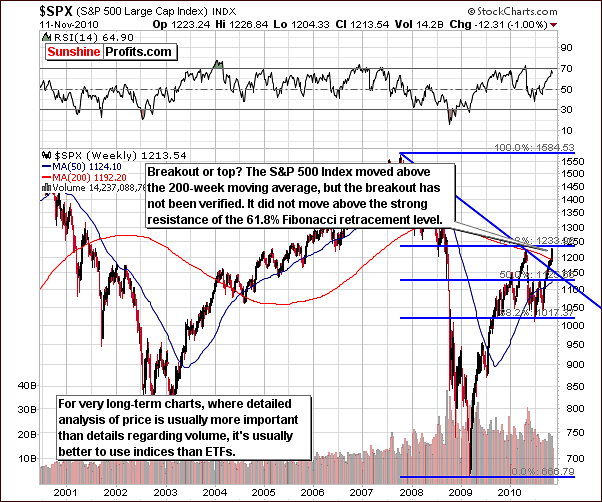
In this week's long-term general stock market chart, we see that the key 61.8% Fibonacci retracement level has still not been surpassed. This is noteworthy and could impact how quickly stocks move higher from here. Once stocks break out decisively above this level, gold, silver, and - especially - mining stocks are likely to shine. Not much more is seen in this chart but our analysis will continue with the short-term chart.
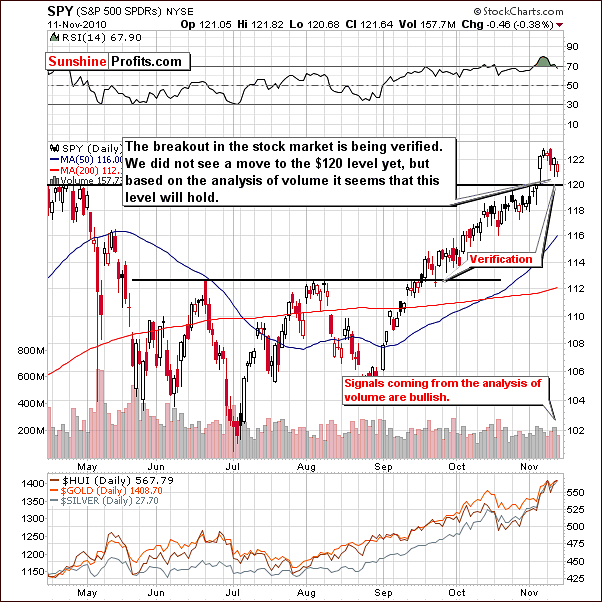
The short-term chart this week shows that volume levels have been relatively low after the $120 level was surpassed. Low volume has accompanied small declines back towards this level although the $120 level has not yet been reached on the downswing. At the same time, the volume was higher during the daily upswing on Wednesday. This leads us to be bullish at this time. Further consolidation is possible but it is likely that the $120 level will hold and provide support.
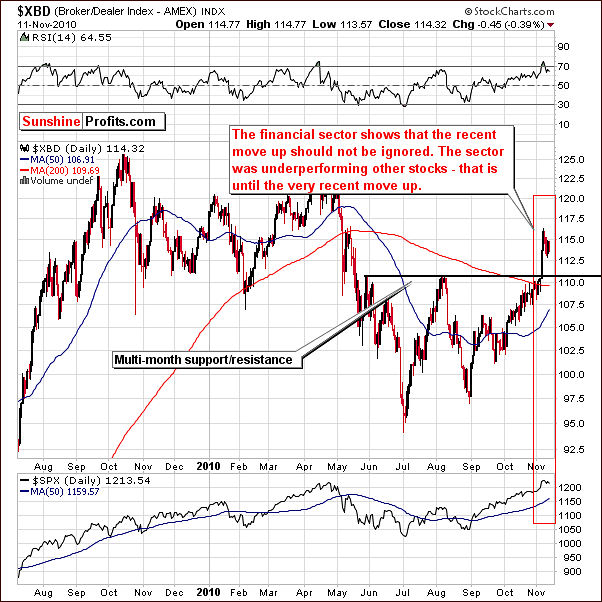
The Broker Dealer Index chart, which measures the strength of the financial sector, further confirms that the next big move will likely be to the upside. This index often leads stocks and until the very recent rally, it pointed to a move lower. The latest move up has been huge and should not be ignored. Perhaps this is an indication that stocks too will go significantly higher.
Summing up, stocks have rallied strongly of late and appear poised to continue this trend. The QE2 actions appear to have been well received in equity markets world-wide leading to higher stock prices. Volume levels and the Broker Dealer Index both provide a bullish signs for stocks in general. The implications are bullish for the precious metals sector, however since the $120 level has not been reached yet, the consolidation may continue for a few more days or even a week or two.
Correlation Matrix
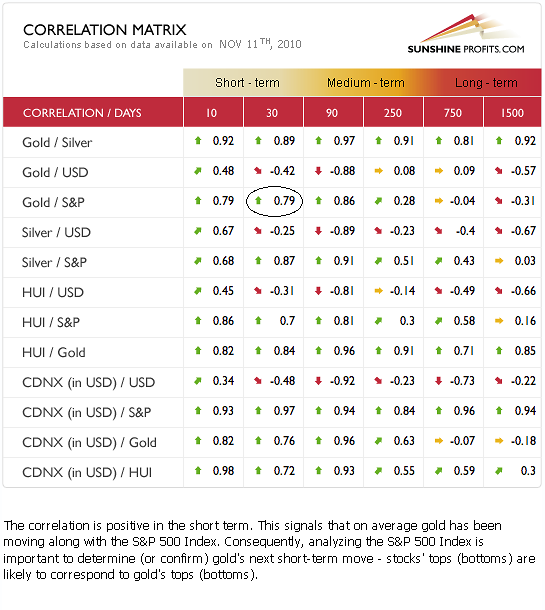
This week we unveil the new, interactive version of our correlation matrix. What you can see here is only a static screenshot, but when you check it out directly in the tools section, and put your cursor over virtually anything within the table, a description will appear at the bottom. An explanation providing definition, importance and implications of each value should make the matrix much more useful than it currently is. That's right - the description changes dynamically, which means that it tells you implications of a particular value of a given coefficient.
Basically, this version of the matrix now tells you implications of the given coefficient instead of showing only the raw number. As you can see we have added also the time horizon (of course you can hover the mouse above it for more details) above the table to further explain the usefulness of given coefficients.
One might have noticed that we had put the circle around the correlation coefficient between the gold and the general stock market in 30 days column. This is because we wanted to indicate that the description visible below the table comes exactly from this field. Please note that if the value of the coefficient was much different (for instance it would amount to 0.2 or so), we would display a different comment below the table. It took a lot of work to cover all cases for all pairs of assets for all terms (columns) (it's about 800 combinations that can be displayed), but we believe it was worth it.
Moving to the analysis itself - precious metals continue to be negatively correlated with the USD Index, although to a lesser extent. Gold, silver and mining stocks have held much of their recent gains even as the dollar rallied. It appears that metals have been moving in tune with the general stock market more so than against the dollar and it seems that watching the stocks has become more important recently for precious metals Investors. Consequently, another strong rally appears likely for the metals sector, but a breather first appears likely as well.
Gold
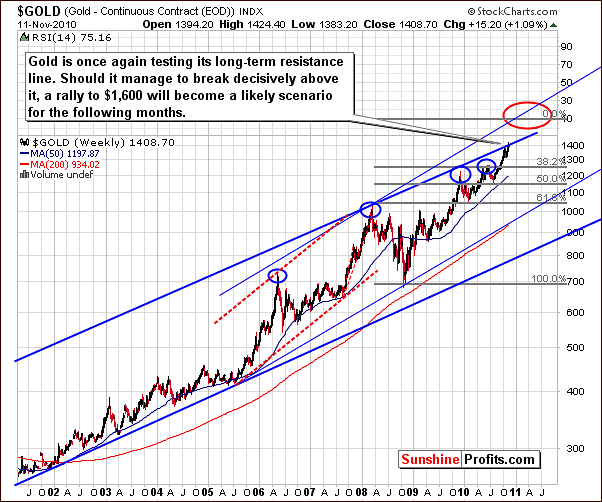
At first glance, gold seems to be heading up with no limit in sight but a closer inspection of recent moves shows that no breakout has been seen yet. On this chart we can see that the gold's price has moved slightly above the upper border of the long-term trading channel created by the recent bull market. However, zooming in more closely (big chart on high resolution screen), we can see that gold has actually touched the trading channel and then moved lower but it is clear that no breakout has been seen.
The target level for gold's next rally has been moved up to $1,600 using the phi factor of 1.618 and new trading channel (marked with thin blue lines) to obtain this estimate. Once a breakout is seen, a big rally is quite likely. It is important to note here that this may not be immediate.
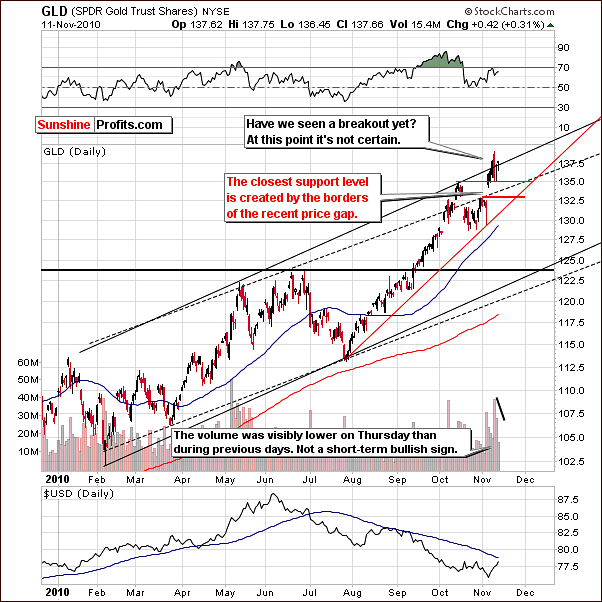
As is often the case, we look to the short-term chart this week for additional details concerning gold's current rally. We can see that the intra-day high, which prompted our Market Alert on Tuesday. Gold's price did not moved decisively above the short-term trading channel. Only gold stocks moved above the key resistance lines, but we will get back to this part of the precious metals sector in the following part of the update.
Gold did not have a significant volume accompanying Thursday's rally when compared to recent moves. In fact, the volume was the lowest seen in a week. Taking this into account, it seems that gold may take a breather before its next powerful rally. Support levels indicated in red have been created from a price gap, which was seen two weeks ago and these will likely hold should any slight correction be seen during the expected breather period.
In the days ahead, we will be watching for low volume on declining days or high volume when gold's price rises. It could be a good bet at this time to open a long, leveraged position but no clear buy signals have yet been seen.
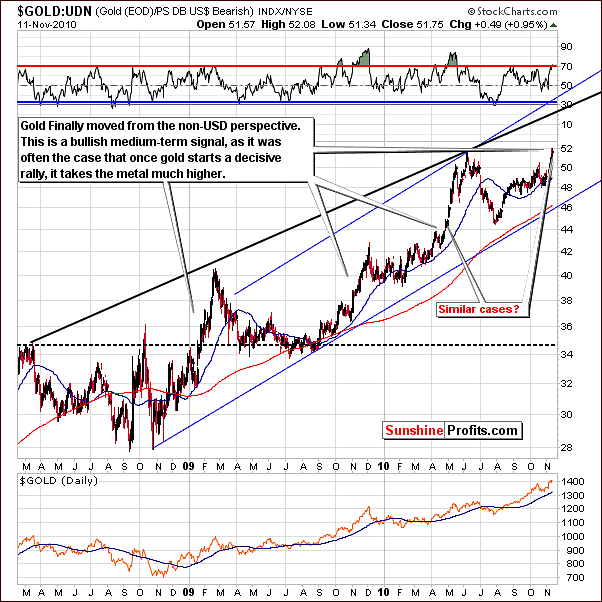
From a non-USD perspective, the signals are long-term bullish but short-term cautious. The patterns for several years have been somewhat predictable as a period of very strong rally is regularly followed by a lengthy period of consolidation or sideways movement. This was seen from the late 2008 to the middle of 2009, again late last year and also in mid-2010. Perhaps both of the upper borders in our chart could be reached in the near future but this is not at all a certainty at this point, merely a possibility.
A small consolidation from a non-USD perspective may correspond to a similar trend on the USD side. At this time for non-USD investors it seems best to hold long-term positions and enter small speculative positions right away. The reason we feel that speculative positions can be taken ahead of the correction is two-fold. First, the timing of any correction is quite difficult to pinpoint as the precious metals stopped responding to USD rallies, and secondly, the correction appears as though it will likely be quite small. Furthermore, the rally, which will likely follow could last for several months, thus making any small price decline which was missed insignificant.
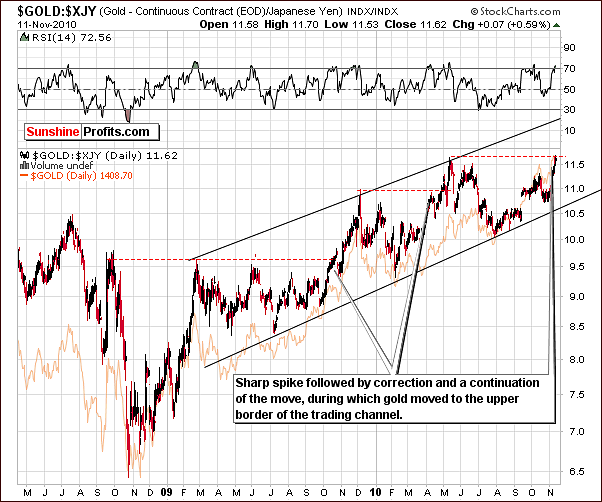
Additional confirmation comes from the GOLD:XJY ratio chart (which is another way of saying that it features price of gold in yen) where we can see that gold has moved to previous high levels and could again repeat previous trends with a move to the upper border of the two-year trading channel. However, there seems to be a relatively big probability of a quick correction from a yen perspective as such action was seen in the past when gold moved to its previous highs - from the yen perspective that is.
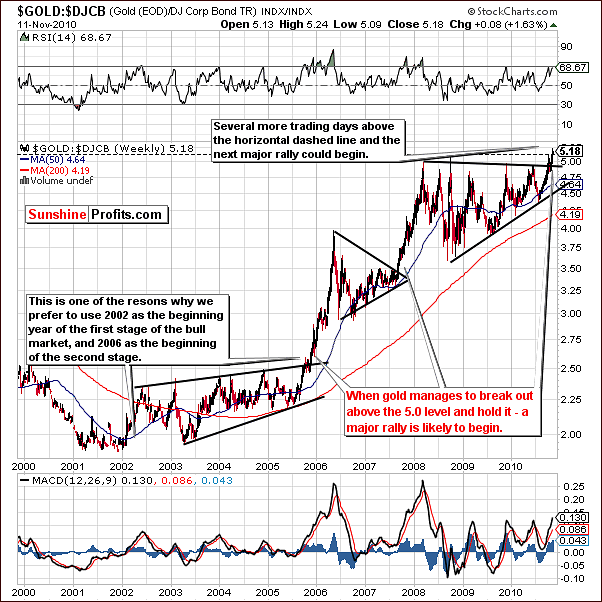
The Gold:DJCB ratio (explains which was better investment: gold or corporate bonds - there is no doubt that gold wins in this comparison) chart, which we have used on occasion in previous updates confirms that gold's rally has likely not ended. Judging from what was seen in 2006 and 2008, when the breakout finally occurs, the rally will likely be spectacular. It seems at this time there is a good possibility that 2011 will mirror these rallies of the past. Gold could very well move above its previous highs. Confirmation of a breakout has yet to be seen, but once we see that, a strong rally is likely to follow.
Summing up, no breakout has been seen as of yet. New highs have been reached, but the long-term trading channel has not been surpassed decisively. This is a fact, which should not be ignored.
Should a decisive breakout occur, gold's price is likely to move towards the $1,600 level. This may, however, take some time so we advise holding one's physical gold and silver positions at this time and maintain approximately 75% of long-term holdings here. It seems best to wait and see for a bit with the remaining 25%. If the breakout is seen, a move to the long side will likely be the best choice and if gold corrects, speculative positions could then be taken at more attractive lower price levels. Either way, exciting times seem to be on the horizon for gold Investors and Traders alike.
Silver
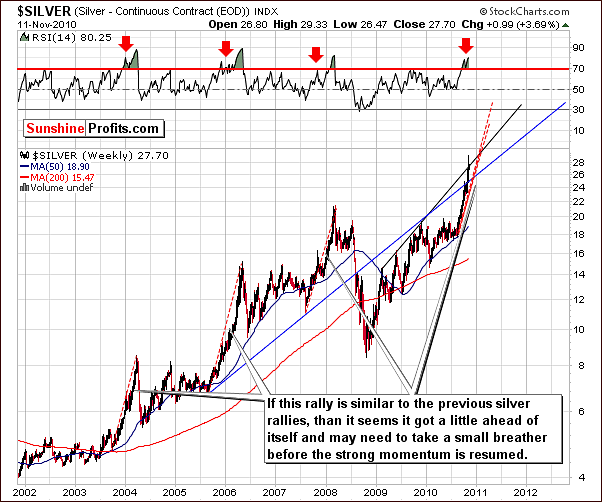
Our first very long-term chart for silver is useful for comparing similar strong rallies over the years for the white metal. It allows us to see the size and pace of past trends and this is quite useful in analyzing current developments. By extrapolating from these prior patterns, we can now profess that silver maybe somewhat ahead of itself. The red, dashed lines have been used to show you how this rally would look like if it was like the previous ones. If this is indeed the case, a period of correction will likely be seen before silver moves even higher.
Ideally a steadier pace is preferred. Silver's volatility frequently leads to situations such as we see today. RSI levels and weekly closing prices confirm the premise that a pause is quite likely very soon as several past trends similar to recent price and volume moves have followed this path. The likelihood is that the local top is quite close and some consolidation will be beneficial to a further rally, which could take silver to new highs.
The white metal recently tried to breakout above the rising trend channel and failed. This leads us to believe that a pullback is possible as the current move above this level has not yet been verified. When historical data is analyzed in conjunction with this current development, a strong case is made for a period of consolidation to follow soon.
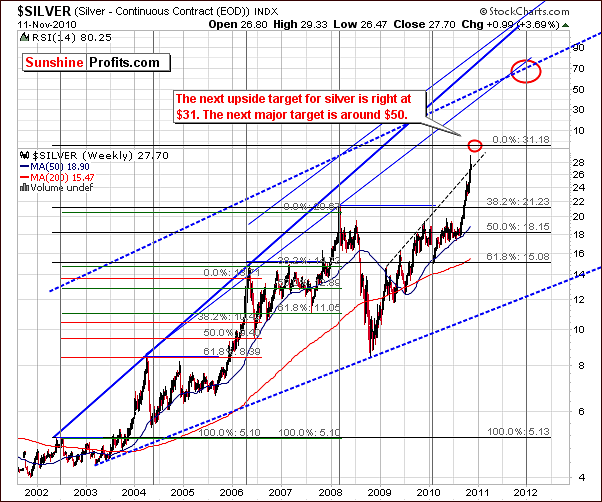
We have decided this week to use a second very long-term chart for silver to give additional insight and deal with the "how high can silver go" question.
Based on the extrapolation of the previous highs we see here that the next target level for silver could be above $31. Once the likely consolidation we mentioned above has completed, this level does indeed seem attainable as the next local top. As always, other markets and especially gold should be watched closely as they normally affect silver to a great extent. For instance, should gold move to $1,480 or so while silver moves to $31, it will be likely that silver would move even higher, however with gold at $1,600 and silver at $31, the top would most likely be in.

From a non-USD perspective, we have employed the 1.618 Phi factor to the silver's 2008 bottom and 2010 top. The implication drawn from this exercise is that it appears we are at a local top presently and therefore a correction might be due.
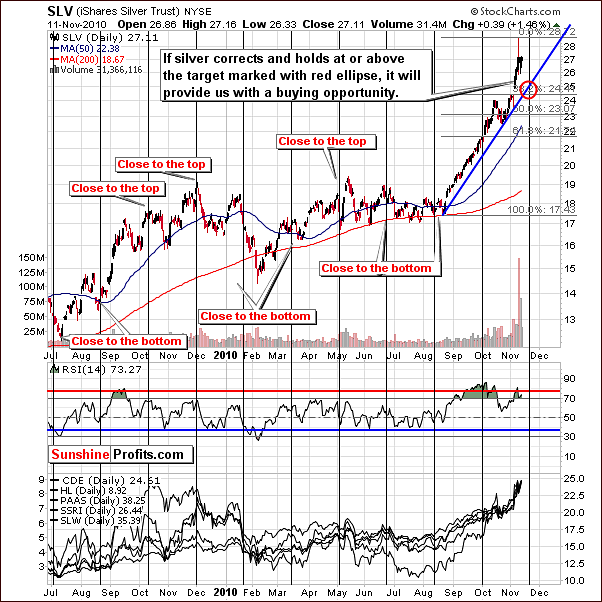
A review of our short-term chart this week reminds us of silver's unpredictability. As always, Subscribers are advised to look at other markets, as their influence on silver can be the key point to determining white metal's next move. Because silver reacts so quickly and strongly to these outside influences, volatility is something, which must be tolerated by those who look to profit in silver over the long-term. Still, those of you, who followed our suggestion from the April 2nd 2010 Premium Update and increased their physical bullion holdings (including silver), are most likely happy that they did.
Concerning the likely correction discussed earlier in this week's update, if silver's price holds at or above the $24 level and the decline is accompanied by low volume; a bounce will likely be seen. This would probably mean the bottom is in and further strength will follow in the subsequent rally. We will keep our Subscribers updated immediately as the situation unfolds.
Summing up, silver is likely to move higher but probably not right away. It appears to be somewhat ahead of itself meaning that it has rallied too fast and seems to need a pause or consolidation to recharge. The rally, which follows such a pause will likely be strong and take the white metal above the $30 level.
The next important target level for silver appears to be around $50 but will probably not be reached until late 2011 at the earliest. Of course this does make silver an attractive investment at this time but it should be noted that a small short-term correction of perhaps 10% is probable very soon. Should the situation change and silver continue to rally, convincing us to be bullish for the short-term, we will update our expectations and issue a Market Alert.
Mining Stocks
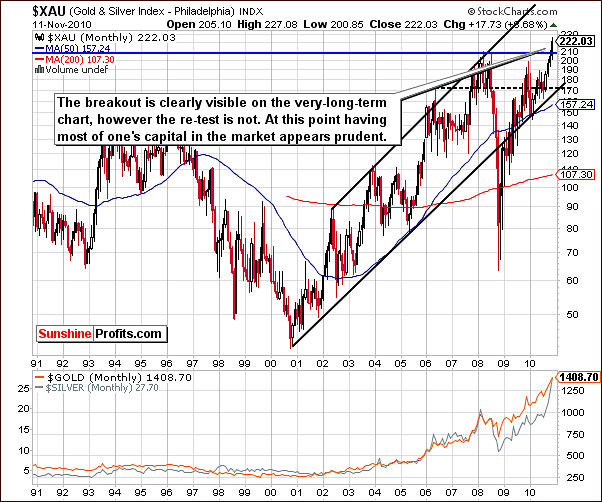
A breakout has been seen in the XAU gold-silver stock index. As we have mentioned in previous updates, mining stocks are likely to begin to outperform the metals themselves very soon. This breakout does need to be verified and retested on a weekly basis. A move down even to the 209-level or lower would be fine since the index has been above such levels for quite a while. A big move higher is expected after the breakout is verified.
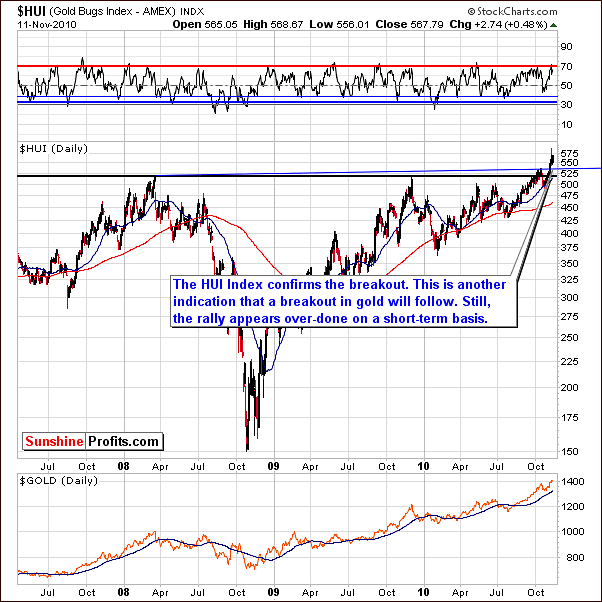
The same situation is seen in the HUI Index this week as the breakout has been confirmed. A significant breakout with a spike top following a small consolidation leaves us with several questions. Is the consolidation truly over? Will we see a sideways movement or declining index levels? The likely scenario appears to be a move down to 530-540 in the coming days before the rally resumes.
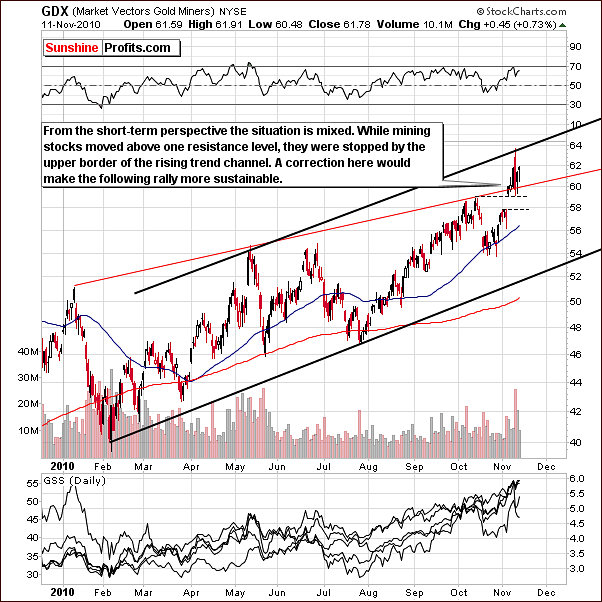
In the GDX short-term chart, we see that Thursday's volume was quite small, very much as was the case for gold. This may be a sign of weakness. In general the signals are not clear here. The upper border of the trading channel, the black line in our chart, appears to have held the rally in check and the red line provided support on the downside. It is possible that further price corrections are coming.
Such a large rally, truly an event, will likely have a more meaningful consolidation. Therefore, we would ideally like to see lower mining stock values before investing further or re-entering markets we have recently exited.
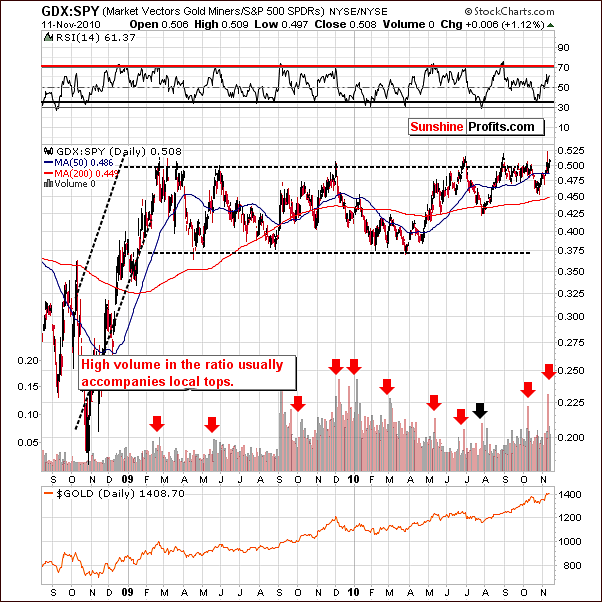
The GDX:SPY ratio measures mining stocks outperformance relative to the general stock market. For the short-term, bearish signs are seen here. High volume levels accompany local tops and a recent spike in volume indicates we may be at that point. Though declines have been small, more weakness will likely be seen in the short-term.
Summing up, mining stocks are truly at a critical point. It appears they have indeed broken out to new highs. However, before stating that we expect a continuation of a rally, we feel that the mining stocks need to take a breather. This consolidation will likely ensure strength for the major tops yet to come. Target levels for this next move will be set and published once breakouts have been verified.
Sunshine Profits' Gold Bottom Indicator
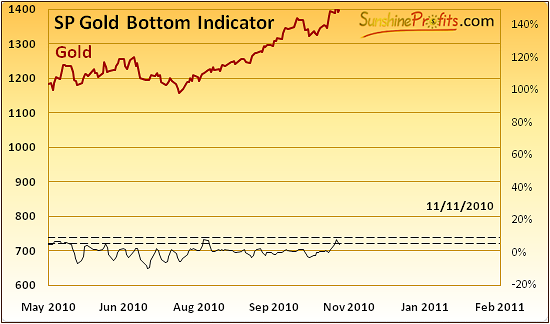
The Sp Gold Bottom Indicator has just flashed a buy signal as it has broken below the lower dashed line. What does it mean? Of course, it means that gold is likely to rally. However, the important part comes from the analysis of gold's performance after we've seen such signals in the past. Please take a look below - the SP Gold Bottom indicator is the blue line right in the middle of the chart.
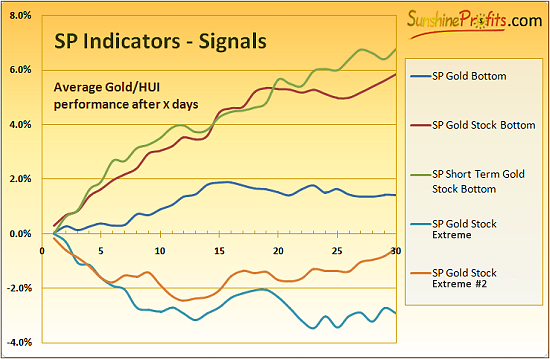
The noteworthy fact is that usually the rally picks up only after about 7 trading days after the signal is generated. At this point, the above signal is in tune with what we wrote in the above sections of this update. Namely, gold is likely to rise, but not right away.
Letters from Subscribers
This week we will start with the question about the exploding prices of Great Panther Resources Ltd. (TSX-V: GPR).
Nearly all juniors have recently exploded as gold has broken into new highs. This has attracted many individual investors to go into the precious metals market. As we've explained in previous updates, it is this group of investors that is much more likely to purchase junior mining stocks. Consequently, juniors have been outperforming big senior stocks in the past weeks. That was also the case with Great Panther Resources Ltd. By the way, we've mentioned this stock specifically, when we've mentioned this company as still being worth keeping - it has risen 77% since that time.
Speaking of juniors - please note that our SP Long-term Junior Indicator has just flashed a "sell" signal meaning that one should consider switching from juniors to seniors.
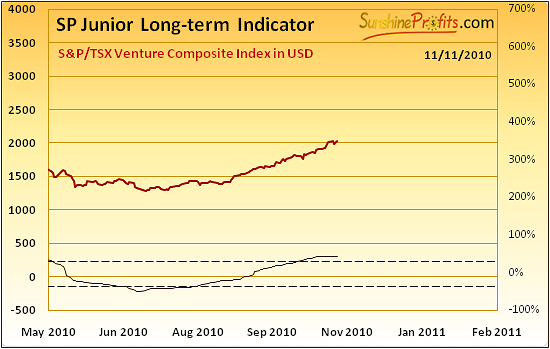
This signal is given once this indicator is above the upper dashed horizontal line and starts to decline. So far it declined only very modestly - it has not been visible on the chart meaning that the indicator declined only by a fraction of 1%. Consequently, we will wait for a "sell" signal coming from the general stock market before suggesting switching from juniors to seniors. This is the case because it is common for the juniors/seniors ratio to move along with the general stock market. This also means that if someone tells you that the general stock market is likely to decline strongly, and at the same time tells you that juniors are likely to outperform seniors, you might want to double-check this person's analysis.
Another question was about decision to raise maintenance margins for silver from $5,000 to $6,500 on Chicago Mercantile Exchange (CME).
Raising the maintenance margins is something that we should get used to, as there will be more of them as the bull market continues. This is the regulators' natural reaction toward rising values of metals, as they need to make sure the amount being held on margin represents more or less the same value percentage-wise. Theoretically, with silver at $10, a 10% margin is $1, whereas at $100 it would amount to $10.
At some point margins could become excessive, meaning that they could become bigger than the value of the contract on the metal itself. For instance to hold $10,000 of silver in a futures contract, you would need to deposit more than $10,000. That's right - and something like that happened just several years ago on the palladium market. You can read about it in this essay. If you are wondering if it is really worth the trouble to keep some metals in the physical form, then this essay will most likely provide sufficient incentive.
A word of caution here - while such a scenario could play out in the future, it is not likely to happen soon, so keeping only a part of your holdings in physical metal and using rest for short- and long-term trades still appears to be a good idea for most Investors.
We've also received several e-mails from our Subscribers (thank you) with question about the 200-ton shortfall of the Net Asset Value of the GLD ETF relative to the value of the GLD ETF itself. Generally, there are many bullish factors regarding the precious metals market right now, but this one seems a bit overstated. There is a very good essay describing the situation, so we will not repeat points listed there - instead we encourage you to take a look here.
Summary
The USD Index, which surprisingly has rallied recently will likely reach a local top fairly soon. Stocks appear likely to continue their rally although this may slow or pause for a time in the week ahead. The implications for gold, silver, and mining stocks are a similar pause followed by a big rally. Their recent show of strength bodes well for a bullish outlook for the medium term.
The most important target level discussed this week is the $1,600 level for gold. Confirmation of a breakout is needed first and then strong rally will likely follow. A local bottom will likely be seen soon and speculators should be well rewarded for entering it close to the bottom. As always - we will keep you updated.
This completes this week's Premium Update.
Thank you for using the Premium Service. Have a great weekend and profitable week!
Sincerely,
Przemyslaw Radomski

