It's not often that you can get such normally polar opposites as John Maynard Keynes and the Austrian School of Economics to agree on anything. But we did find something.
Ludwig von Mises of the Austrian school described what happened in the 1920s and 1930s, an explanation that accurately illustrates the situation in America today.
There is no means of avoiding the final collapse of a boom brought on by credit and fiat monetary expansion. The only question is whether the crisis should come sooner in the form of a recession or later as a final and total catastrophe of depression as the currency systems crumble.
John Maynard Keynes said the following:
There is no subtler, surer means of overturning society than to debauch the currency. The process engages all the hidden forces of economic law on the side of destruction and does it in a way that not one man in a million is able to diagnose.
This week in a dramatic effort to rev up a "disappointingly slow" economic recovery, the Fed said it will buy $600 billion of U.S. government bonds over the next eight months to drive down interest rates and encourage more borrowing and growth. This is known as QE2, the second round of quantitative easing.
A year and a half after the first round of quantitative easing Ben Bernanke confronts an economy hampered by high unemployment, a gridlocked political system and the threat of a Japan-like period of deflation.
The Fed left open the possibility of doing more if growth and inflation don't improve in the months ahead. The $75 billion a month in new purchases of Treasury debt come on top of $35 billion a month the Fed is expected to spend to replace mortgage bonds in its portfolio that are being retired.
Already policy makers in emerging market nations criticized the Federal Reserve on Thursday for its decision to pump more money into the U.S. economy, a measure that they fear could escalate the worrisome influx of cash into fast-growing economies around the world.
Officials from Brazil to South Korea threatened more measures to curb the flood of money that has pushed up currency values and fueled concerns that asset price bubbles might be in the making in their countries. The unusually sharp backlash against the Fed's action is likely to overshadow a gathering of leaders of the Group of 20 leading economies in Seoul at the end of next week.
In his recent monthly investment outlook Pimco Bond King Bill Gross called QE2 a Ponzi scheme and said its arrival will mark the end of the rally for U.S. Treasuries. He writes:
It seems that the Fed has taken Charles Ponzi one step further. Instead of simply paying for maturing debt with receipts from financial sector creditors - banks, insurance companies, surplus reserve nations and investment managers, to name the most significant - the Fed has joined the party itself. Rather than orchestrating the game from on high, it has jumped into the pond with the other swimmers. One and one-half trillion in checks were written in 2009, and trillions more lie ahead. The Fed, in effect, is telling the markets not to worry about our fiscal deficits, it will be the buyer of first and perhaps last resort. There is no need - as with Charles Ponzi - to find an increasing amount of future gullibles, they will just write the check themselves. I ask you: Has there ever been a Ponzi scheme so brazen? There has not. This one is so unique that it requires a new name. I call it a Sammy scheme, in honor of Uncle Sam and the politicians (as well as its citizens) who have brought us to this critical moment in time. It is not a Bernanke scheme, because this is his only alternative and he shares no responsibility for its origin. It is a Sammy scheme - you and I, and the politicians that we elect every two years - deserve all the blame.
Legendary Investor Jim Rogers said in a recent interview:
Printing money has never worked. It's never been good for anybody. Many people have tried it through history, it's never worked. I hope they don't do it, but unfortunately the head of the central bank in America doesn't know anything else to do and he's done it once, he says he's going to do it again. It didn't work the first time, it's not going to work this time.
There is a saying that "money is the root of all evil" but perhaps it should be amended to "fiat money is the root of all evil." The simple truth is that given the ability to create "money" any time and at negligible cost, central bankers sooner or later will create too much of it. The U.S. dollar has lost around 33% of its value in the past 10 years. This has not gone unnoticed by the rest of the world. They have taken notice of the fact that America has borrowed and spent its way into a hole. Meanwhile, gold has climbed from $300 per ounce to $1,375 an ounce.
As soon as it was widely understood some 50 years ago that the convertibility into gold was merely a method of controlling the amount of a currency, which was the real factor determining its value, governments became only too anxious to escape that constraints of the gold standard and money became more than ever a tool of politics.
Even the majority of finance gurus who don't see any need to back currencies with precious metals (other than Paul Krugman) are made uncomfortable by the thought of central bank printing presses whirring into non-stop action. And, with every nation in the world trying to export its way out of trouble, the race to devalue currencies in what is already known as the "Currency War" could gather pace in the coming months. Will prices react immediately, or will they provide us with a short move against this theory first - time will tell.
In a now-infamous 2002 speech, Ben Bernanke said:
(...) The U.S. government has a technology, called a printing press (or, today, its electronic equivalent), that allows it to produce as many U.S. dollars as it wishes at essentially no cost... Under a paper-money system, a determined government can always generate higher spending and hence positive inflation...
Still, as we often mentioned in the past - fundamentals are one thing (and drive markets in the long run), and the psychological factors (and thus technical ones) drive markets in the short run. Consequently, in order to check what may be just around the corner, it is useful for one to check what are the charts saying (charts courtesy of http://stockcharts.com.) Let's begin with the analysis of the USD Index chart.
USD Index - Euro Index
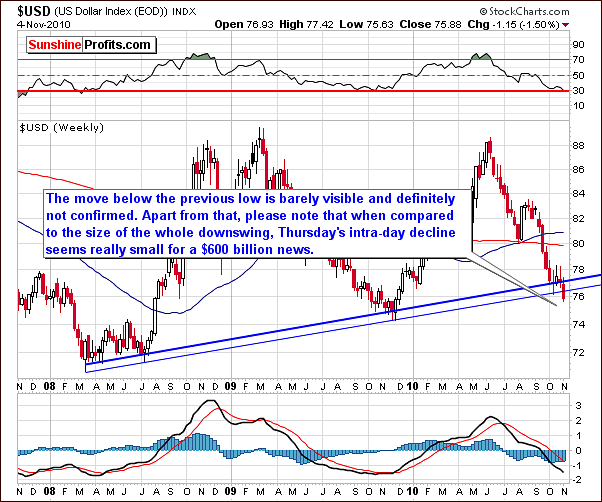
This week saw a move slightly below the long-term support line. This really is quite minimal when compared to the size of the previous rally. Especially, Thursday's intra-day price action was not all that big considering the Fed's $600B news.
Truly, yesterday's decline was not as big as it could have been. In fact, much larger weekly declines have been seen recently. Since the breakdown has not been verified, we still need to think of it as possibly fake until confirmed. If this confirmation is indeed realized, action can then be taken as the ultimate direction will likely be more clear and predictable. This is, however, not yet the case.
Indeed, the market may not have acted negatively at all. It could simply be a temporary reaction. Friday, Monday and Tuesday's price action will likely confirm the dollar's near-term direction.
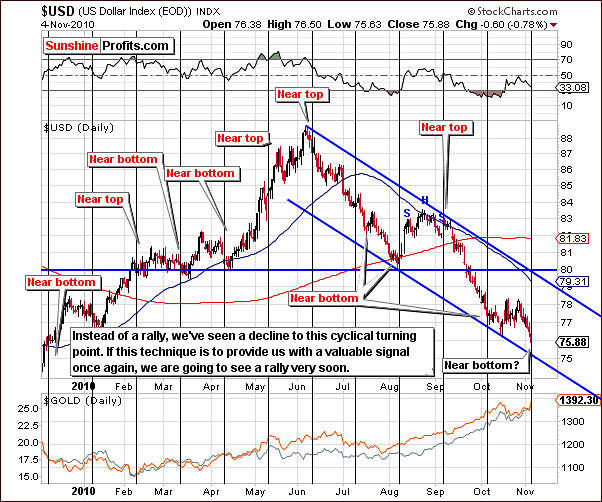
The short-term chart this week shows USD Index levels to be close to the lower border of the trading channel and approaching a cyclical turning point. Taken alone, this chart yields very little bearish information. We emphasize once again, that long-term trends should be taken much more seriously that what can be gleaned from a much shorter time period and for this reason we must give more weight to what was presented in our opening section.
Summing up, possibly the USD Index will rally in the next few weeks. The next several days trading activity will allow us to make a more conclusive call. Ideally, either the breakout or breakdown will be accompanied by high volume levels, which will confirm the move. Recent moderate volume levels have not been sufficient to provide us with any clear details about what is to come. Several contradictory signs have also been seen. The most prudent suggestion at this time is to wait.
General Stock Market
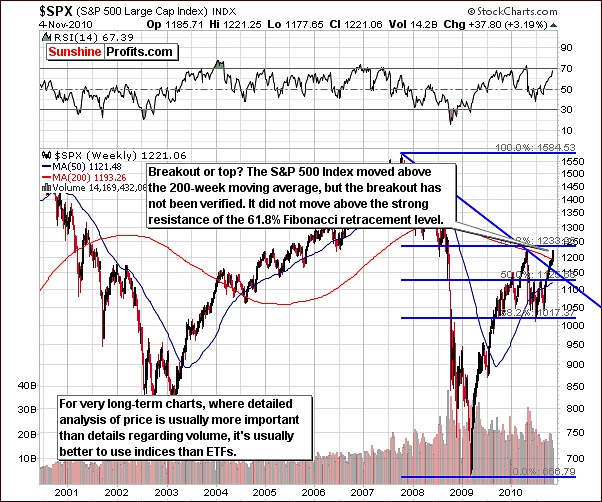
The S&P rose nearly 2% on Thursday, which in and of itself seems quite bullish. However, we must note that it is important to remember this was but a single day and even though prices have risen above the 200-week moving average, they have not surpassed the 61.8% Fibonacci retracement level. Since such an important resistance level has not yet been taken out, a further show of strength is needed to confirm that any rally in the general stock market can be sustained.
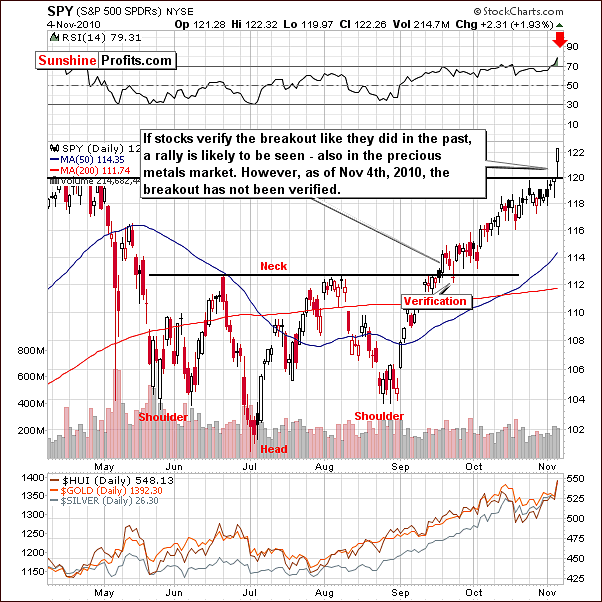
The short-term chart this week shows that the RSI is in overbought status while prices have been rising. The next few days will allow us to further compare with action seen in late September. At that time, prices moved above the neck of the head and shoulders pattern and the following price action was quite bullish precisely because the previous resistance line was verified as support. Should we see a similar verification here (a move to the $120 level and a bounce back up), further gains will become a likely scenario.
Conversely, if lower prices are seen with high volume levels in the coming days, this will be a very bearish sign. Volume levels and price action should remain in the center of our focus in the days ahead.
Summing up, sentiment is slightly bullish at this time for the general stock market. Confirmation of recent price action is yet to be seen. The next few days will tell much after Thursday's one day of very favorable price action.
It appears that many investors are simply not sure that the stimulus package will help the economy. Much controversy surrounds this issue and investors are taking sides for or against it. Speculative investors may ultimately decide to close their positions, which could cause severe price declines for the general stock market as a whole. Perhaps this emotional rally should be verified before it can be seriously taken into account.
Correlation Matrix
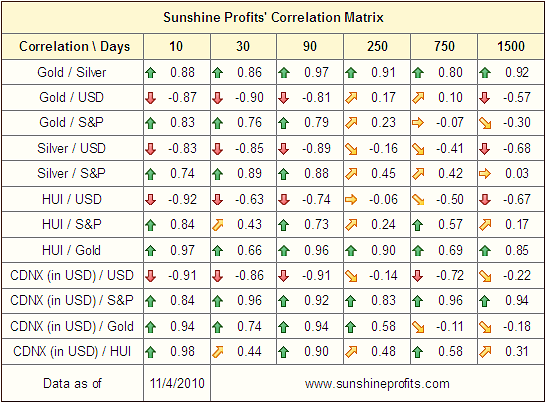
The correlations seen in recent weeks still hold. There has been no change in the strong positive relationship between metals and the general stock market nor has the negative correlation changed for metals with the USD Index.
Both the general stock market and the USD Index may soon be breaking through resistance or support lines. Before confirmations to the contrary are seen, one cannot rule out a bearish scenario for gold, silver and mining stocks, just as one should not rule out decline in the general stock market and a rally in the USD Index.
Gold
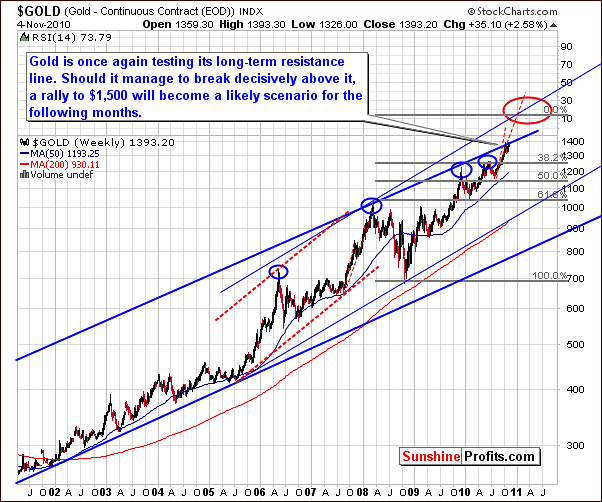
The big news Thursday was the $40 price increase we saw for gold and whether this is a break- out or a fake rally. We will attempt to shed some light on this rather unclear situation.
In this week's very long-term chart, we first see that gold did not move above the upper border of the very long-term (including the whole bull market) trading channel. As we have discussed previously, some consolidation was expected. Has this already been seen in its entirety or is more yet to come? There does not appear to be enough information at this time to make this call. Three daily closes above the thick blue line in our chart or huge volume corresponding to a rally from here would confirm that consolidation has completed.
Focusing on the solid blue lines for a moment, a breakout above this upper border would likely be followed by a move to $1,500 or so in the following months. Until such a breakout is seen, gold may simply not move significantly higher - in that case it would be likely to correct once again.
The dotted lines in our chart have been inserted as a result of Subscriber question regarding gold's recent trends being analogous to what was seen in 2007. This is not the case in our view, for at that time, no important resistance lines were being touched. Furthermore, the short-term trading channel was not close to gold's price level in 2007.
A consolidation had been seen for over a year and was followed by a sharp rally. Gold would need to be close to $1450 today and eventually move to $1600 if the 2007 trend were truly being repeated, that is, similar % price increases been applied today. This seems to be an unlikely scenario (taking the previously mentioned $1,500 target into account), and we do not feel comparisons to 2007 are really meaningful. Simply put, each year saw a rally and a meaningful correction but little else can be said about striking similarities between '07 and '10.
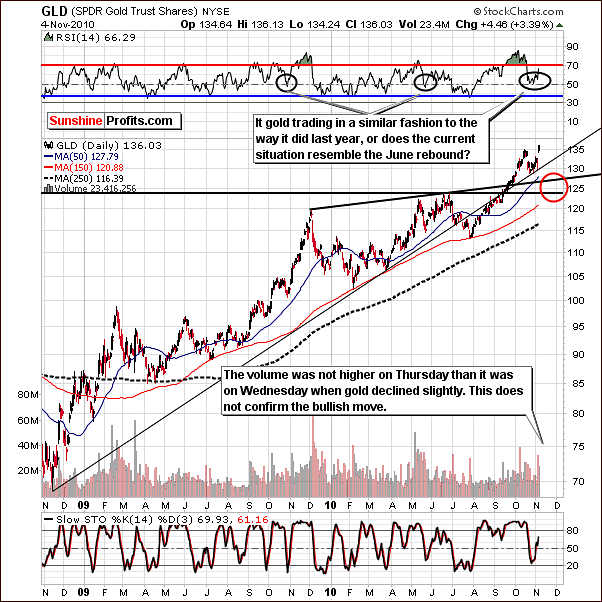
The GLD ETF long-term chart provides much needed volume-level information. Although Thursday's volume was not tiny, it still was not greater than Wednesday's volume, which was accompanied by a slight price decline. Therefore, the move has not been confirmed. This is not an obvious "go short", which would be the case with half of the volume. The question is can a breakout above the previous high be sustained? At least three consecutive closes (or a rally on huge volume) above this level are needed and only one has been seen at this time.
RSI level, which moved down close to the 50-level, is now on the rise. Similar trends were seen last year and also near the middle of this year. Either a rally or decline could be imminent based on this information. Thursday's market yielded no conclusive data and we are still awaiting additional clues to allow more complete analysis on this matter.
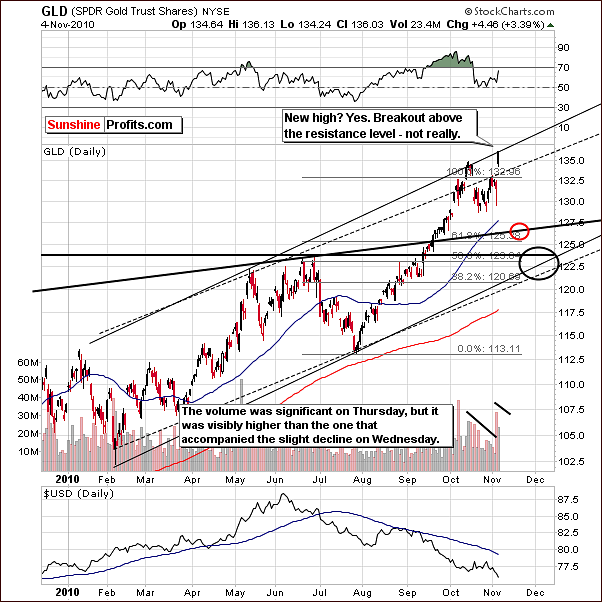
The short-term GLD chart this week clearly shows that the upper border of the rising trend channel was not pierced. Gold's October rally was also stopped by this same resistance line. Since a breakout has not yet been seen, a major decline could still materialize.
One final note here is warranted. A year ago (after the December top), as visible on GLD ETF long-term chart, we saw $150 correction in gold's price so a $100 decline here is not unthinkable and would bring us to the target level illustrated in our short-term chart, close to the $123 GLD ETF level. This is definitely something worth keeping in mind, especially when we did not have the breakout yet.
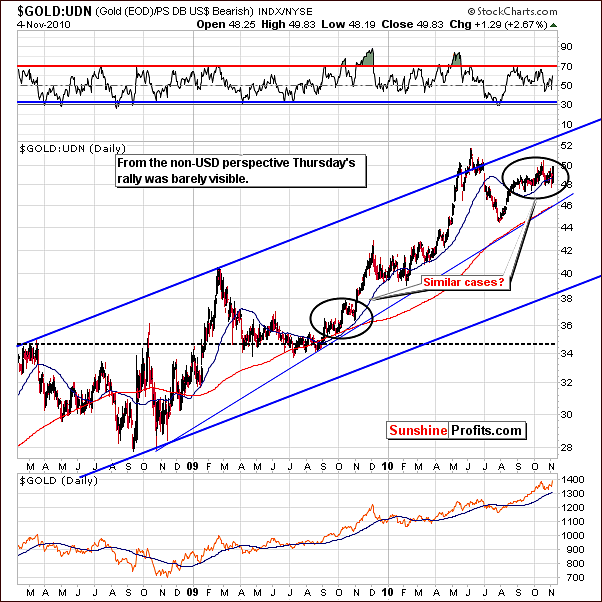
In this week's non-USD gold chart, we also see no breakout. Although volatility has increased, we do not have any confirmation of gold's move for non-USD investors. Once again we expect much greater clarity once we have moved through a few more days following the big mid-week news by the US Fed. Numerous world markets are often impacted by various government actions and this is no exception to the rule.
Summing up, at first glance, the gold's recent move appears very bullish. A second look and further use of analysis tools provides much less optimism. A decisive move above the upper border of the long-term trading channel seen in our very long-term chart is needed. At the same time we should see the gold price moving above the short-term trading channel. Until such a breakout is seen, the gold simply does not look nearly as bullish as at the first glance.
Another thought worth deeper consideration is that the gold did not manage to move above rising resistance lines despite the Fed pumping $600B into economy.
Silver
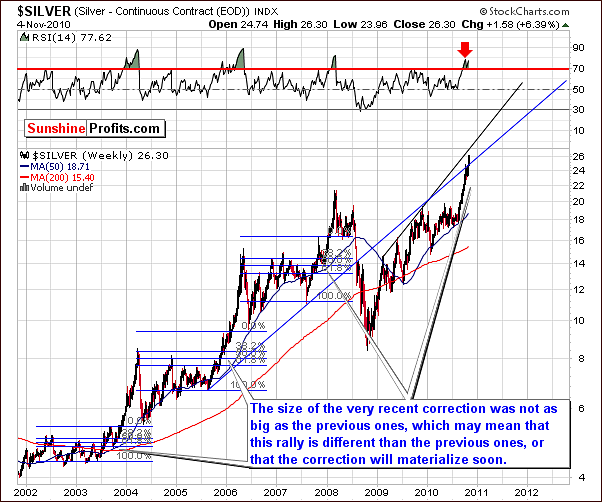
This week saw silver move quickly and decisively up with close to a 6% gain recorded on Thursday. The recent correction was small compared to those seen in the recent past, which may mean that in fact "this time is different", which is generally not a profitable phrase most of the time, as history tends to repeat itself.
There is, of course, the possibility that the true correction is yet to come as we have only seen one close above the important blue resistance line and close to black resistance line. Silver's price could decline from here just as quickly as it has moved to the current new highs. Much depends on the general stock market and the USD Index, as these both have profound effects on the white metal. Their current trends have yet to be verified and the near-term direction for silver is therefore a tough call as of this writing. There is simply not enough clarity in related markets to project which direction is more probable for silver in the coming weeks.
The RSI continues to be in overbought territory just as we have seen on several occasions in the past. The suggestion from this indicator is that the correction may have not yet been seen.
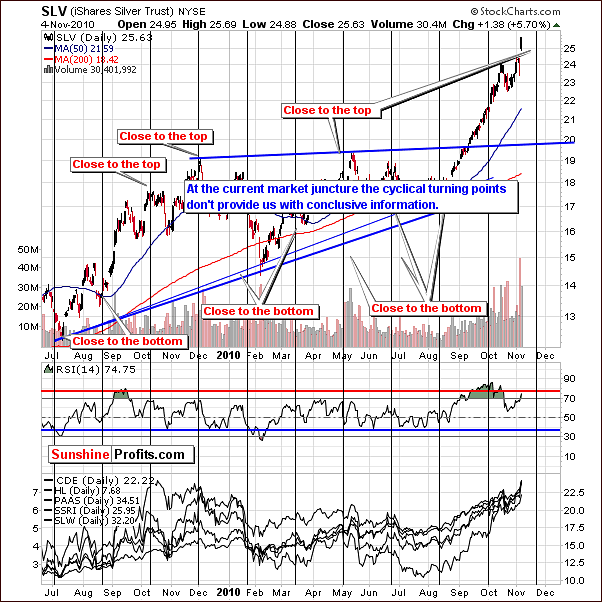
The short-term chart adds little to what we have already discussed. Once again silver is the least predictable market as it is influenced greatly by several other markets and indices, namely the general stock market and the USD Index.
The cyclical turning point analysis is the basic function of this chart each week. We are however unable to make a conclusive call at this time for the next turning point which is approximately two weeks away. Taking into account what we have discussed previously, should silver move higher from here, we will see a local top. Likewise, should silver's price decline, the next turning point will be a local bottom. These contradictory possibilities make the critical turning point tool of little value in this week's Premium Update - we decided to provide it just to explain how we use this tool during different market junctures.
Summing up, silver may move higher before correcting but much depends upon stocks and the US dollar in the days ahead. So far neither a breakout nor a breakdown was confirmed. We could see the silver dropping as fast as it climbed recently (maybe even faster) if the proper catalyst will be added. This would be the falling stocks and the USD Index rally.
Mining Stocks
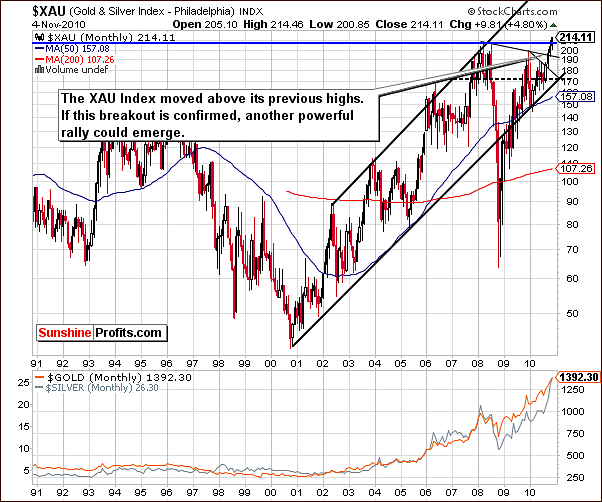
The XAU gold-silver stock index has moved and closed yesterday above the highs seen in 2008. We have previously alluded to this as a key point and it could, in fact, lead to mining stocks outperforming gold once again. This could be the situation we are in today but we would prefer to see if the breakout can hold first. Ideally at least three consecutive closes above the resistance line are needed. Should that take place, a price decline to the previous high with low volume could make a bet on higher prices for mining stocks a good idea.
Still, until the above is seen keeping a small amount of speculative capital in shorts as a hedge against long-term holdings in the sector is a good idea (which is consistent with yesterday's Market Alert). This could be more than beneficial if the breakout is actually a fake-out.
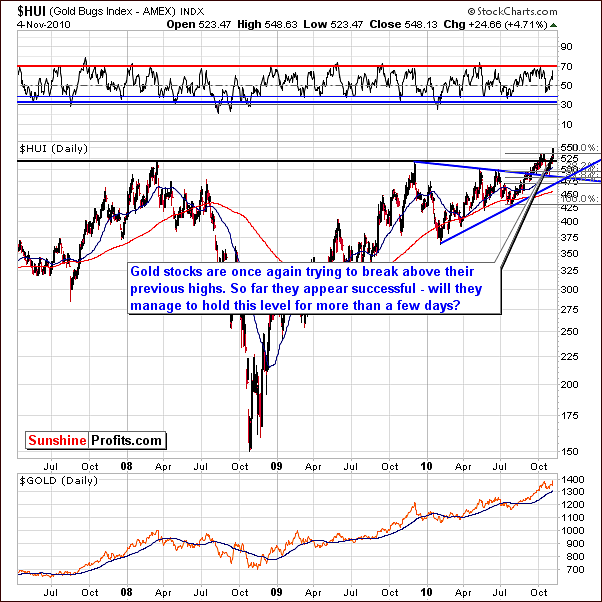
Just like it was the case with the XAU Index, the HUI Index (gold stocks) has attempted to surpass its previous highs and the next two days may very well reveal whether or not this will be accomplished anytime soon. Unfortunately, Thursday's market close - being only one day event - did not provide any clues of value in this area.
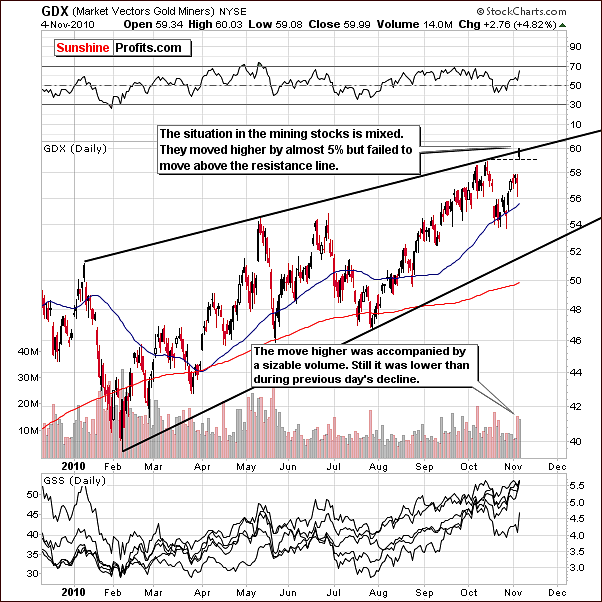
In the short-term GDX chart, the rally has been very visible. Although the volume has been significant, it has been lower than seen in previous declines. Mining stocks however have not moved above the short-term resistance line and the current rally might not be sustainable. Much depends on whether or not a breakout is verified. Ideally, a move higher followed by declines with low volume levels after breaking above a resistance line will likely provide favorable buying opportunities.
Silver-Gold Ratio
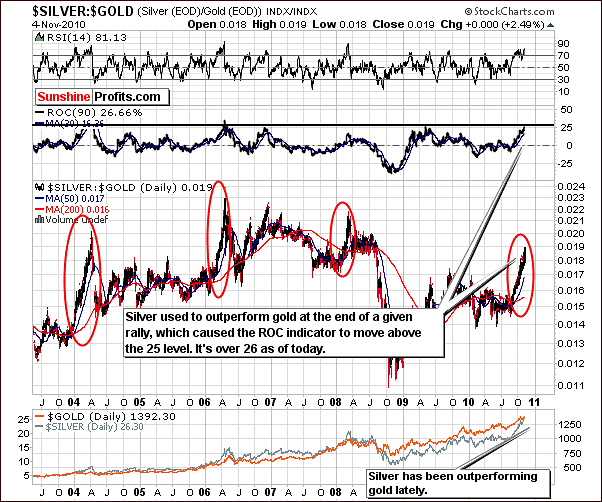
The Silver-to-Gold Ratio Chart supports a bearish sentiment at this time. Since silver outperforms gold in the final stages of a rally, the outperformance can be quantified with this ratio to estimate the timing for a local top. The belief is that on a relative basis the public generally buys more silver than institutional investors who lean towards gold. Silver being a smaller, lower-priced market is more attractive and more available to the average investor. Thus, smaller investors drive silver's price higher but they do not have the means to sustain such a rally for the long-term. Since the public usually enters the market last, silver's outperformance suggests that the rally is ending.
The local top, actually a huge spike mentioned earlier is seen at present. The ROC (rate of change) indicator is now greater than 26. A level of 25 or so is normally a sign to be cautious for the top is close or already in. Generally, we use this particular indicator here, as it provides us with the clearest representation of the abovementioned phenomenon - only the big rallies in the ratio affect the indicator and this is what we've seen recently.
Juniors
As stated in the Key Principles section, the list of top juniors will be updated approximately every 4 weeks, so this is the Update that should contain the revised version of the list. However, before providing you with details, we would like to comment on this sector's performance in general.
Sunshine Profits sp junior long term Indicator chart
Our SP Junior Long-Term Indicator has been consistently suggesting holding juniors since June. In Premium Update from August 6th 2010 we were seeing this particular indicator below dashed line and starting to rise. Two weeks ago we wrote the following:
SP Junior long-term indicator did not flash a sell signal (meaning switching from junior mining stocks to big senior gold and silver producers) yet, but since the indicator is presently above the horizontal dotted line, it is worth a closer look. As soon as a move lower in the general stock market (and juniors) will be seen and this indicator starts to decline, it will be a sell signal for juniors. We generally suggest using it to switch from juniors to seniors, but of course you are free to utilize this bearish junior signal in any way you see fit."
Given this week's comments regarding the general stock market, the above comments are still valid today - we have yet to see a decline in the general stock market, most likely accompanied by a sell signal from the SP Junior Long-term Indicator.
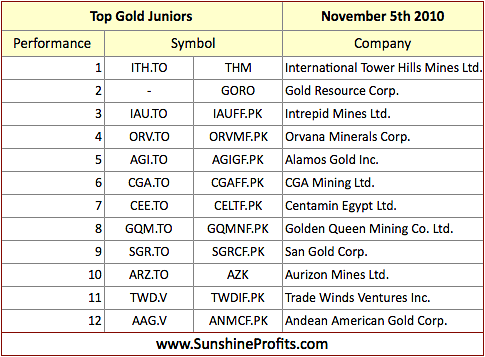
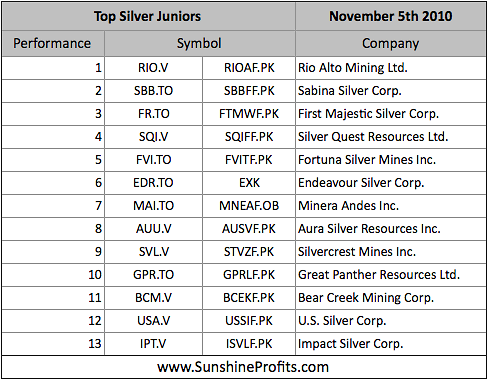
There are not many changes this week. We've decided to add Trade Winds Ventures Inc., and Andean American Gold Corp. to our gold list, and U.S. Silver Corp. to our silver list, however given the current situation on the general stock market it seems that adding to your junior holdings will be justified only if the general stock market can verify its move higher.
Letters from Subscribers
The first question we would like to comment on is if one should short gold to protect the physical gold already in one's possession if one believes that the market is going temporarily lower.
Yes, in our view hedging one's gold holdings is better than the direct sale of the yellow metal, because of the possibility that the derivatives markets' melt down, or any other financial turmoil could make purchasing more gold either impossible or illegal. Of course, the possibility of such a scenario is very low but taking the next several years or so into account, this scenario could play out.
If you owned physical hold and hedged it using speculative instruments, for instance options, and price of gold would soar due to derivatives' default, you would still have your valuable gold position that would become even more valuable because of the default. You would have a dollar loss, but you would not face the problem of not being able to buy gold as you would already own it.
On the other hand, if you sold your gold directly and the metal moved higher due to derivatives' default, you would have a very hard time if you tried to buy gold again, since the price would move up very quickly. Also take into account that during such turbulent times purchases of gold might be banned.
The point is - holding your gold protects you from the financial turmoil. By hedging your position instead of selling it, you remain at least somewhat protected even without the temporary lack of exposure to gold's price moves.
Second question was what will happen if the G.O.P. will take over the House and the Senate? Will it change our views on the market?
Not really. In our view the only "real" alternative comes from the libertarians and Ron Paul. Republicans and Democrats (Demopublicans and Republicrats?) are quite similar in terms of the most crucial aspect of the economy - none of them will take real steps to take care of the structural problems. None of them will take a responsible approach and admit that interest rates have been too low for too long, which created excessive liquidity, over consumption and misallocation of capital. Now the American people are paying the price. Regardless of who wins the elections, the price of gold will most likely continue to rise in the long run, with corrections from time to time.
Summary
The USD Index has broken below support levels but verification is still needed. In case of the general stock market, the opposite is true.
The strong relationship between stocks and precious metals as well as stocks and the USD Index will determine whether breakouts or breakdowns will be seen. Some bullish signs have been seen for gold, silver and mining stocks but several bearish indicators are present as well. The silver-gold ratio and the above analysis support the bearish view.
The implications here are that even though there is a high risk of lower prices, selling long-term holdings is not advised at this time and in case of the speculative capital no additional actions beyond what was discussed in Thursday's market alert are needed.
In other words, a small open speculative short position in precious metals appears to be a good idea as a hedge against possible declines (should a decline materialize, it is likely to be at least as dramatic as the recent move up). Any confirmation, which clarifies the gray areas present today, will likely provide opportunities for speculative short or long positions depending on what is revealed. Sunshine Profits will continue to monitor the situation and inform our Subscribers as warranted.
This completes this week's Premium Update.
Thank you for using the Premium Service. Have a great weekend and profitable week!
Sincerely,
Przemyslaw Radomski


