
Robert Parker is a well known investment expert, Senior Advisor at Credit Suisse and a frequent television. So when we had a chance to hear him give a presentation to an exclusive group of the bank's heavy weight clients in an invitation-only event, we were interested to hear what he had to say. Or more to the point, we wanted to know what the bank's wealthiest clients are hearing.
Parker brought up gold towards the end of his presentation, but since that topic interests us the most, we'll bring it up first.
The official Credit Suisse policy is that investors should have 10% of their portfolio in gold. Parker doesn't like gold at its current prices and prefers investing in South African gold mines or Russian mines, which he says are very cheap. Although he doesn't see much upside to commodities, neither does he see much downside risk. Assuming further downward pressure on the US dollar, the gold price could test $1,400/ounce by the first quarter of next year, though speculative long positions are now becoming extended, he said.
Given the positive growth outlook in Asia, the downside risk in commodity prices seems minimal, said Parker.
Nobody has a crystal ball to predict what gold will do, but we don't agree with Parker's analysis. We believe that the bull market still has a long way to run (the high for gold in the '70 - '80 bull market in "real" inflation-adjusted terms is over $6,000). Think about it - even if gold bears see higher prices ahead then we are definitely in the correct market. Generally, we agree with the Credit Suisse policy of at least 10% of the portfolio in gold. (In the Key Principles section of our whow to structure your gold portfolioebsite we explain how to structure your gold portfolio.) According to a Bloomberg report Just this week a Chinese newspaper affiliated with the Ministry of Commerce said China should buy more gold to diversify its foreign exchange reserves. China should increase its gold holdings if the country aspires to "internationalize" its currency, the paper said on its website. This is just one reason why we believe gold has a long way to go before it reaches bubble territory.
Parker showed an interesting graph of long-term risk appetite (fear and greed) going back to 1981.
We are moving back to panic territory, he said. Investors are cautious and there is a lot of cash sitting on the sidelines. Let me remind you that you earn close to zero on cash and that cash will have to move somewhere.
At Sunshine Profits we believe a good portion of the cash sitting on the sidelines looking for a safe haven will be channeled into gold, yet - not necessarily right away.
Parker started out by calling the Currency War a "lot of nonsense." According to him, the phrase is wrong since the fundamental problem is simply that the US dollar is weak against all the other currencies. It's not a currency war, it's actually dollar weakness, he said.
The Asian currencies are undervalued and "something is going to give," he said. The Chinese want to raise the value of the yen, but they want to do it slowly and in conjunction with their Asian partners.
Although he believes the US will likely avoid a "double dip" recession, the growth pattern for the rest of 2010 will remain mediocre with growth struggling to reach 2% annualized and, in the first half of next year, real GDP growth will probably average 2-2.5%, he said. But if the Bush tax cuts are not renewed and expire in December, then it is highly likely the US growth actually could decelerate to less than 1%.
Exports continue to be among the more encouraging areas of the U.S. economy. However, weakness persists, primarily in consumption and low consumer confidence. Other negative factors for consumption are the lack of improvement in the labor market, the slow growth in personal incomes and the effect from the poor housing market.
Unemployment at 9.6% shows little sign of improvement.
These are some shocking statistics. Unemployment is 9% if you don't count the people who are not registered. The real number is more like 15 %. It's going to be a problem for years to come. It's a dead weight on the economy.
In terms of where we go from here, you had a very clear statement from the Federal Reserve, which is firstly they are going to keep interest rates at 0-25 basis points for the foreseeable future and that could well extend into the second half of next year. Secondly, they are worried about the risk of deflation and the sluggishness or the mediocrity of economic growth. Therefore, there is a high probability that they will actually do what they threatened to do, which is actually extending quantitative easing through the purchase of US treasuries and possibly also through some intervention in the mortgaged packed market and obviously that would be targeted at helping the US housing market, which actually shows no sign of recovery whatsoever at the moment.
Parker expressed worries about Japan, the world's third largest economy. He says he has struggled to find some positive data about Japan but couldn't find any.
Japan is worrying. Their economy could be going back to a recession. The Central Bank of Japan failed to do quantitative easing and there is not enough liquidity in the system. The Japanese are hurting and they are losing market share. Japan desperately needs to lower the value of the yen.
According to Parker, the euro zone is no longer one economic unit - there is the successful north and the dysfunctional south.
We have very strong numbers still coming out of northern Europe, Scandinavia, Germany, and certain central European economies such as Poland, and it is highly likely that over the next 12 months German growth will be in the order of 3-4%. But countries like Greece remain in deep recession. Spain will struggle next year to have positive growth, as will Holland and Portugal. Last year I made a presentation in Greece and I told them they have a major problem and that they are close to default. What they have done so far is impressive but come 2012 they will most likely need to restructure their debts, which is a polite way to say default.
Parker concluded by saying that he likes equities, which he believes are very cheap right now, especially European equities. Credit Suisse is long IT, health care and telecoms. Parker especially likes companies that pay high dividends. The cheapest stock market is Russia (Editor's note - please keep in mind that most of the volume on the Russian stock market is generated by oil stocks, which could be viewed as a somewhat bullish suggestion for commodities after all). Japan is cheap and will stay cheap. He sees a recovery in the equity markets led by Northern Europe, and Asia/Latin America late in the 4th quarter of 2010 and in the first half of 2011. Parker especially likes Poland, which is the only country that didn't go into recession in 2008, had no banking problems and has a stable, coherent government. He pointed out as an example the fact that Mercedes Benz automobiles are assembled in Germany but the component parts are manufactured in Poland.
Parker says that there is no need to worry about a Japanese style deflation and it's too early to worry about inflation, at least not until 2012.
Since the year 2012 seems far off, let's see how precious metals are behaving now. We will begin this week's technical part with the analysis of the USD Index. We will start with the long-term chart (charts courtesy by http://stockcharts.com/.)
USD Index
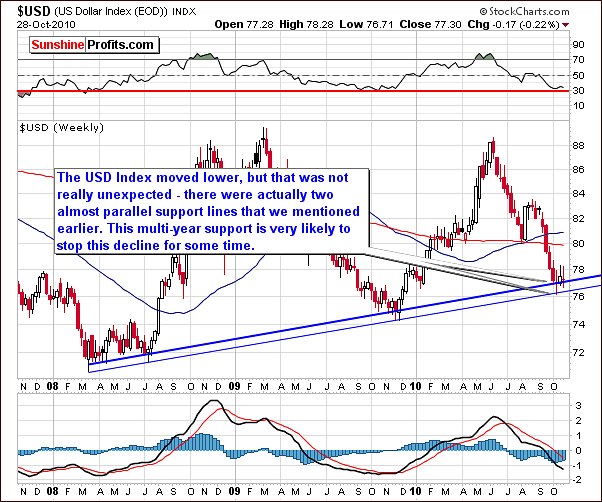
Once again, we begin this week's Premium Update with the USD Index chart since the current Euro Index chart did not provide any additional information of value. In order to put the below analysis into proper perspective, we decided to provide the long-term chart above even though value of the USD Index decline was stopped by two very long-term support levels. This is a significant development and it is likely that further declines will not be seen for some time.
With several daily closes above these levels, a rally from here is likely. Furthermore, the RSI is near the 30-level. In the past, this has indicated that the bottom is quite close or even that is already in. In short, multiple signs point to bullish times ahead for the USD Index and this will impact nearly all other markets and is sure to affect gold, silver, and mining stocks very quickly.
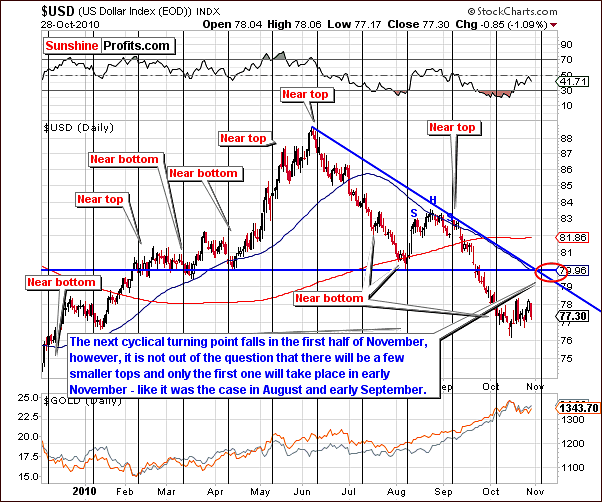
In the short-term USD Index chart, we see there was no decisive move higher as of yet. Patterns here have been similar though in opposite directions of what has been seen in gold and silver. The USD Index has rallied sharply and then consolidated whereas gold and silver have declined sharply and are now consolidating.
As mentioned a week ago, the next cyclical turning point falls in the first half of November, but it may correspond only to a first out of a few local tops at that time. This would make this part of the analysis consistent with what we have in the gold and silver sections.
Given the size of the previous medium-term rally in precious metals and the decline in the USD Index, a correction seems quite likely to materialize here very soon. Although 79 to 80 is the most likely target range, the upper border of this range is more probable to stop the rally. Confirmation of the bullish points will be seen in the following UUP Index chart.
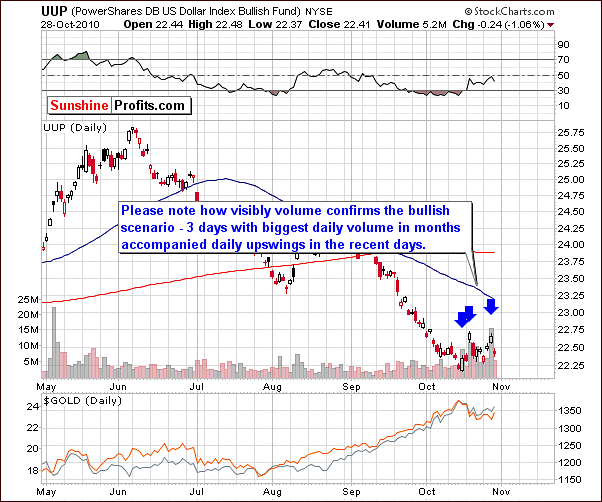
The UUP ETF, which is a proxy for the USD Index shows volume levels, which confirm points made earlier. For the first time (precisely 3 times) since last May, volume levels have exceeded 10 million. Coupled with increasing index levels on these days, this is a strong indication that higher prices are likely in the short term. This is bearish news for gold, silver and mining stocks.
Summing up, it appears that USD Index levels are likely to rise in the short-term. This is exactly what we stated in last week's update and developments seen this week were consistent with our expectations. Once again, Subscribers are reminded that this is bearish news for gold, silver and mining stocks.
General Stock Market
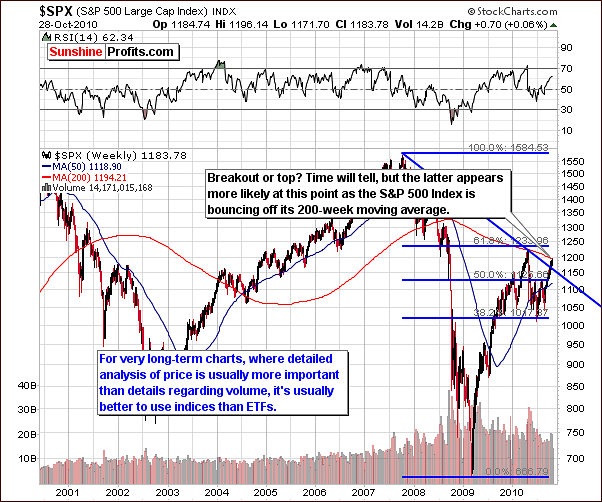
The week's very long-term S&P 500 Index chart shows that the 200-week moving average level has been reached. This has previously provided support (in 2004 and early in 2008) as well as resistance and should not be ignored. It proved to be a very strong resistance line earlier this year as a severe decline immediately followed the April-May bounce off this important moving-average. Notice that we are using S&P 500 Index not the SPY ETF in order to analyze the very long-term price (here: index value) tendencies.
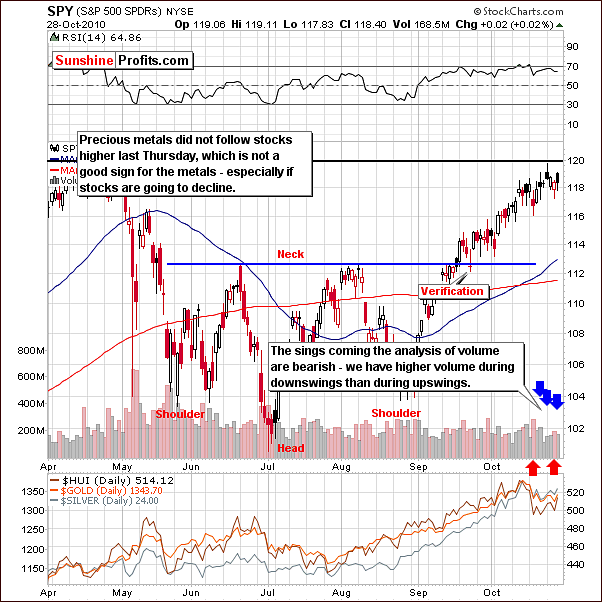
The short-term SPY ETF chart this week shows that a medium-term resistance level has been reached close to the 120-level. We've mentioned this level as probable resistance in one of our Premium Updates more than a month ago. Although this level has been reached on an intra-day basis only, most likely the stocks will decline.
Additional confirmation comes from the volume. Although this is by far less visible than it was the case with the UUP Index, still we've seen higher prices accompanied by lower volume and lower prices accompanied by higher volume.
Summing up, some sideways movement may be seen for a few days but the odds are great that stocks will see significant declines within the next week or two. A likely target level for the SPY ETF appears to be around $113. It's too early to say if this is going to be the final bottom for the decline. Either way, this decline will likely have a negative impact on gold, silver and mining stocks, which have recently moved more or less in tune with the general stock market.
Correlation Matrix
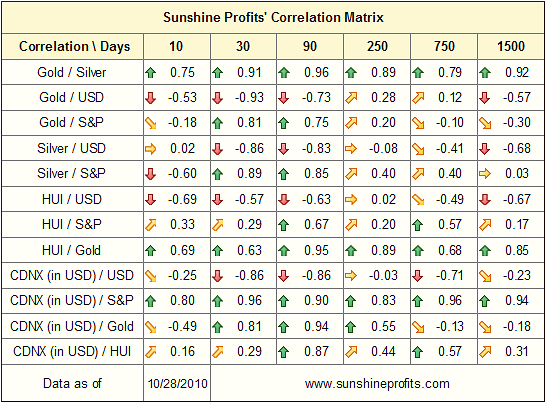
The Correlation Matrix, which can be found in our website's tools section, shows no big changes in the medium or short-term columns this week. Positive correlations are seen between precious metals and stocks whereas metals are negatively correlated with the USD Index in the medium-term. Similar situations are seen in the short-term with one exception.
The HUI Index has been diverging not from gold but from the general stock market. It has moved higher this week while stocks have consolidated. However, once the general stocks market moves lower it will most likely translate into lower prices of the gold, silver and mining stocks as well. This is likely to happen despite low correlation coefficient visible between the HUI Index and the general stock market.
An additional point is to be made here as a Subscriber recently inquired about mining stocks diverging from gold. Having in mind the abovementioned analysis of the Correlation Matrix the only thing that the mining stocks are diverging from is the general stock market. The fact that mining stocks recently have not followed the general stock market should not be considered a bullish factor at this point in time. Historical data and trends are always the general expectation until proven no longer valid. As far as long-term underperformance of mining stocks to gold is concerned, we will get back to this topic in the following part of the update.
Gold
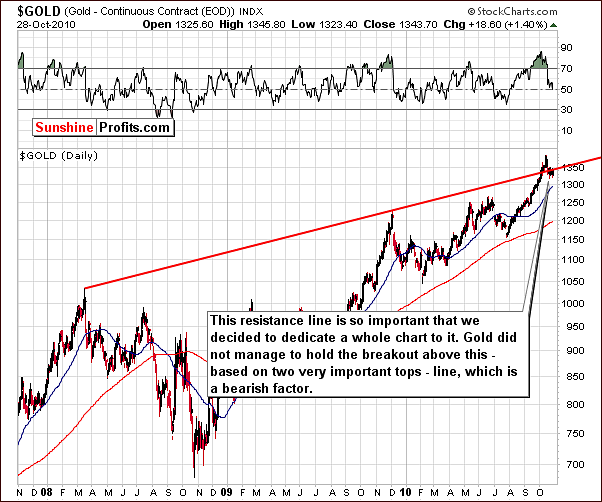
In the long-term chart for gold this week, we see an important development with respect to the upper border of the trading channel. As you might have noticed we are not using the GLD ETF but the gold itself. This is because sometimes the very long-term trend lines could be disordered when analyzing ETF's. The same goes for using SPX (S&P 500 Index) instead of SPY ETF.
The key point to be made here is that since this is clearly seen on a long-term chart, it is of greater significance than observations made and inferences gathered from a week or two of price action such as is seen in typical short-term charts. We would like to remind our Subscribers here that a trend line has held despite gold's attempt to move above it, and since gold consolidates below the line, it has strong bearish implications for the short-term.
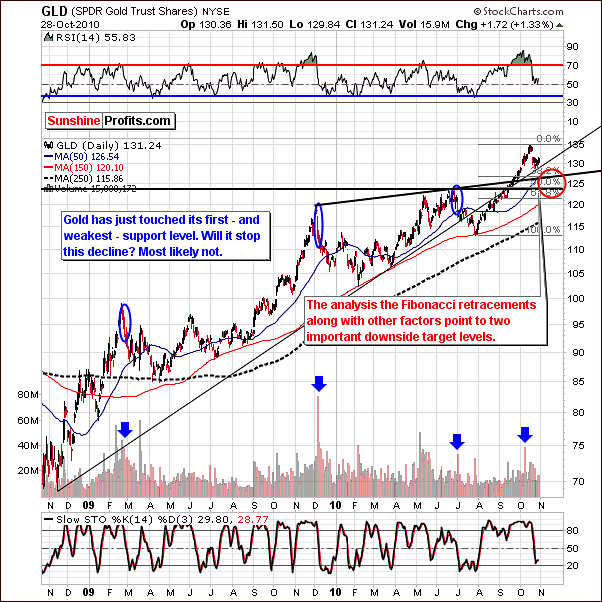
The GLD ETF long-term chart for gold this week again contains the likely target area for gold's current downturn. Although we have moved the target ellipse out a couple of days, its level is unchanged from that which we published in last week's Premium Update. Once again, further declines appear likely. Quoting from last week, "they are still in range from approximately $121 to $125.5 in GLD ETF, which are corresponding respectively to around $1240 and $1285 in spot gold."
Thursday's closing level of 131.24 is actually slightly higher than last Thursday's close but the low trading volume levels seen for the past several days make this development of little significance.
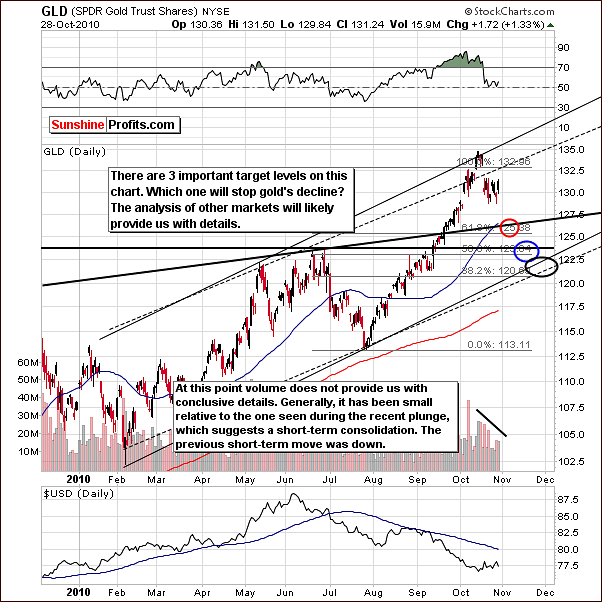
This week's short-term chart once again has three target levels, which have not changed from the past two weeks. We have also moved these ellipses forward by several days and continue to believe that the likely bottom is probably a few weeks away. This week's movement has been sideways and we are therefore in very much the same situation as we saw one week ago. Daily volume levels have also been lower than those seen during the recent sharp decline, which is something seen during consolidations.
We are beginning to see a flag pattern formation and this should result in some symmetry in coming weeks. That is, the beginning of the pattern (the recent plunge) should be somewhat symmetric with the latter part (move after prices break out below the $129 level) and based on this, the red ellipse in our chart seems to be the most likely target. Most likely we will see continuation of the downside trend, which we have seen before entering this pattern.
Once again lower prices appear to be a good bet when we will see move up on tiny volume. We have seen moves higher recently but the volume was not small enough to justify issuing the Market Alert.
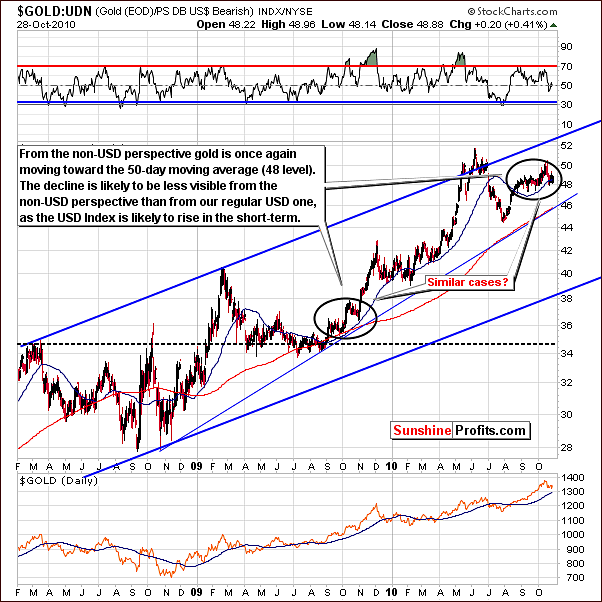
From a non-USD perspective, this week's sideways movement is less visible, as indicated in the previous week. Little has changed since last week and the expected USD short-run rally will continue to impact the non-USD movement in the same way.
Although the rally from a non-USD perspective is likely to be less volatile than this in the gold in USD, this does not invalidate the likelihood of a decline. The non-USD price action of gold at times does little to the corresponding USD price levels. Please notice that in March 2008 and January 2009 the gold from non-USD perspective was on about the same level while from the USD perspective it was about $100 lower in January 2009. The same goes for February and December 2009 - in both cases gold rallied, but from the non-USD perspective the gold was only around 5% higher whereas the upswing from our regular USD perspective took gold 20% higher or so.
Summing up, signs of weakness continue as little evidence has been seen to refute this bearish sentiment. The resistance of the upper border of the long-term trading channel verifies that our points made previously are still valid and current. We will inform Subscribers immediately upon any development, which would make closing or adding to positions worth considering.
Silver
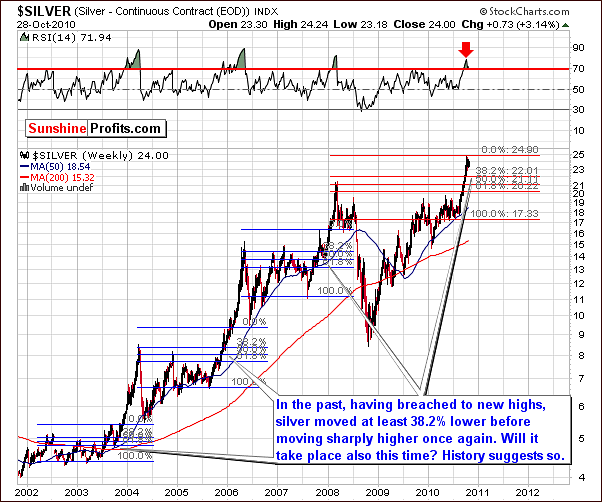
Very little new information is seen in the very long-term chart for silver this week. In the Premium Update issued two weeks ago, we stated that "based on past trends for similar length rallies, there is a good chance we will see a sharp decline in silver's price very soon given volume this big. A likely target level for this decline will be in the $20 to $21 range for the SLV ETF..."
The point to be made here is that based on long-term patterns, silver normally corrects at least to the 38.2% Fibonacci retracement level (based on the size of the rally that took silver to new highs) and then moves higher. For this reason, we expect a decline to the $22 level or lower and recent volume levels suggest that such a consolidation is indeed likely at this time.
Silver has followed gold's lead recently but is also greatly influenced by the general stock market trends. Expected declines have not yet been seen for stocks. Silver's decline is expected to accelerate when stocks decline and it appears at this time that late November is a likely timeframe for silver's next local bottom. The general stock market will have a great effect on the timing of silver's next local bottom.
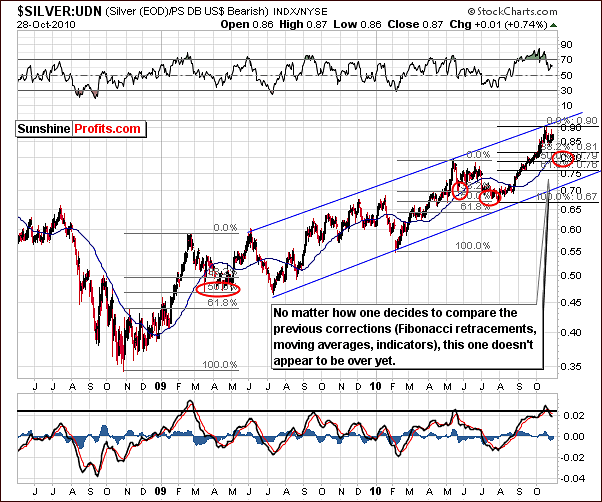
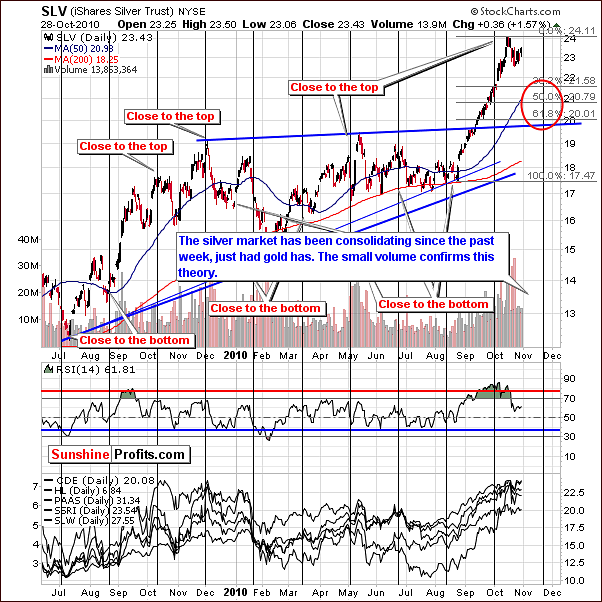
This week's non-USD chart once again provides additional support to a bearish sentiment for silver in the short-term. The 50-week moving average, Fibonacci retracement levels and a review of historical trends seen here support our belief that silver is likely to continue to move lower and has not yet reached a local bottom. Even without analyzing the above chart in a detailed way, one will see that the price of silver reached an important resistance level and the correction did not materialize - yet.
Summing up, the silver has been consolidating recently just as gold has. It is likely that the declines, which have been seen to this point, are not enough to correct the recent rally, which brought silver's price to new highs. Additional price declines are expected as it may be several weeks before silver reaches its next bottom.
Mining Stocks
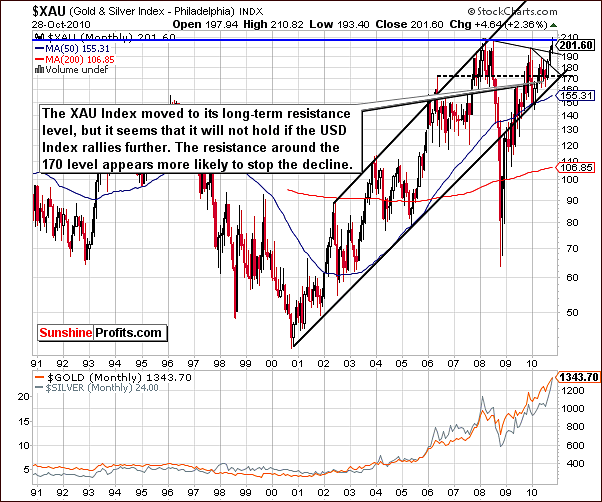
The XAU Index, which is a proxy for gold and silver stocks, bounced off an important 2008 high as visible on this very long-term chart. Since that time it has been consolidating and initial declines were followed by slight increases. Recent support levels have not been as strong in nature as the all-time high, which created the decline initially.
It's quite likely that this period of decline could be seen for some time before an eventual bottom is reached. The 170-level continues to be our best estimate at this time for the bottom of this index's current decline.

In this week's long-term HUI gold mining stocks chart, the medium-term support level has provided some support after gold stocks failed to move above previous highs. It is likely that a decline in gold prices will result in lower levels for this index as well. Volume levels during the past few days (as visible on the chart below) have not confirmed the higher index levels seen this week and preclude any bullish sentiment at this time.
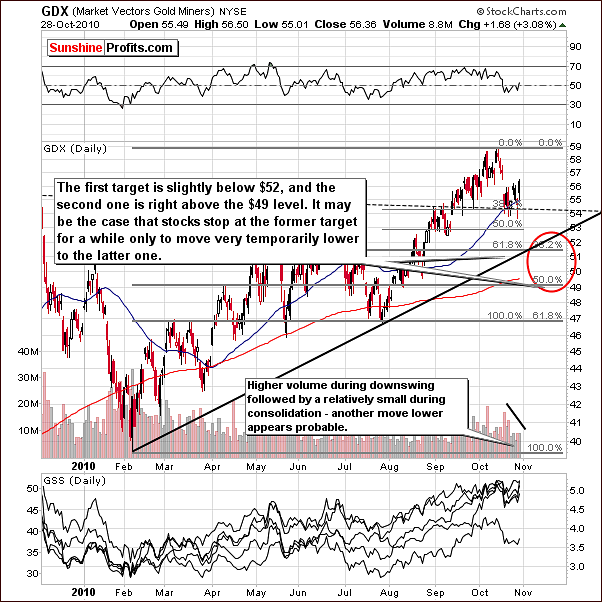
The GDX ETF chart this week shows recent consolidation following slight declines in price levels. This is similar to what we have previously discussed in the gold section. Volume levels have been quite small when compared to what we have seen during the decline. When this is taken into account, along with a flag formation price pattern, the suggestion is that a move to the downside is more likely upon completion of the current consolidation (flag) period. Further price declines of up to $5 appear likely, most likely soon after the GDX ETF moves decisively below the $54 level. Taking into account the rising support level leads us to a probable target level of around $52.
Summing up, mining stocks have been trending very much like gold and appear now to be consolidating. Analysis of historical trends and recent volume levels indicate further declines of about 10% are possible for the mining stocks in the coming weeks.
Letters from Subscribers
This week we'll continue our discussion about the application of technical analysis, which we began a few weeks ago. According to John Stepek, editor of MoneyWeek, The markets are currently being driven by investors trying to second-guess government policies. If he is right could quantitative, technical, and statistical analyses be completely overruled and become ineffectual?
Any analysis (fundamental, technical, cyclical, fractal, econometric model, etc.) can be suddenly overruled - but that is no reason to ignore them. At any time someone could trigger a massive rally or major selloff in any given market, provided that they have enough cash. Does that mean that we should not invest in anything as there are absolutely no sure bets?
In our view this approach is wrong because it confuses what's possible with what's probable. Instead we suggest taking what's probable (most of the time each of the systems of analyses mentioned above will be useful, and by combining them we'll get more information than we could by just using one of them) and position yourself accordingly.
Fundamentals are favorable for gold, silver and mining stocks. Dedicate a part of your capital to long-term investments. Market inevitably corrects from time to time - use charts and other tools to gain on most of them. Don't expect catching each move, as it's impossible to accomplish. Financial markets could be destroyed overnight if China dumps its dollar holdings or derivative holders worldwide default or the COMEX defaults, etc. There are plenty worst case scenarios. Be sure to own physical precious metals as well.
An additional question from one of our Subscribers was if it makes sense to bet on (short term) lower gold and silver prices given the effects of government policy such as more quantitative easing which leads to more money, higher prices and higher values of precious metals. There are two reasons it doesn't have to work in the way described above: the expectations of market participants, and investors' emotionality.
As far as expectations are concerned - what happens if the Fed decides to print $500bn? Will gold soar immediately? Not necessarily - it depends on what people were expecting to hear. If everyone believed that the Fed will print $100bn, then yes, this will be a positive shock to the market which will cause price to rally immediately. However, if people expected Fed to print $800bn or so, they will be surprised to see that the Fed had printed "only" $500bn, and some investors will sell their gold as it will have smaller appeal to them given lower-than-expected amount of money that had been printed.
If people had already "factored in" the huge amounts of money being printed, then once it is officially confirmed it doesn't necessarily have a positive effect on price in the short term.
Here's an example for how market emotionality can play out. If people didn't really believe that gold is worth over $1,200 but bought it at that price anyway just because they were afraid (!) that the market is going to irrationally get away from them, they will be happy to sell their holdings once the sharp rally takes a pause.
In short - quantitative easing is a positive fundamental factor for gold. However, we've had a positive fundamental situation in the precious metals for years now and corrections have taken place nonetheless.
Another question was about CFTC's (U.S. Commodity Futures Trading Commission) possible action and if should one still keep November silver miner puts.
Generally yes, as the market discounts the information about the possibility of the action taken by the CFTC, since it is generally known that such a possibility exists. Consequently, the price patterns that we analyze already include this information. Over the past 10 years there were many times when many investors expected a sudden surge in the price of the white metal based on COMEX default, big CFTC intervention etc. - yet, it did not take place. However, please note that corrections DID take place many times.
We are not saying that the above will not happen at some point. All we are saying is that there is a bigger chance that the market will behave in a "regular" way - meaning that no default and no big intervention will take place. How do we deal with that? We keep our physical holdings intact, while using speculative capital (in this case, options) for trade in case the market once again behaves in a "normal" way.
The next question was about mining stocks and when they will stop underperforming gold. Our Subscriber reminded us that in January Goldcorp was in the low to mid 40's and that it sits at the same price when the gold is $200 higher. When they will start to outperform?
We expect to see "fireworks" in the mining stocks once HUI and XAU indices take out their previous highs and verify this breakout. They tried to do that recently but failed. Taking the points made in this update and the seasonal tendencies present on the precious metals market, it seems that we might see this take place no later than in the first quarter of 2011. By the way, please note that our Leverage Calculators suggest that there are better mining companies than Goldcorp.
And finally, we received a question about possible mining stock pull back and should one take profits from juniors.
We're not there yet, but we might be close to the point when taking some profits off the table is a good idea. Last week in part of Premium Update dedicated to juniors we told our Subscribers to watch the SP Junior long-term indicator: "The SP Junior long-term indicator did not flash a sell signal (meaning switching from junior mining stocks to big senior gold and silver producers) yet, but since the indicator is presently above the horizontal dotted line, it is worth a closer look. As soon as a move lower in the general stock market (and juniors) will be seen and this indicator starts to decline, it will be a sell signal for juniors. We generally suggest using it to switch from juniors to seniors, but of course you are free to utilize this bearish junior signal in any way you see fit."
Our Subscriber also mentioned Jim Sinclair and Ted Butler as his source of additional guidance and admitted that he doesn't feel comfortable with reading charts himself.
While we respect both authors and believe that using the fundamental approach is necessary to keep track of the big economic picture and the general tendencies, we also think that using charts and applying various techniques is essential to assess the most profitable moments to enter or exit particular trades (even a 10-year investment is a kind of "trade" in a way). This is why our updates always include both parts.
Summary
Although much appears to have happened, very little has changed in the past week. Consolidation has been seen in the USD Index and volume levels seen in the UUP Index suggest higher values will be seen soon for the USD.
The general stock market has consolidated slightly and small price increases have also been seen on some days. Resistance levels have now been reached and indications are that lower values will be seen very soon. Daily volume levels support this bearish sentiment.
With positive correlation with stocks and negative correlation with the USD Index, gold, silver and mining stocks should continue to correct in the coming days and weeks. No big rally is expected until perhaps late November. Charts for gold and mining stocks confirm these points as a flag pattern appears to be emerging. We can expect short-term declines similar to what has been seen recently.
Juniors should be held at this time as we have not yet seen a confirmation of a general stock market decline yet. This development needs to be confirmed before any strong suggestion concerning exiting long-term positions can be seriously considered. Furthermore, our SP Long-term Junior Indicator has not given any sell signals as of this writing.
This completes this week's Premium Update.
Thank you for using the Premium Service. Have a great weekend and profitable week!
Sincerely,
Przemyslaw Radomski

