Briefly: in our opinion, full (250% of the regular size of the position) speculative short positions in gold, silver and mining stocks are justified from the risk/reward perspective at the moment of publishing this alert.
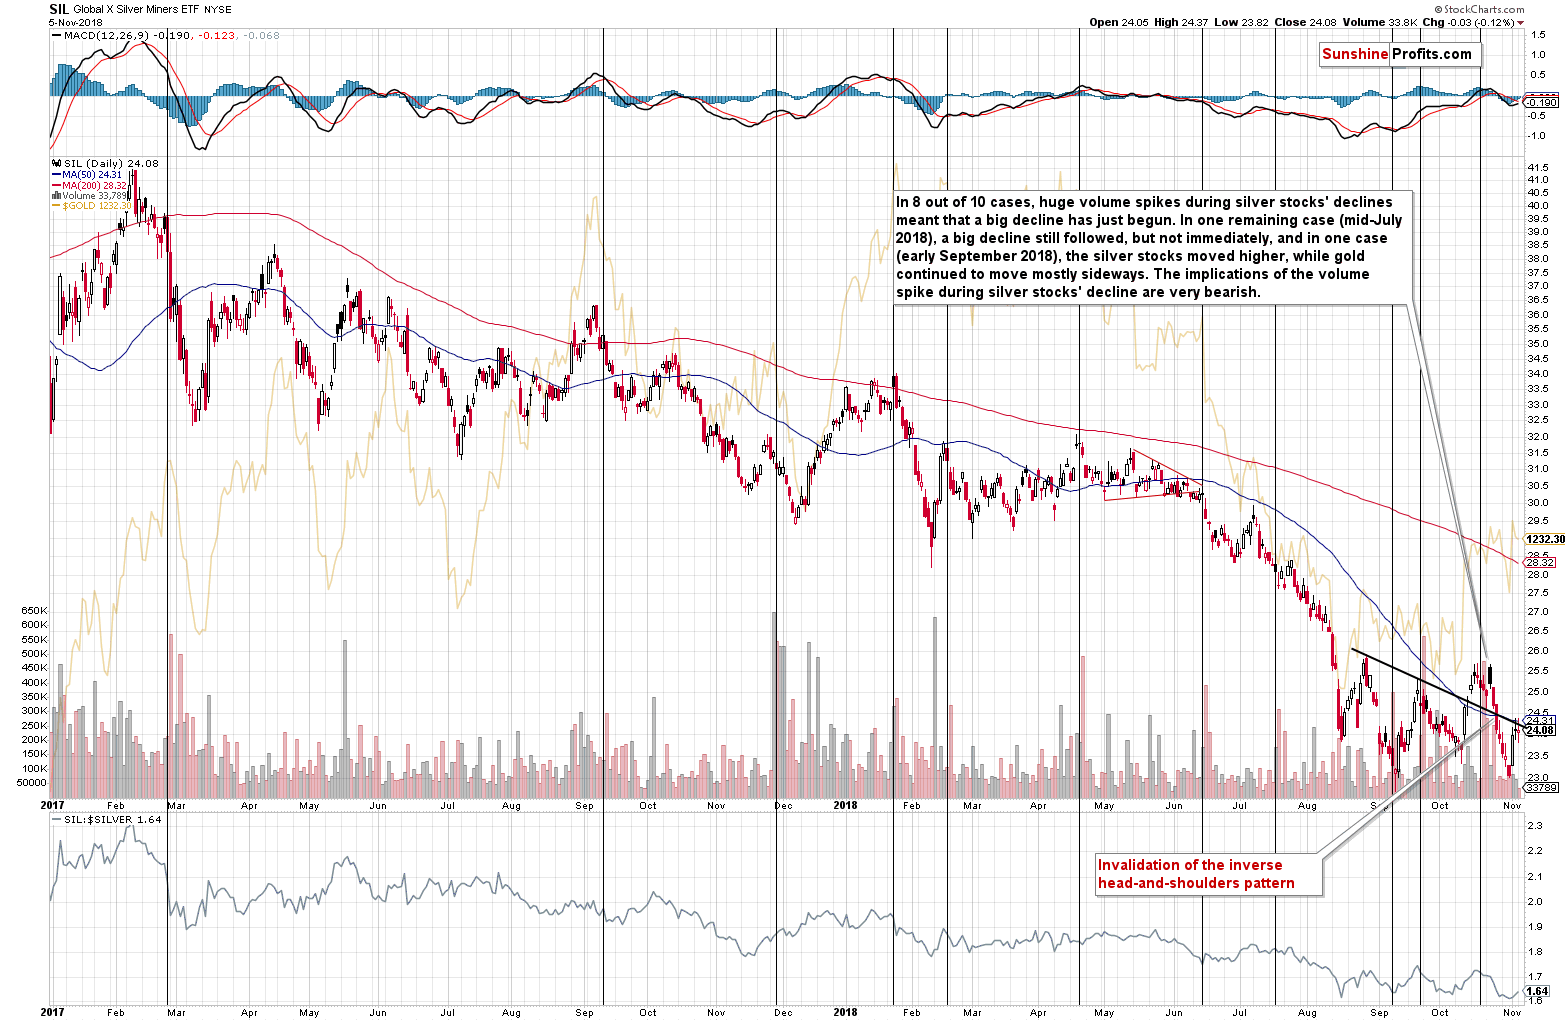
At the first sight nothing interesting happened yesterday, but this time, the first impression is a false one. Gold’s volume was extremely low, which tells us something about gold’s very near-term performance. Silver stocks provide us with an important signal with regard to the inverse head-and-shoulders pattern and gold’s relation with the general stock market, its volatility has important implications as well.
Not much happened in silver or mining stocks yesterday (back and forth trading and a small daily decline), so in today’s analysis, we’ll focus on the above. Let’s start with gold.
Gold’s Quiet Signal
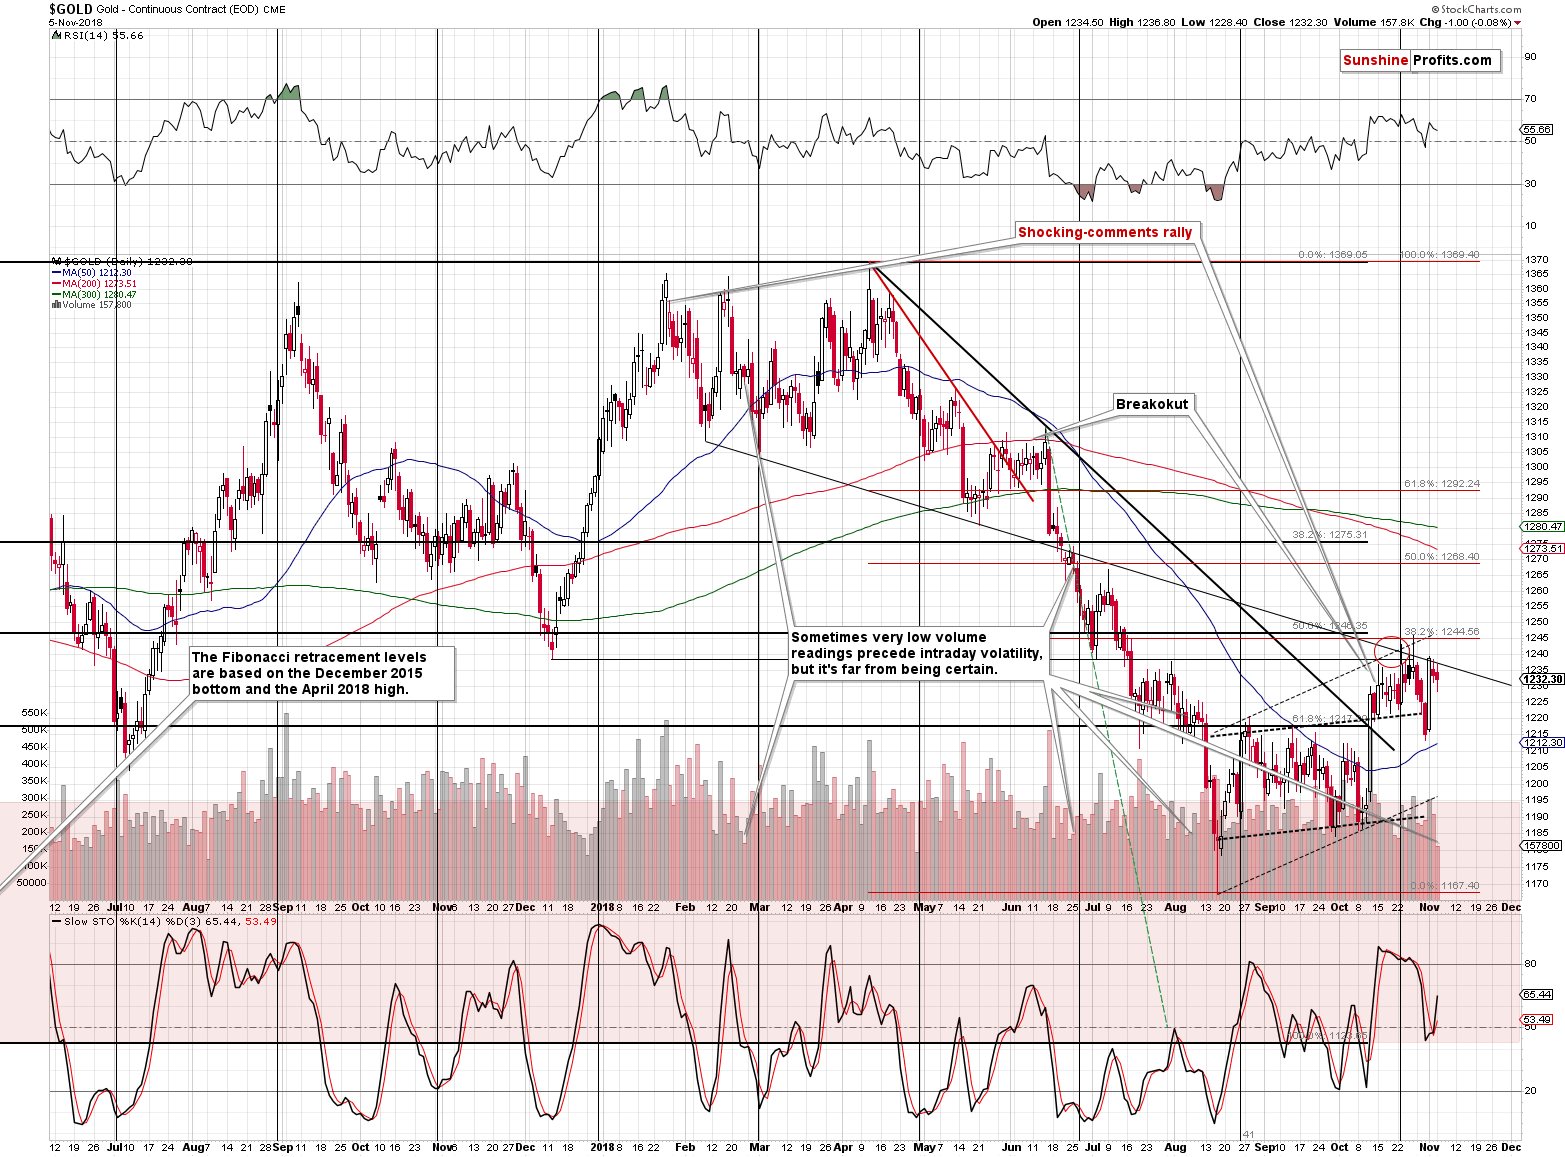
The price action is not particularly interesting, as gold declined by only $1. But, the volume in the yellow metal was particularly low. In fact, we haven’t seen gold decline on volume that low for many months. What does it mean and why did we see it?
Let’s start with the why. Naturally, it’s impossible to tell with 100% certainty why something happened on the market (except for the obvious, non-informative reply that it was because many people were not making transactions)
As we described yesterday, the tensions are high before the US elections. The flip side of the coin is that the investors are likely reluctant to make transactions before the elections as they prefer to wait and see what happens first. This would explain the low volume.
The implication is that this build-up in transactions that were not made but are planned may cause bigger volume today and in the rest of the week along with increased volatility. We saw something similar in late February 2018, when gold declined on very low volume. What followed was a quite sharp upswing that was invalidated before the end of the session. There are also bearish examples. For instance, in early August 2018, low volume readings were followed by a big decline.
There were also cases, when low volume was not followed by anything special, so the quality of the signal is not particularly high, but it’s important to keep the above in mind nonetheless. Why? So that any temporary price upswing doesn’t come as a surprise. Just like what we saw in February 2018, or like what we saw two years ago after Trump’s victory, the upswing would likely be very temporary. To be clear, even if we see a temporary upswing, we don’t expect it to be even close to the size of the upswing that followed Trump’s victory. The latter was a huge surprise to the markets and implications appeared very significant. We are unlikely to get a big surprise this time and the implications will not be as significant the previous ones.
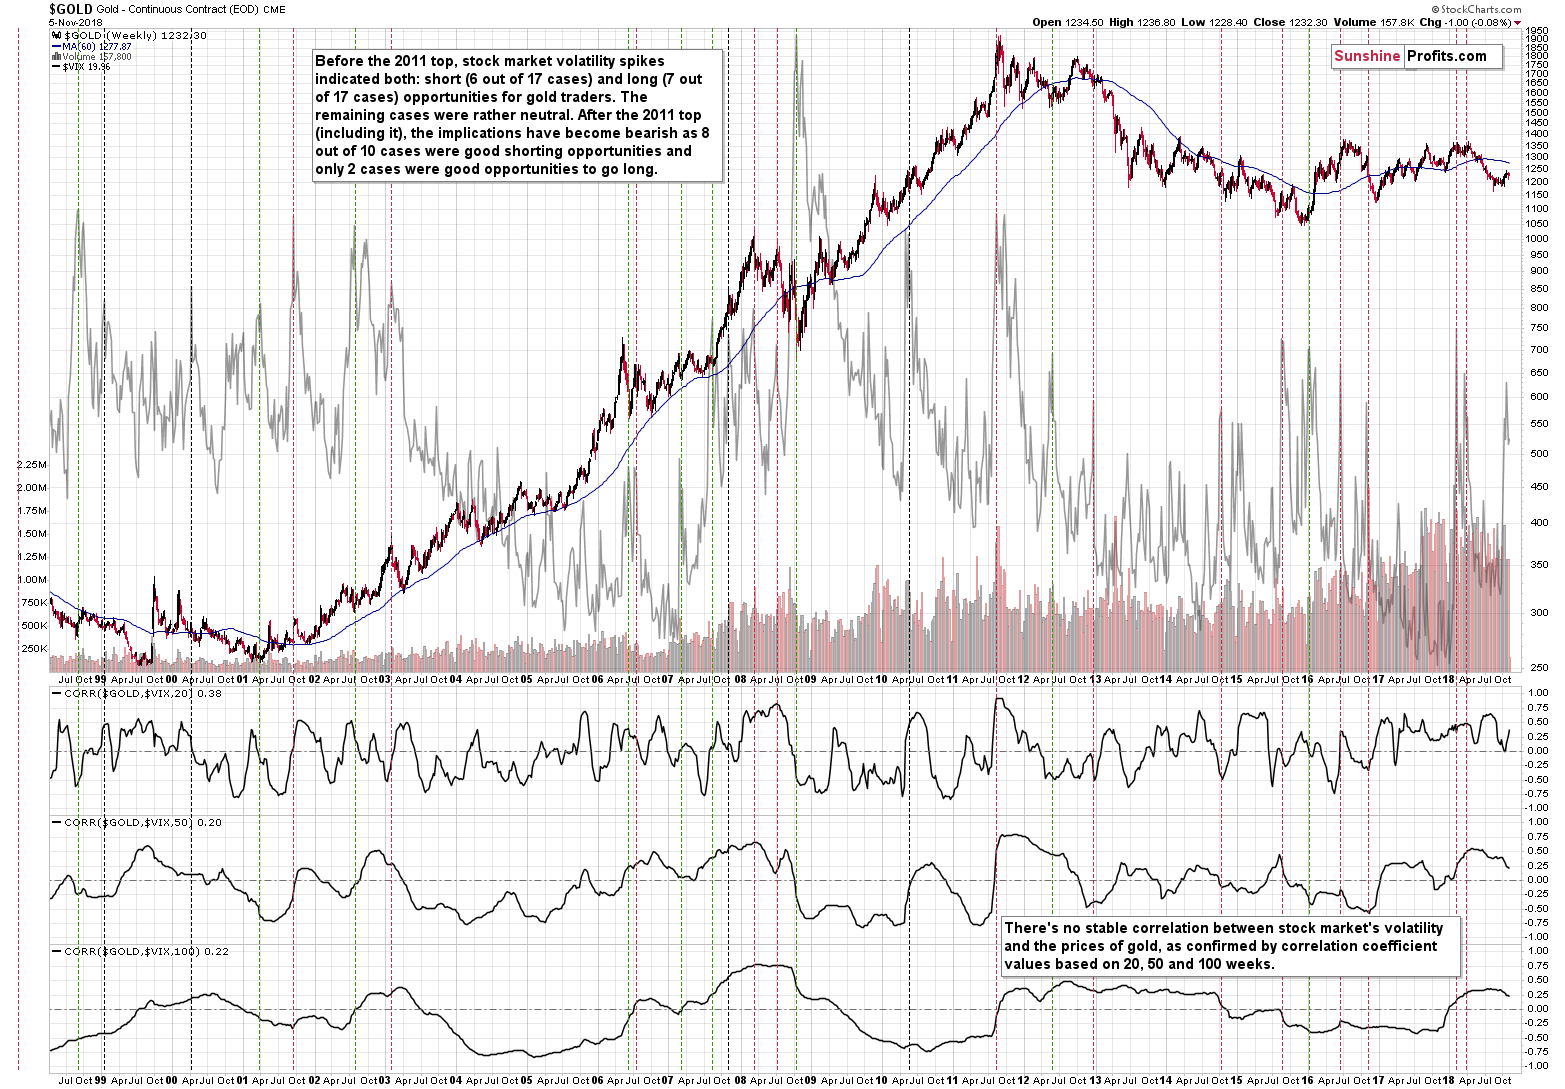
The more important implication of the US elections is that they will be over soon. Sounds trivial, but it’s important that the tensions will subside. It’s likely one of the main factors that’s been preventing the precious metals market from declining. The other is the volatility in the stock market. Speaking of the volatility, let’s take a look at gold’s performance compared to the one of the VIX volatility index.
Gold and Stocks – Strong Implications of Reliable Signals
After the 2018 top, almost all spikes in stock volatility meant also tops in the price of gold. The size of the current spike in volatility is in line with the ones that we saw in the past several years, which is one of the signs that the increase in the volatility is already over. The other sign is the simple fact that VIX is already moving lower. There were very few back-and-forth trading patterns in the index – once it spiked, the rally in it was over. AT least in the majority of cases, especially in the recent years.
Combining the above points strongly suggests that the rally in gold is most likely already over from the medium-term point of view. There may be back and forth trading of insignificant magnitude, but it’s not likely to change the main implication. And the implication is that gold is likely starting another big move down.
Looking at gold and stocks from a different point of view - through their ratio – also suggests that the corrective rally in gold is over.
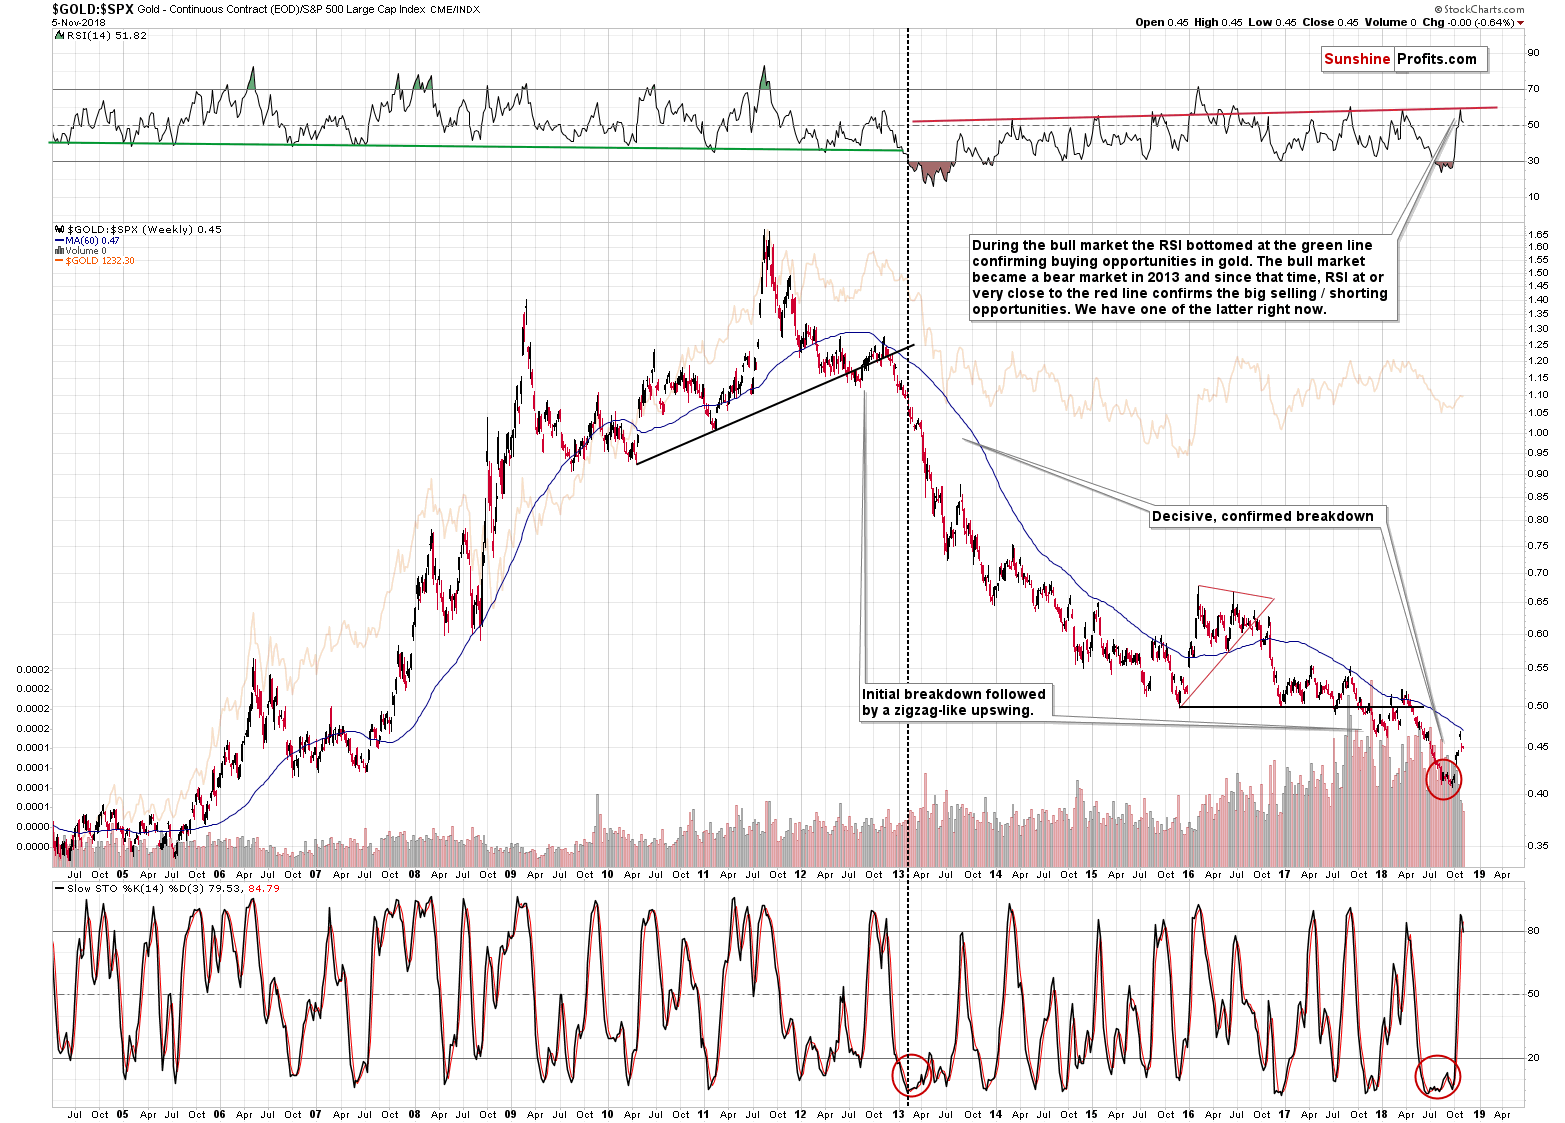
The gold to stocks ratio broke below its key support earlier this year and it’s currently verifying the breakout by moving back to this line. This corrective upswing makes the situation less similar to what it was in 2013, but it doesn’t change the bearish implications. After all, in 2013, gold was only 2 years after a parabolic upswing and right now it’s after a few years of boring sideways trading pattern. Consequently, it’s not that surprising that the decline in the ratio also takes its time instead of being as volatile as it was in 2013. So, instead of a huge downswing in the ratio, we get another corrective upswing that already caused the Stochastic indicator to move above the 80 level and then flash a sell signal.
But, the reason that we feature the above chart is not to emphasize the above, but to show you a quite coherent and very interesting analogy in the RSI Index.
Before the 2013 decline, the RSI had a floor level that we marked with green. Whenever RSI moved to or very close to it, it was a great buying opportunity for gold. But, since 2013 it works differently. During the current medium-term decline, there is a cap instead of a floor. We marked it with red and it works in the opposite way to the previous floor.
Namely, whenever the RSI moves to the cap level, there is a good opportunity in gold to exit the long positions and/or enter the short ones. The only exception was during the 2016 rally – all other cases followed the above rule. And guess what – the RSI is flashing this “go short” signal once again, pointing to a big decline ahead.
Gold is visibly below $1,250, and the signal is just as strong as it was when gold topped above $1,350. Similar or even bigger declines than the ones that followed the 2017 and 2018 tops appear likely.
Let’s move away from gold and take a look at the precious metals market from a different angle.
Enter silver stocks.
Silver Miners and the Inverse H&S
The silver miners declined after the huge-volume-spike signal just like we expected them to, but the key thing that we would like to emphasize is their position relative to the previous inverse head-and-shoulders pattern. It was invalidated in case of both: gold stocks and silver stocks. But, while the HUI Index is once again above the neck level of the pattern, the silver miners are not. This means that even though there are some points of view, in which the formation appears to remain intact (the GDX ETF), it really shouldn’t be trusted. There is no formation to speak of in case of silver stocks anymore, and the HUI Index has already invalidated the formation, so even though the price is once again above the neck level, it doesn’t make the picture truly bullish even for the short term.
Before summarizing, we would like to address questions that we received about the inverse head-and-shoulders patterns.
We’ll start with the question that we will not address directly, because we have already done so several times in the past and our explanation remains up-to-date. The question was about the possible bullish implications of the big, long-term inverse head-and-shoulders in gold. That’s the same argument that we’ve been reading for years. Yes, years. Here’s a discussion of this formation and its implications (lack thereof) from September, 2007.
Instead of once again saying why it’s a logical error to use an incomplete pattern and state that it has any implications, we will do something else. We’ll discuss the extremely bearish implications of gold’s breakdown below the 2015 lows.
Gold’s Breaks Below the 2015 Bottom!
Gold breaking below the 2015 lows is a clearly bearish development of epic significance. The December 2015 low is the clearest bottom that we see on gold’s long-term chart and it’s almost guaranteed that all investors are aware of it. And if they are not, they are hearing about the breakdown from the media. Indeed, the move below the 2015 low was so clear that the forgotten metal – gold – got the attention of the major financial websites. In fact, it’s being discussed in the non-financial media as well. This ensures that all the investors have the chance to react and get scared by declining prices… And contribute to the decline even more.
The decline has been volatile, but based on the above, the sharpness of the decline could increase even further, thus causing gold to take a quick dive to $900, or even a bit below.
The implications are extremely bearish and very clear.
- Umm… Wait, shouldn’t you wait for the breakdown to really take place before saying that anything changed?
- Why would we? We clearly see that gold is breaking below the 2015 lows.
- But it didn’t break below it. It’s above $1,200 and the 2015 bottom is about $150 lower. The breakdown has no implications because it’s simply not here, and not even close to being here!
There’s not a single doubt that it’s ridiculous to act on implications of a breakdown below the 2015 lows that didn’t happen and that’s not even close to happening. And it’s exactly just as ridiculous with an inverse head-and-shoulders formation.
The neck level of the would-be formation is at about $1,360. It’s more than $100 away from the current gold price. It’s not even close to being completed. And yet, people insist on applying the incomplete pattern.
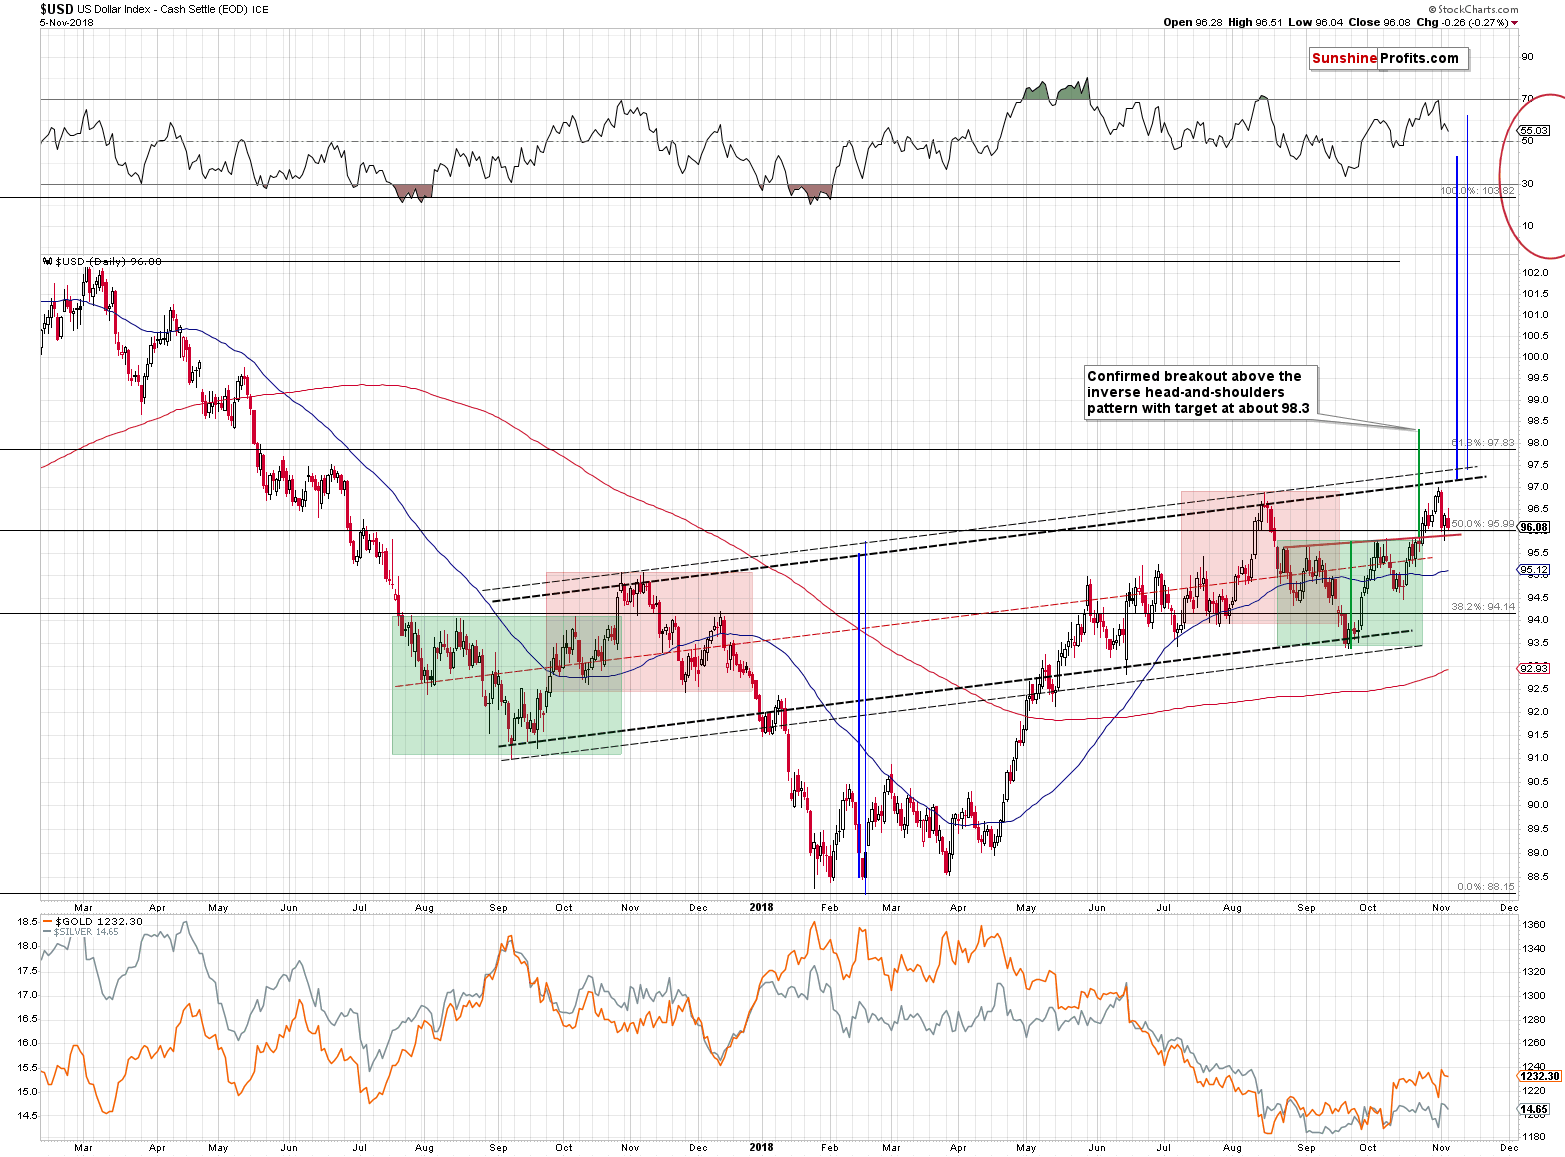
The other question was about also about the inverse head-and-shoulders pattern. This time it was about the one that is being formed in the USD Index (the medium-term one that is not completed yet).
Inverse H&S in the USD Index - Too Slanted?
The question was if it’s not too slanted to be reliable. In short, it’s not even close to being too slanted. Naturally, if one features it on a chart that suppresses the time axis then it will be very slanted, but that’s not the point. In normal scale, the upward slope of the neckline of the pattern is reasonable and doesn’t appear to invalidate anything.
There are a multiple definitions of the H&S patterns, but it’s hard to find a definition that would penalize the formation for not having shoulder extremes at identical height. Most likely all of them point to any implications of the formation only after it’s completed, though.
There is an interesting note on Stockcharts’ definition:
Neckline: The neckline forms by connecting low points 1 and 2. Low point 1 marks the end of the left shoulder and the beginning of the head. Low point 2 marks the end of the head and the beginning of the right shoulder. Depending on the relationship between the two low points, the neckline can slope up, slope down or be horizontal. The slope of the neckline will affect the pattern's degree of bearishness—a downward slope is more bearish than an upward slope. Sometimes more than one low point can be used to form the neckline.
The above is about the regular H&S pattern as the website doesn’t have a specific definition for the inverse H&S, but it’s safe to assume that in case of the inverse pattern, the fragment that we put in bold would be:
The slope of the neckline will affect the pattern's degree of bullishness—an upward slope is more bullish than a downward slope.
One might ask if there is a point after which the pattern becomes too slanted, and this might be the case, but it would be at much more extreme examples than the one that we currently see in the USDX.
Interestingly, this doubt becomes ridiculous if it accompanied by one’s conviction of the meaningful nature of the recent inverse H&S in the gold stocks.
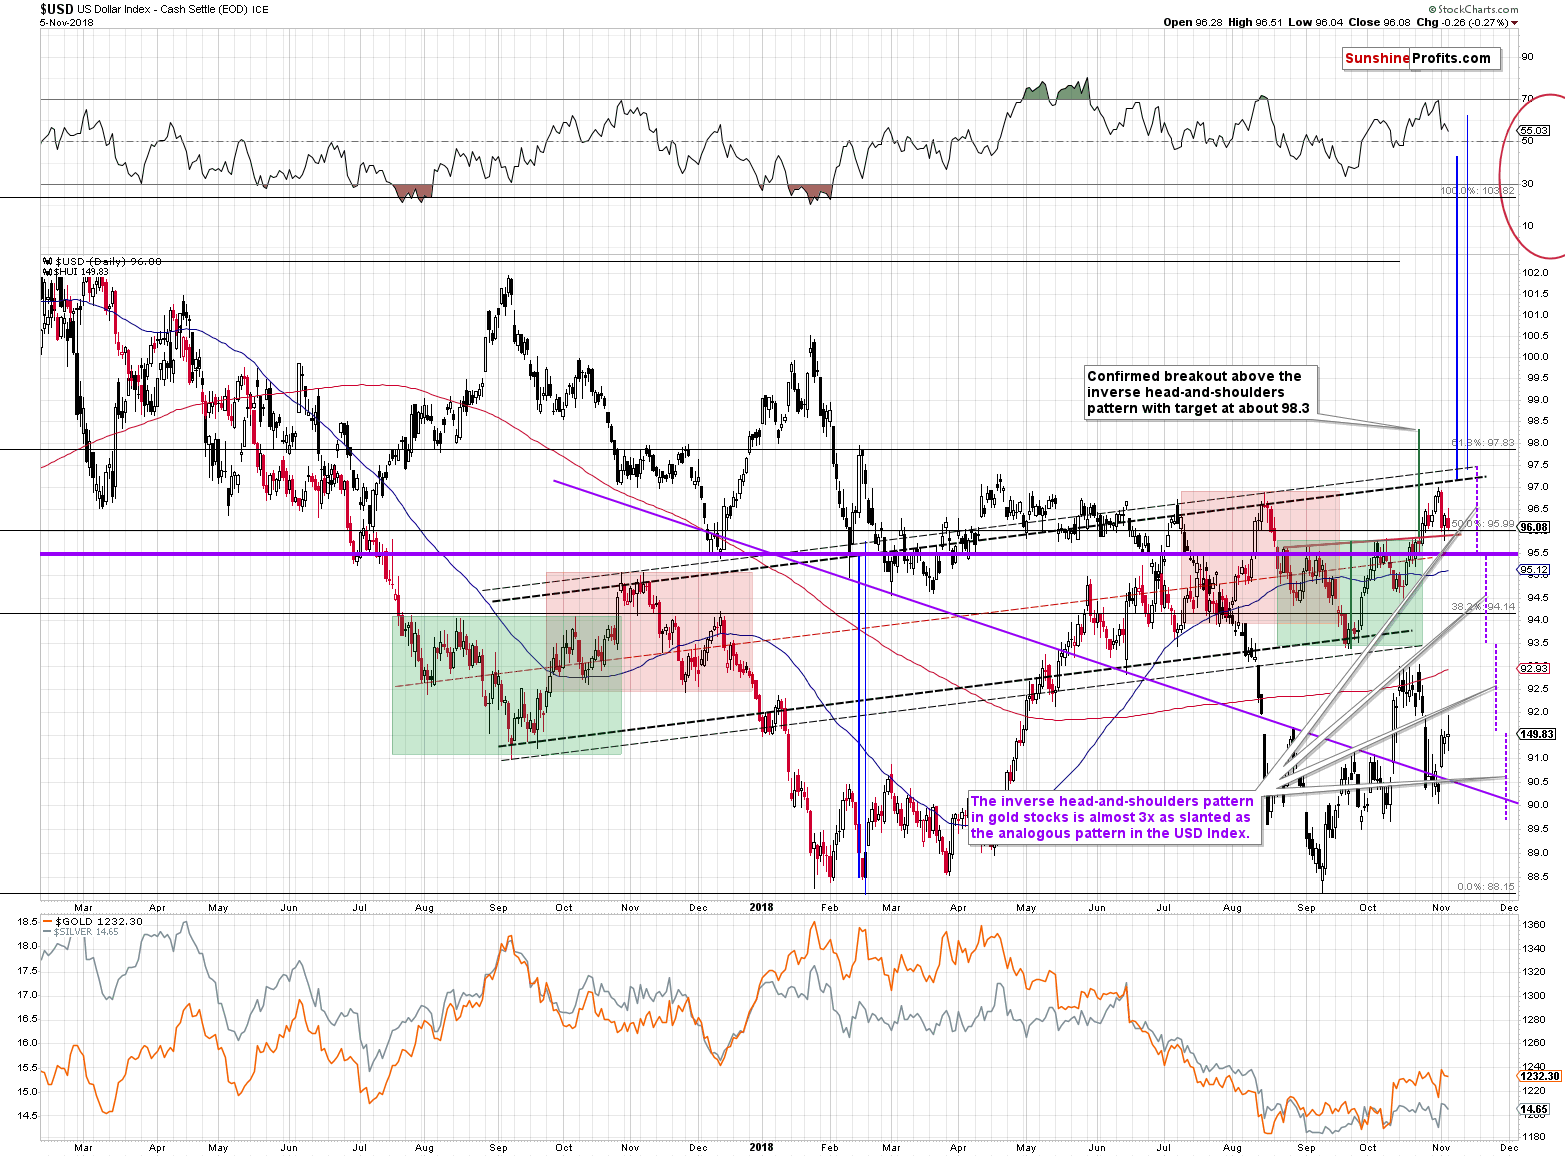
The above chart features the HUI Index (proxy for gold stocks) in the background; it’s marked with black candlesticks.
The time scale is identical, so the slant of both inverse H&S patterns is comparable. The neck level of the USDX pattern is marked with rising blacked dashed lines. We’ll use the thin dashed black line as it’s based on the intraday prices. The purple declining line the neckline (and its extensions) of the pattern in gold stocks.
At the first sight it’s clear that the neckline of the inverse H&S in the gold miners is more slanted than the one in the USD Index, but to be sure, we created the horizontal thick purple line and we put it at the necklines’ intersection. We then marked the distance between it and both lines with identical purple dashed vertical lines. This comparison allows us to see that the slant of the neckline of the inverse H&S pattern in gold stocks is more than twice the slant of the neckline of the inverse H&S pattern in the USD Index.
Consequently, if one wants to say that one of these patterns could be invalid because of its slant, it would be the pattern in mining stocks, not the one in the USD Index.
Important Analyses
Before summarizing, we would like to emphasize that we have recently posted several analyses that are very important and that one should keep in mind, especially in the next several weeks. If you haven’t had the chance of reading them previously, we encourage you to do so today:
- Dear Gold Investor - Letters from 2013 - Analogy to 2013, which should make it easier to trade the upcoming sizable upswing (if enough factors point to it, that is) and to enter the market close to the final bottom.
- Gold to Soar Above $6,000 - discussion of gold’s long-term upside target of $6,000.
- Preparing for THE Bottom in Gold: Part 6 – What to Buy - extremely important analysis of the portfolio structure for the next huge, multi-year rally in the precious metals.
- Preparing for THE Bottom in Gold: Part 7 – Buy-and-hold on Steroids - description of a strategy dedicated to significantly boosting one’s long-term investment returns while staying invested in the PM sector.
- Gold’s Downside Target, Upcoming Rebound, and Miners’ Buy Plan - details regarding the shape of the following price moves, a buying plan for mining stocks, and a brief discussion of the final price targets for the current decline.
- Gold: What Happened vs. What Changed - discussion of the latest extreme readings from gold’s CoT report
- Key Factors for Gold & Silver Investors - discussion of key, long-term factors that support the bearish outlook for PMs. We are often asked what makes us so bearish – this article is a reply to this question.
- The Upcoming Silver Surprise - two sets of price targets for gold, silver and mining stocks: the initial and the final one.
- Precious Metals Sector: It’s 2013 All Over Again - comparison between 2013 and 2018 throughout the precious metals sector, the general stock market and the USD Index. Multiple similarities point to the repeat of a 2013-style volatile decline in the PMs.
- Changing One's Mind - Why, When, and How – discussing the way of analyzing the market that helps to stay focused on growing one’s capital while not being influenced by the loss aversion bias. This essay might be particularly useful in light of the recent upswing in the PMs.
- Inverse H&S Patterns and Something Even More Extreme - gold targets for the current decline in terms of price and time.
Summary
Summing up, the outlook remains strongly bearish for the precious metals sector and the fact that PMs are not yet responding to the USD’s strength doesn’t invalidate it. The current back and forth trading is tiring, and/or boring depending on one’s perspective (tiring from the short-term perspective, and boring from the long-term one), but it’s very likely that the patience here will be well rewarded. Silver’s outperformance and miners’ underperformance suggests that we will likely not have to wait much longer, especially that the US-elections-driven tensions are likely to subside shortly.
As always, we’ll keep you – our subscribers – informed.
To summarize:
Trading capital (supplementary part of the portfolio; our opinion): Full short positions (250% of the full position) in gold, silver and mining stocks are justified from the risk/reward perspective with the following stop-loss orders and exit profit-take price levels:
- Gold: profit-take exit price: $1,062; stop-loss: $1,257; initial target price for the DGLD ETN: $82.96; stop-loss for the DGLD ETN $49.27
- Silver: profit-take exit price: $12.72; stop-loss: $15.76; initial target price for the DSLV ETN: $46.97; stop-loss for the DSLV ETN $27.37
- Mining stocks (price levels for the GDX ETF): profit-take exit price: $13.12; stop-loss: $20.83; initial target price for the DUST ETF: $80.97; stop-loss for the DUST ETF $27.67
Note: the above is a specific preparation for a possible sudden price drop, it does not reflect the most likely outcome. You will find a more detailed explanation in our August 1 Alert. In case one wants to bet on junior mining stocks’ prices (we do not suggest doing so – we think senior mining stocks are more predictable in the case of short-term trades – if one wants to do it anyway, we provide the details), here are the stop-loss details and target prices:
- GDXJ ETF: profit-take exit price: $17.52; stop-loss: $31.23
- JDST ETF: initial target price: $154.97 stop-loss: $51.78
Long-term capital (core part of the portfolio; our opinion): No positions (in other words: cash)
Insurance capital (core part of the portfolio; our opinion): Full position
Important Details for New Subscribers
Whether you already subscribed or not, we encourage you to find out how to make the most of our alerts and read our replies to the most common alert-and-gold-trading-related-questions.
Please note that the in the trading section we describe the situation for the day that the alert is posted. In other words, it we are writing about a speculative position, it means that it is up-to-date on the day it was posted. We are also featuring the initial target prices, so that you can decide whether keeping a position on a given day is something that is in tune with your approach (some moves are too small for medium-term traders and some might appear too big for day-traders).
Plus, you might want to read why our stop-loss orders are usually relatively far from the current price.
Please note that a full position doesn’t mean using all of the capital for a given trade. You will find details on our thoughts on gold portfolio structuring in the Key Insights section on our website.
As a reminder – “initial target price” means exactly that – an “initial” one, it’s not a price level at which we suggest closing positions. If this becomes the case (like it did in the previous trade) we will refer to these levels as levels of exit orders (exactly as we’ve done previously). Stop-loss levels, however, are naturally not “initial”, but something that, in our opinion, might be entered as an order.
Since it is impossible to synchronize target prices and stop-loss levels for all the ETFs and ETNs with the main markets that we provide these levels for (gold, silver and mining stocks – the GDX ETF), the stop-loss levels and target prices for other ETNs and ETF (among other: UGLD, DGLD, USLV, DSLV, NUGT, DUST, JNUG, JDST) are provided as supplementary, and not as “final”. This means that if a stop-loss or a target level is reached for any of the “additional instruments” (DGLD for instance), but not for the “main instrument” (gold in this case), we will view positions in both gold and DGLD as still open and the stop-loss for DGLD would have to be moved lower. On the other hand, if gold moves to a stop-loss level but DGLD doesn’t, then we will view both positions (in gold and DGLD) as closed. In other words, since it’s not possible to be 100% certain that each related instrument moves to a given level when the underlying instrument does, we can’t provide levels that would be binding. The levels that we do provide are our best estimate of the levels that will correspond to the levels in the underlying assets, but it will be the underlying assets that one will need to focus on regarding the signs pointing to closing a given position or keeping it open. We might adjust the levels in the “additional instruments” without adjusting the levels in the “main instruments”, which will simply mean that we have improved our estimation of these levels, not that we changed our outlook on the markets. We are already working on a tool that would update these levels on a daily basis for the most popular ETFs, ETNs and individual mining stocks.
Our preferred ways to invest in and to trade gold along with the reasoning can be found in the how to buy gold section. Additionally, our preferred ETFs and ETNs can be found in our Gold & Silver ETF Ranking.
As a reminder, Gold & Silver Trading Alerts are posted before or on each trading day (we usually post them before the opening bell, but we don't promise doing that each day). If there's anything urgent, we will send you an additional small alert before posting the main one.
=====
Latest Free Trading Alerts:
Today, Americans are choosing new members of Congress. Will there be a blue wave? Or maybe red? Some people say that hot economy will help Republicans – is that true? Let’s read out today’s article about the latest US nonfarm payrolls and find out how could they affect the mid-term elections and the gold market.
Blue or Red Wave? Or Maybe a Gold One?
=====
Thank you.
Sincerely,
Przemyslaw Radomski, CFA
Editor-in-chief, Gold & Silver Fund Manager
Gold & Silver Trading Alerts
Forex Trading Alerts
Oil Investment Updates
Oil Trading Alerts


