Briefly: In our opinion, full (150% of the regular full position) speculative short positions in gold, silver and mining stocks are justified from the risk/reward perspective at the moment of publishing this alert.
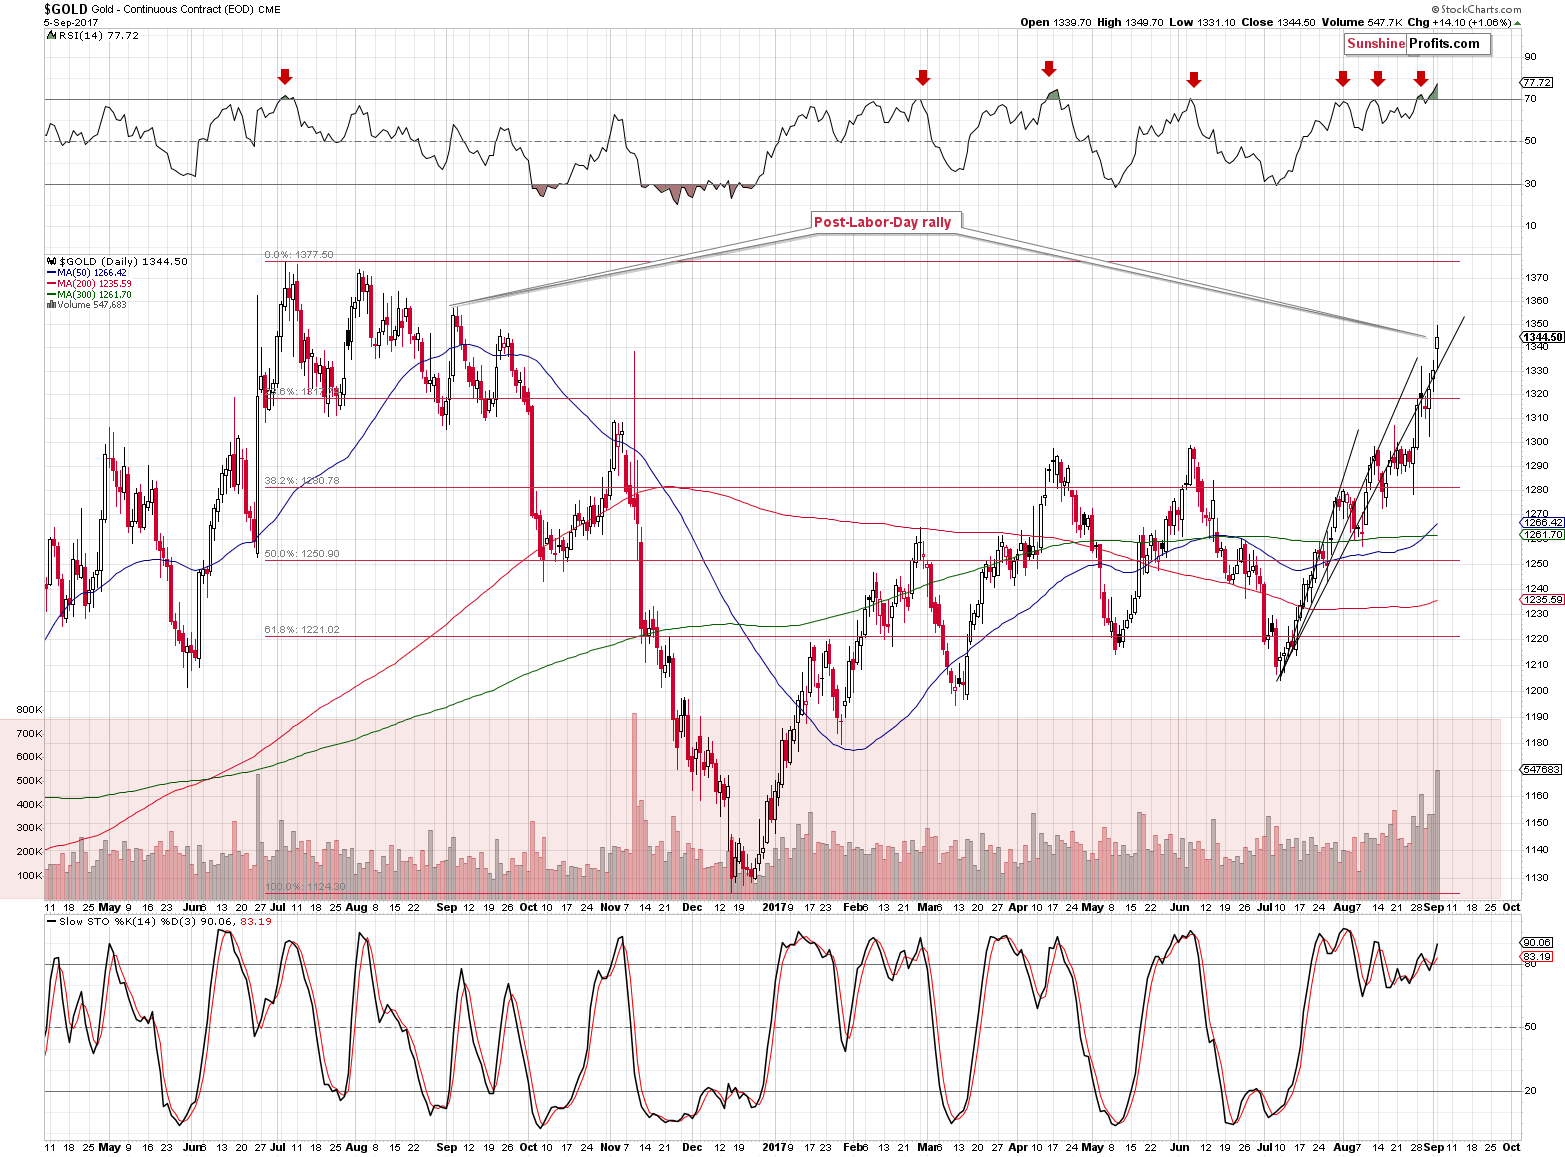
It was not so long ago, when we wrote about the record-breaking volume in gold. We described the implications of the extreme monthly volume and we discussed the very high readings in case of the individual sessions. We even described these sessions as the most important sessions of the year – at that time. Well, “at that time” those volume readings were extreme, but what we saw yesterday made the previous sessions seem regular. Yesterday’s volume in gold was never seen before during a daily upswing. The volume was even higher than the one that accompanied the results of the Brexit voting.
Let’s take a look at gold’s chart for details (chart courtesy of http://stockcharts.com).

Gold is after a sizable rally, so at this point it would be natural to expect the huge volume to indicate a reversal. This, by itself, does not make it strong bearish factor, but taking into account the current time, does. Yesterday’s session was the first one after the Labor Day. In yesterday’s alert, we discussed the implications thereof in the following way:
- 2011: gold plunged about $300
- 2012: gold moved higher at the beginning of September and shortly thereafter formed the key top – the one that started the biggest decline of the past decades
- 2013: gold declined about $200
- 2014: gold’s decline was underway, but still declined over $100 after the Labor Day
- 2015: rather sideways trading followed by a sharp decline in the final part of the year
- 2016: daily rally right after the Labor Day that started a $200+ decline.
The implications here are clearly bearish – almost always huge declines started either immediately or shortly after the Labor Day. This kind of efficiency alone is something that should make one considering opening the short positions in the precious metals market even without taking into account the situation in the USD Index.
Today, we would like to add more details to the above. Namely, last year, the session that marked the final top before the plunge was not approximately after the Labor Day – it was exactly the first session thereafter. Higher gold prices were not seen since that time. Of course, one might say that one swallow doesn’t make a summer and that could have been just a coincidence. However, there is something that most analysts currently seem to forget…

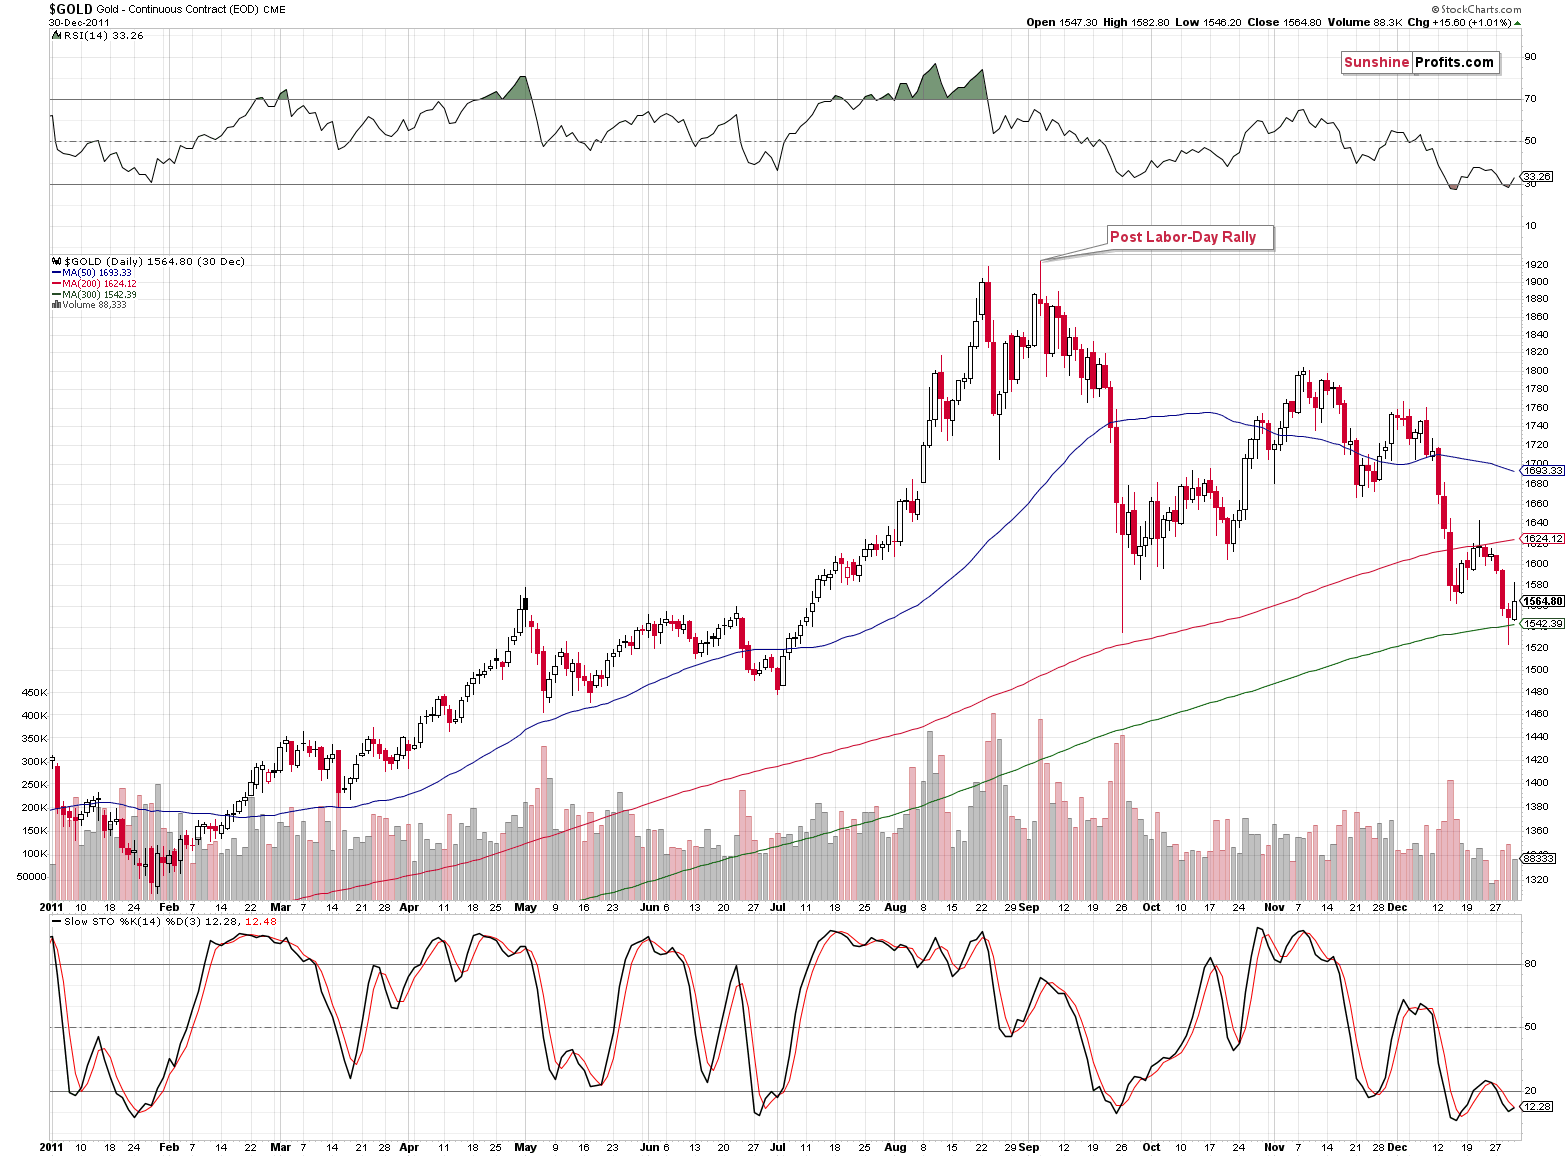
It was the single session after the Labor Day in 2011 that marked THE top after a decade-long rally in gold. Does it still look like a coincidence? The volume that accompanied the 2011 post-Labor-Day top was extreme, which is yet another similarity to the current situation. Gold also moved a bit above the previous intraday high, but not significantly so – just like gold performed relative to the post-Trump-election high.
The current situation is very similar to the previous post-Labor-Day tops. Consequently, gold rallying on record-breaking volume after a sizable rally right after the Labor Day is something that is very likely to be followed by declines – not significant rallies.
Also, based on the size of the previous rally, the time for the current one is up – the 3 rising, black lines on the previous chart apply the sizes of the initial 2016-2017 rallies (ending in January and February) to the rally that started in July. Based on the yesterday’s upswing, it seems that even if (which is not likely) gold was to rally further, it should take a bigger breather before it does. Based on the long-term factors, it doesn’t seem that it would not be just a breather, but a major downswing, but still – regardless of the above, a short-term decline appears likely either way.
The significantly increased interest in gold confirms it. In yesterday’s alert, we wrote the following:
Before moving to charts we would like to add that we have also seen a lot of non-price and non-volume confirmations that an important top is being formed – the number of messages with questions regarding gold (and the wording that was used in them) that we received (including phone calls from friends that are generally not interested in the markets at all) was not typical. The interest in gold has definitely increased in the last week or so.
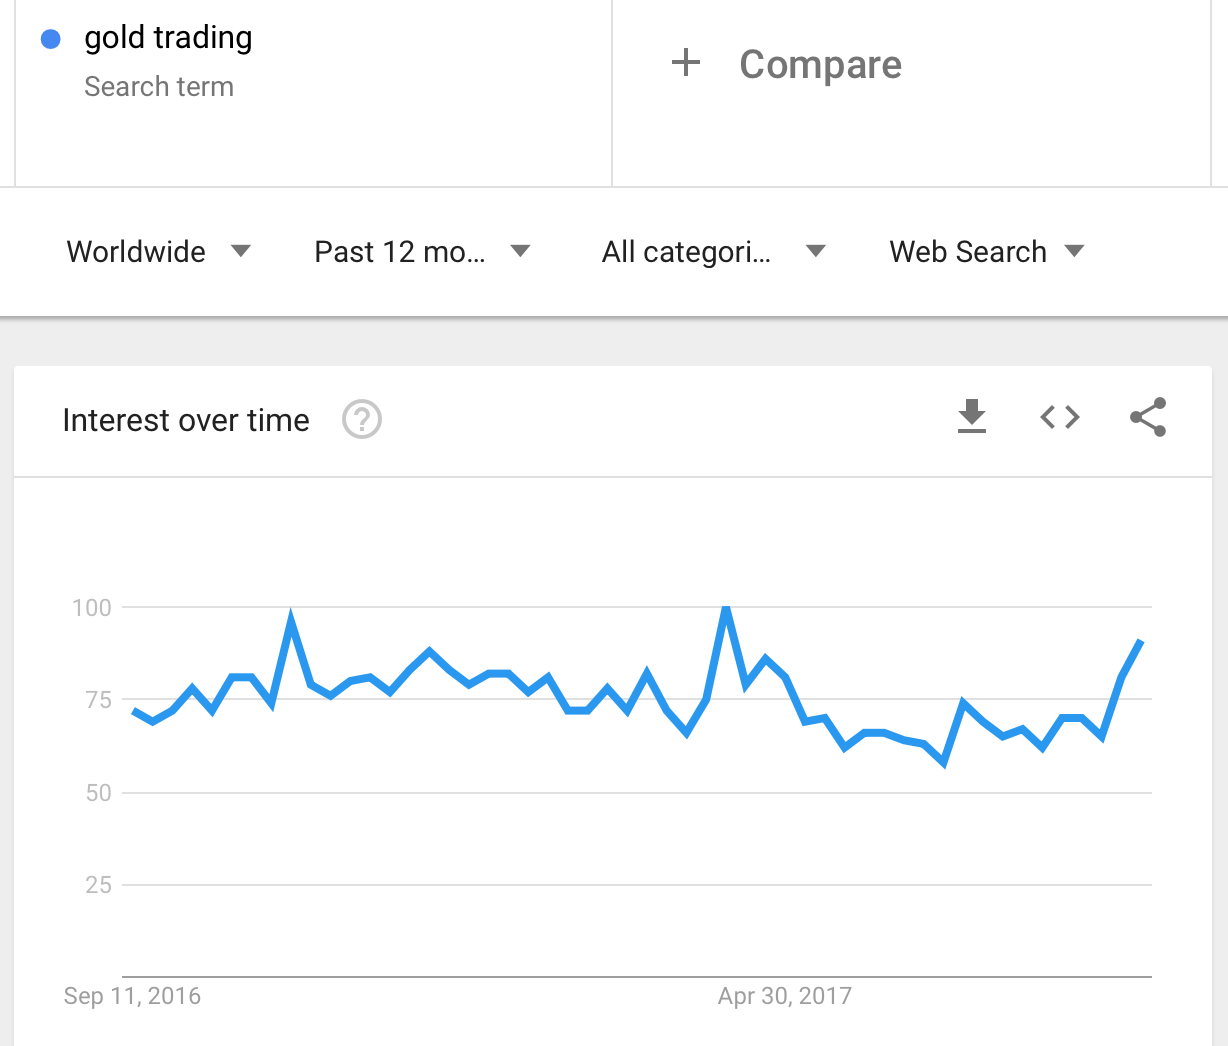
In today’s analysis, we would like to add a chart that illustrates the above.

The above chart features data from Google Trends – it shows how often people were searching for the phrase “gold trading” in the past 12 months. There are 3 cases when the interest spiked: now, in the April 9 – April 15 2017 week and in the November 6 – November 12 2016 week. In both cases: in April 2017 and in November 2016 we saw major tops in gold and the same is likely to be seen this time.
Summing up, at the first sight, the situation on the precious metals market appears to have become much more bullish based on the most recent price action, however, looking at these developments from a broader perspective, reveals that the recent upswings are likely to be just temporary. The analysis of the previous North-Korean-based price swings suggests that their implications will disappear relatively quickly. At the same time, the post-Labor-Day seasonality is likely to kick in, and since in almost all cases, huge declines in gold followed in the previous years, the same is very likely to happen this year. In particular, the two most important analogies (last year being the closest analogy and 2011 being the most significant year for the gold investors) suggest that the top is already in or is very likely to be in this week. The last month’s volume in gold confirms that and the same goes for the sudden increase in the interest in gold trading.
We are moving the stop-loss for gold higher, but not much higher (in case of the positions that were closed automatically overnight, it seems that re-entering them would be justified).
As always, we will keep you – our subscribers – informed.
To summarize:
Trading capital (supplementary part of the portfolio; our opinion): Short positions (150% of the full position) in gold, silver and mining stocks are justified from the risk/reward perspective with the following stop-loss orders and initial target price levels / profit-take orders:
- Gold: initial target price level: $1,063; stop-loss: $1,366; initial target price for the DGLD ETN: $81.88; stop-loss for the DGLD ETN $38.74
- Silver: initial target price: $13.12; stop-loss: $19.22; initial target price for the DSLV ETN: $46.18; stop-loss for the DSLV ETN $17.93
- Mining stocks (price levels for the GDX ETF): initial target price: $9.34; stop-loss: $26.34; initial target price for the DUST ETF: $143.56; stop-loss for the DUST ETF $16.78
In case one wants to bet on junior mining stocks' prices (we do not suggest doing so – we think senior mining stocks are more predictable in the case of short-term trades – if one wants to do it anyway, we provide the details), here are the stop-loss details and initial target prices:
- GDXJ ETF: initial target price: $14.13; stop-loss: $45.31
- JDST ETF: initial target price: $417.04; stop-loss: $31.68
Long-term capital (core part of the portfolio; our opinion): No positions (in other words: cash)
Insurance capital (core part of the portfolio; our opinion): Full position
Important Details for New Subscribers
Whether you already subscribed or not, we encourage you to find out how to make the most of our alerts and read our replies to the most common alert-and-gold-trading-related-questions.
Please note that the in the trading section we describe the situation for the day that the alert is posted. In other words, it we are writing about a speculative position, it means that it is up-to-date on the day it was posted. We are also featuring the initial target prices, so that you can decide whether keeping a position on a given day is something that is in tune with your approach (some moves are too small for medium-term traders and some might appear too big for day-traders).
Plus, you might want to read why our stop-loss orders are usually relatively far from the current price.
Please note that a full position doesn’t mean using all of the capital for a given trade. You will find details on our thoughts on gold portfolio structuring in the Key Insights section on our website.
As a reminder – “initial target price” means exactly that – an “initial” one, it’s not a price level at which we suggest closing positions. If this becomes the case (like it did in the previous trade) we will refer to these levels as levels of exit orders (exactly as we’ve done previously). Stop-loss levels, however, are naturally not “initial”, but something that, in our opinion, might be entered as an order.
Since it is impossible to synchronize target prices and stop-loss levels for all the ETFs and ETNs with the main markets that we provide these levels for (gold, silver and mining stocks – the GDX ETF), the stop-loss levels and target prices for other ETNs and ETF (among other: UGLD, DGLD, USLV, DSLV, NUGT, DUST, JNUG, JDST) are provided as supplementary, and not as “final”. This means that if a stop-loss or a target level is reached for any of the “additional instruments” (DGLD for instance), but not for the “main instrument” (gold in this case), we will view positions in both gold and DGLD as still open and the stop-loss for DGLD would have to be moved lower. On the other hand, if gold moves to a stop-loss level but DGLD doesn’t, then we will view both positions (in gold and DGLD) as closed. In other words, since it’s not possible to be 100% certain that each related instrument moves to a given level when the underlying instrument does, we can’t provide levels that would be binding. The levels that we do provide are our best estimate of the levels that will correspond to the levels in the underlying assets, but it will be the underlying assets that one will need to focus on regarding the signs pointing to closing a given position or keeping it open. We might adjust the levels in the “additional instruments” without adjusting the levels in the “main instruments”, which will simply mean that we have improved our estimation of these levels, not that we changed our outlook on the markets. We are already working on a tool that would update these levels on a daily basis for the most popular ETFs, ETNs and individual mining stocks.
Our preferred ways to invest in and to trade gold along with the reasoning can be found in the how to buy gold section. Additionally, our preferred ETFs and ETNs can be found in our Gold & Silver ETF Ranking.
As a reminder, Gold & Silver Trading Alerts are posted before or on each trading day (we usually post them before the opening bell, but we don't promise doing that each day). If there's anything urgent, we will send you an additional small alert before posting the main one.
=====
Latest Free Trading Alerts:
On Sunday, North Korea conducted another nuclear test. What does it imply for the gold market?
6th North Korean Nuclear Test and Gold
=====
Hand-picked precious-metals-related links:
PRECIOUS-Gold near 1-year high, buoyed by Korea tensions, lower dollar
Gold price breaks higher as hedge fund bulls outnumber bears most since 2012
Gold miner Acacia buys put options at $1,300 per ounce
Goldman Sachs: North Korea tensions aren't pushing up gold prices — Trump is
=====
In other news:
Simmering Korea tensions hit global stocks and dollar
What the ECB Will and Won't Do This Week
Draghi could leave investors in the dark with QE exit delayed
Bitcoin Comes Clawing Back After Selloff on China Ruling: Chart
Irma Has Florida Bracing for Atlantic's Strongest Storm Yet
=====
Thank you.
Sincerely,
Przemyslaw Radomski, CFA
Founder, Editor-in-chief, Gold & Silver Fund Manager
Gold & Silver Trading Alerts
Forex Trading Alerts
Oil Investment Updates
Oil Trading Alerts


