Briefly: in our opinion, no speculative short position in gold, silver, and mining stocks is justified from the risk/reward perspective at the moment of publishing this Alert. We will likely re-open them later this month, perhaps today or tomorrow.
The USD Index reversed yesterday. Gold reversed yesterday. And silver? It reversed on volume that we haven't seen so far this year. That's a combination of classic sell signs for the precious metals market. And yet, even though the USD Index ended the session higher, gold and miners didn't decline. Is then all the above really a sell sign, or not?
In short, the outlook is relatively mixed right now. This has been a wild week not only in terms of the surprising news, but also in terms of how it has been influencing the outlook. Just yesterday, the outlook became significantly more bullish because of the Fed's dovish language and gold's very strong lead when looking at the gold-USD link. But, now that the session is over, we have a brand new set of information. We have reversals, we have record volume level in silver, and the gold-USD strength of reaction ended up being only somewhat bullish, not profoundly so.
Let's take a look at the charts for more details:
Three Meaningful Reversals
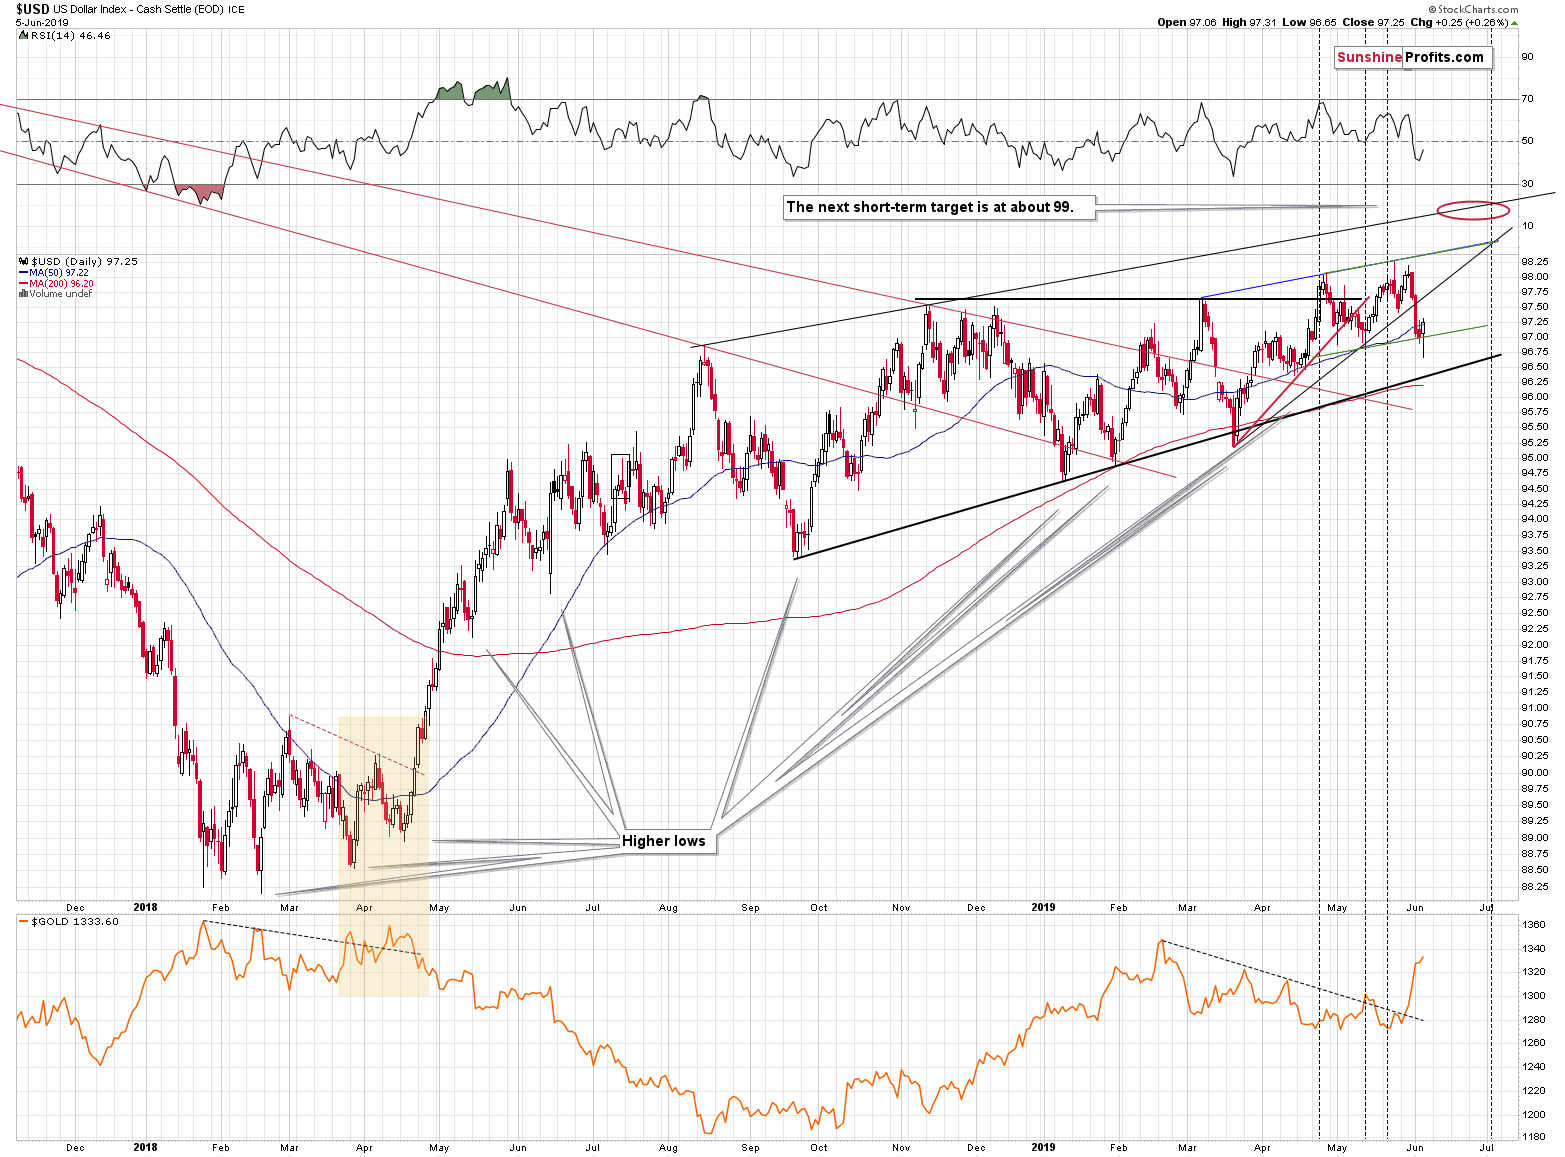
The USD Index reversed and invalidated the small breakdown below the rising green support line. The reversal is very bullish on its own, especially when connected with the invalidation of a small breakdown, but that's not everything that needs to be considered. The context is always the king. Were similar reversals always followed by rallies? And more importantly - did similar reversals result in gold's declines?
That was the case in late February 2019, then on the last day of January 2019 and in the following days, and finally in early July 2018. But, there are also other cases. For instance, the December 18, 2018 reversal. It was followed by USD's decline and gold's rally. The most recent example is May 1 - the USD Index reversed in a clear manner and it even rallied on the following day. But gold just paused and then continued to move higher for several additional days.
So, while the USD reversal makes the situation more bearish for gold, it's not as a surefire signal as it may appear at first sight.
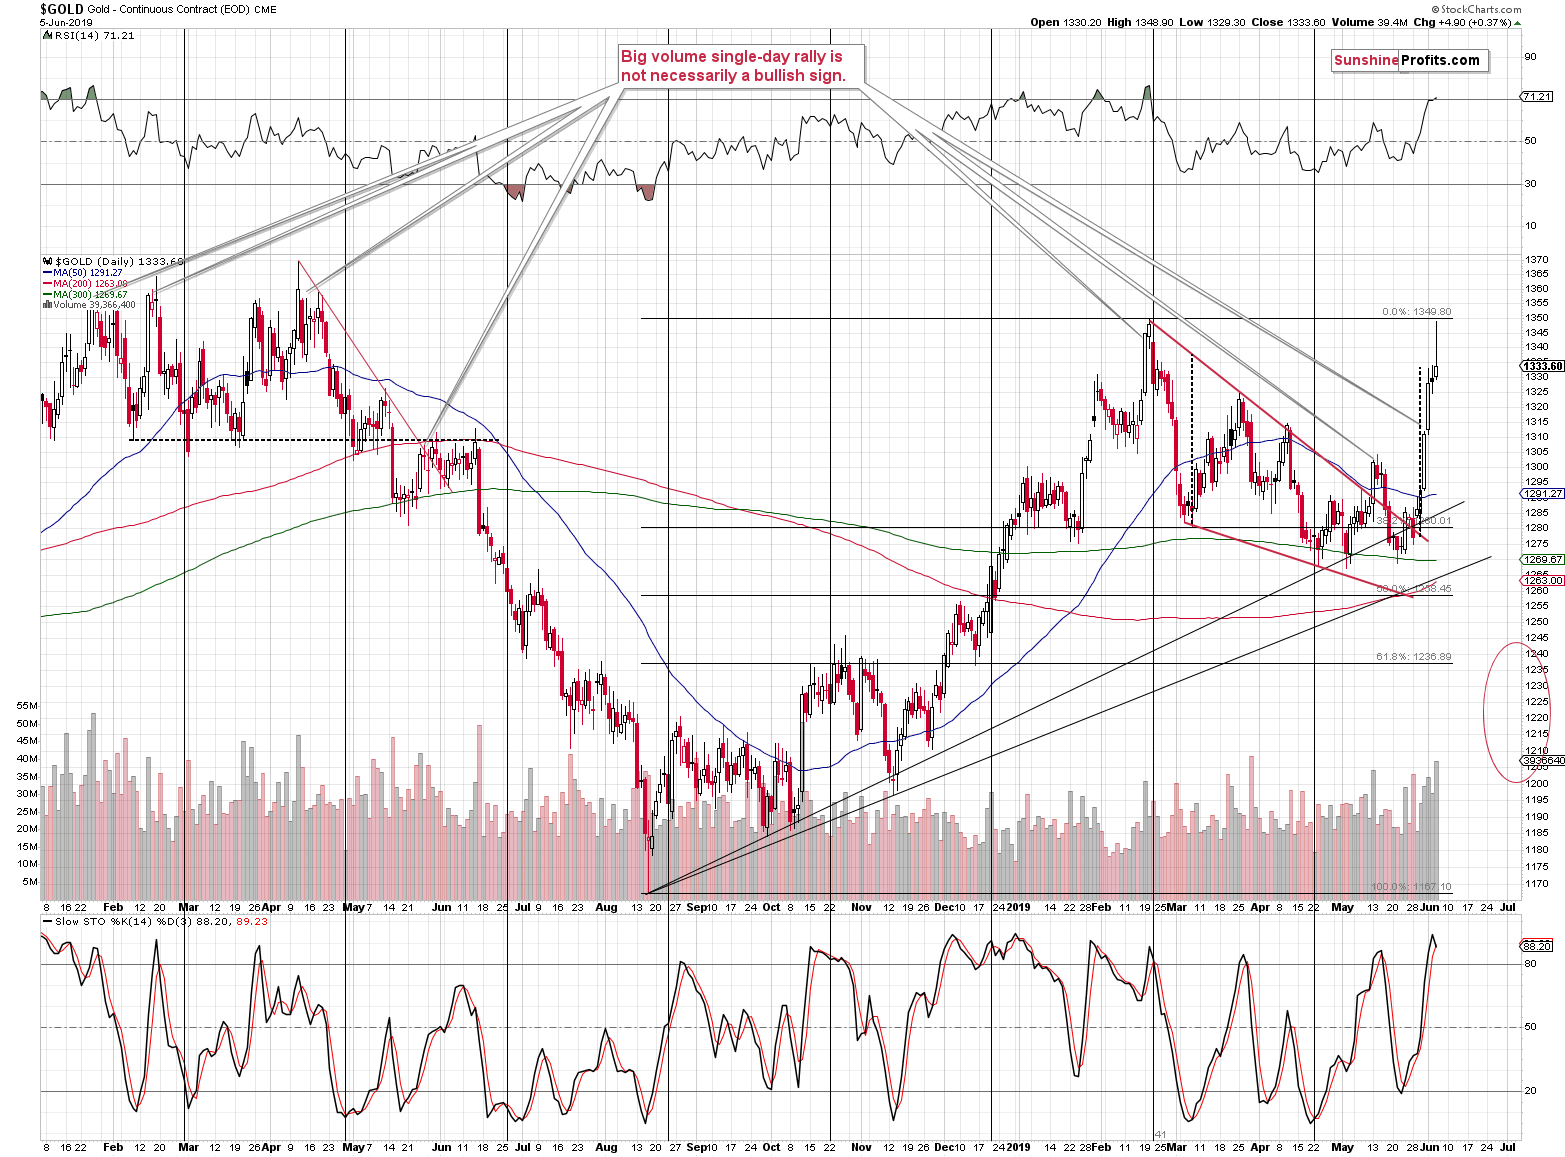
Gold's volume was the second-highest volume that we saw so far this year, which makes its reversal quite profound. The fact that resistance was almost reached - the 2019 high - is profound as well. Combining these two factors, the RSI above 70 and the sell signal from the Stochastic indicator, makes the outlook for gold - based on the above chart alone - very bearish.
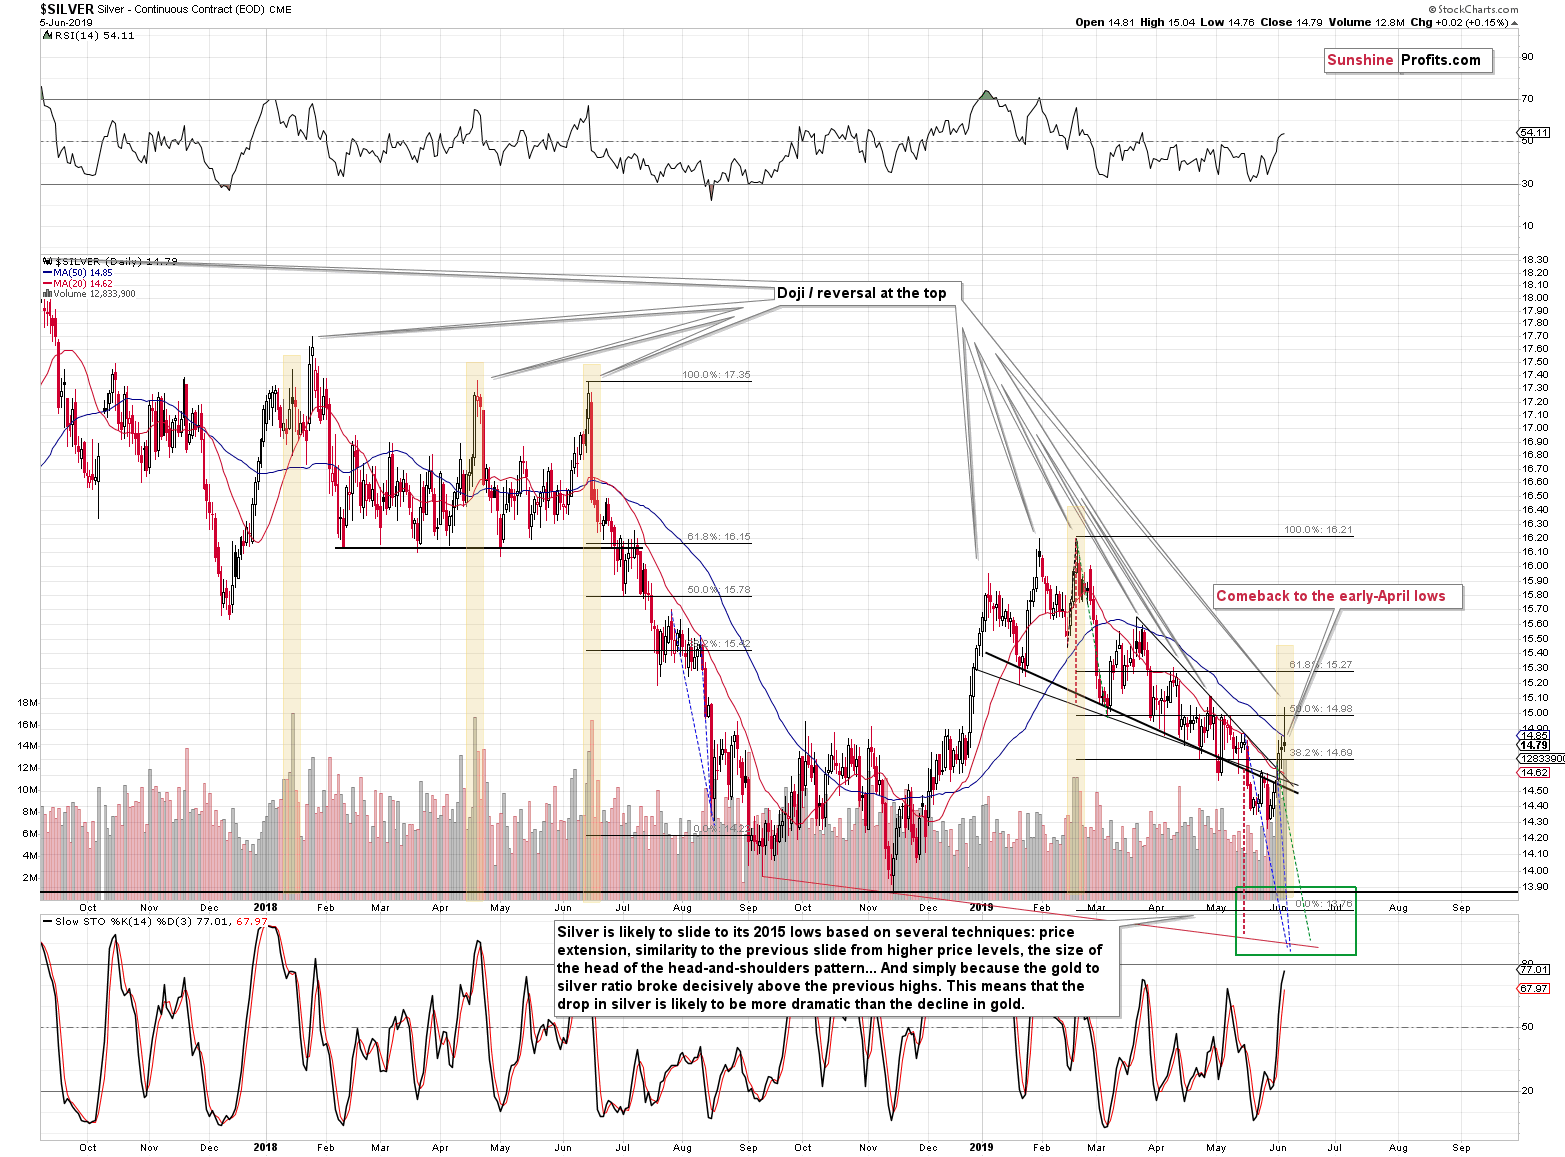
Silver did something similar, but not identical. The similarity is in the shape of yesterday's daily candlestick - it was a shooting star reversal. The difference is in the resistance that was reached. Instead of moving close to its previous 2019 high, silver just tried to break above its 50-day moving average and failed to do so. This is a bearish combination.
Now, what about silver's relative performance to gold? In yesterday's analysis, we emphasized that silver didn't outperform gold even on a very short-term basis and that the lack of this sign suggested that the rally is not ending. Did we see silver's strength yesterday? Yes, but to a limited extent. It didn't outperform gold. It just moved higher along with it, instead of underperforming. The increase in silver's momentum was notable, but not necessarily relative to gold. This factor is no longer bullish, but it's not bearish either.
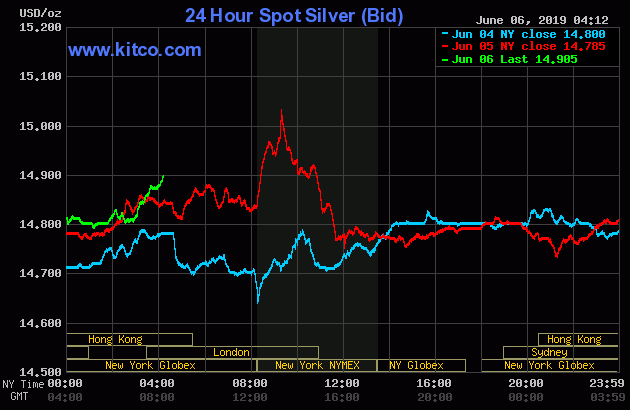
At the moment of writing these words, silver is already above where it was trading 24 hours ago, so it might be the case that the white metal will show some more relative strength before this short-term rally is completely over.
A Subtle Sign from the Miners
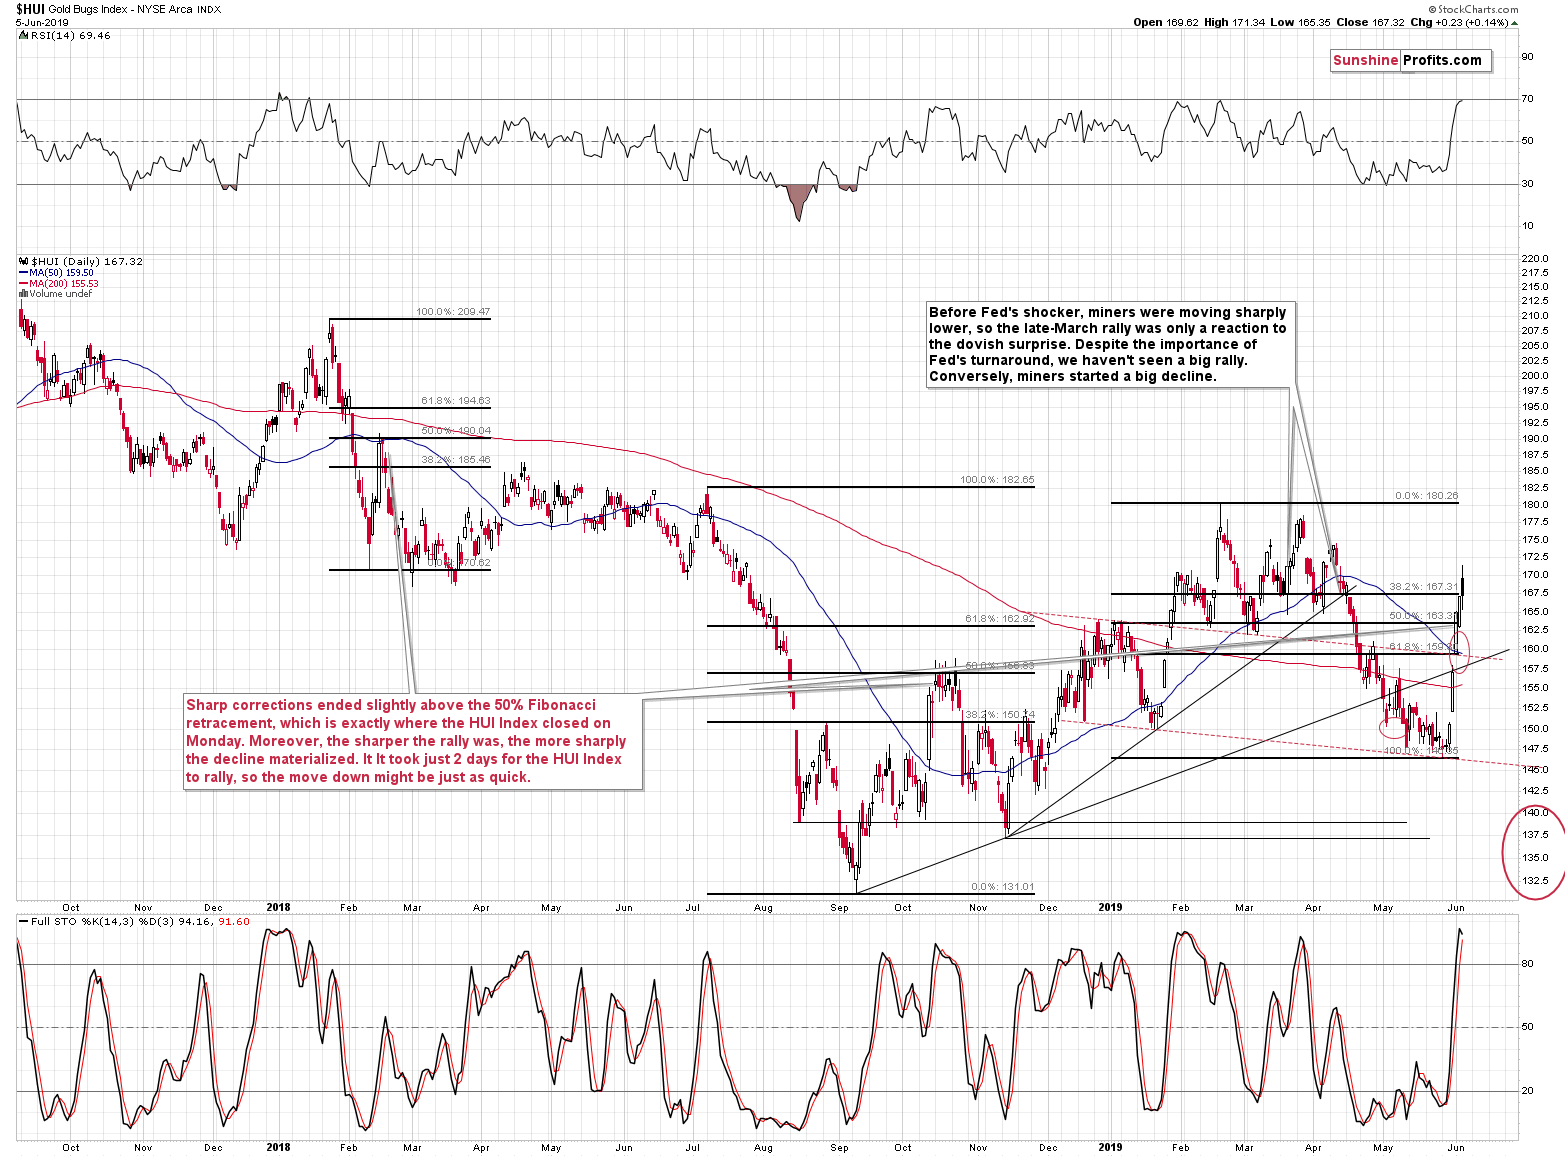
The HUI Index closed the day at its 61.8% Fibonacci retracement level, and the RSI is at almost 70, which is a bearish combination. We can say the same thing about miners' reversal. Then again, we can also say something positive about the latter. While gold and silver simply moved up and then erased almost the entire daily gain, miners moved even lower, but then ultimately gathered enough strength to move back up and close the day higher. The latter is a small, but important indication. It shows that yesterday's action may have not been the exhaustive rally that failed (thus there is almost nobody left who is willing to buy and the prices will now fall), but a daily pause.
Gold miners should be showing weakness relative to gold as a confirmation sign that the rally is already over. We haven't seen this sign yet.
The outlook is more bearish than it was yesterday, but not as bad as it was for instance a week ago.
News-based Time Analogy
The last time the market was surprised that made gold rally and USD decline, was when the Fed became much more dovish on March 20, 2019. Gold topped five days later, so that's how long it took the market to absorb this news and then return to the main trend.
If there was just a single surprising development, we could apply the above 5-day rule and say when the top is more or less likely to take place in a similar way. But, there was a series of surprising news. The increasing trade tensions with China, the Mexico tariff issue, the Fed's dovish response, and then some more trade tensions. Consequently, it's difficult to say how much longer can we see rising gold prices.
One way to deal with it would be to assume that some traders know about the upcoming decisions in advance and their action can already be seen in the price. This is most likely the case, but there is very little evidence for it (still, how else would the markets move a bit before the surprising news is published?). If so, then we might check when the March rally's start and end, and apply it to the most recent local bottom.
The March rally started on March 7th, so it took 12 trading days until it reached the top. The most recent bottom was on May 21st. Adding 12 trading days to this date provides us with this Friday (tomorrow) as the possible reversal day. Now, there were more news than just one, so it could be the case that it takes a day or a few days longer, but overall the analogy might work. Well, it would not be very strong on its own, but we already provided you with technical background yesterday.
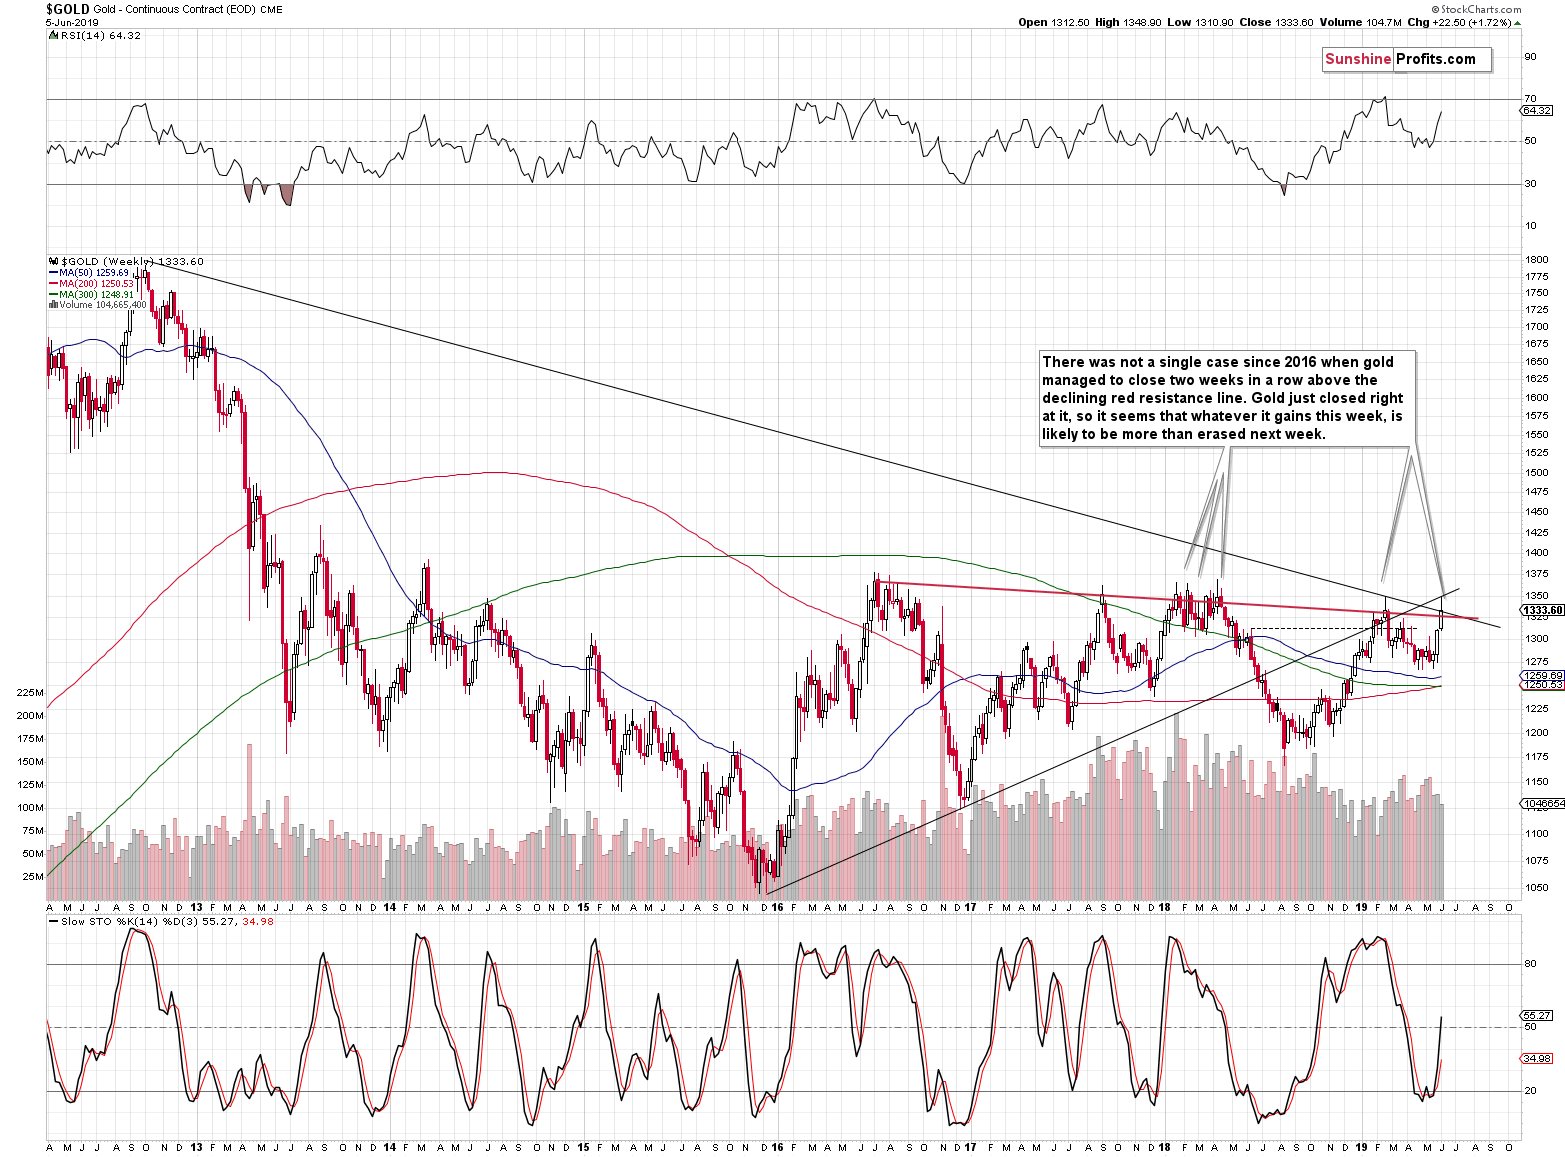
The long-term charts are less vulnerable to changes based on surprising news and the same goes for weekly closing prices and confirmations of breakouts in weekly terms.
Quoting yesterday's analysis:
Gold is approaching its long-term resistance created by the previous highs. There is one very interesting rule regarding this resistance. No matter how volatile or promising the rally above the red resistance line was, it was always (in the last couple of years) invalidated in the following week. Given today's pre-market rally in gold, it seems that we might see a weekly close above it. This means that the next week would quite likely include the invalidation of the current breakout and the beginning of another slide lower.
In other words, the above suggests that we shouldn't remain out of the market (i.e. without a short position) for long and that it would be best to get back in before the week is over.
Summary
Summing up, the situation became more bearish based on the shape of yesterday's session, price levels that were reached and volume levels in gold and silver. One of the key bullish signs (very favorable gold-USD strength of reaction) is no longer present, while new bearish ones (reversals, and silver's not-weak, but average performance) have emerged. Because of the above - and the long-term outlook that hasn't changed recently - we will most likely be re-opening our short positions shortly. This is very likely, so we are already providing the details for the positions - now, in advance. This will allow us to send an intraday Alert with the position change as close to making the decision as possible. In short, the details of the positions are just as previously. Naturally, you may want to re-open the position right now, but we prefer to wait for additional confirmation from silver (its outperformance), and/or mining stocks' weakness, and/or bearish action in the gold-USD link.
As always, we'll keep you - our subscribers - informed.
To summarize:
Trading capital (supplementary part of the portfolio; our opinion): No positions in gold, silver, and mining stocks are justified from the risk/reward perspective. We will likely re-enter the short positions at higher prices.
Long-term capital (core part of the portfolio; our opinion): No positions (in other words: cash)
Insurance capital (core part of the portfolio; our opinion): Full position
Whether you already subscribed or not, we encourage you to find out how to make the most of our alerts and read our replies to the most common alert-and-gold-trading-related-questions.
Please note that the in the trading section we describe the situation for the day that the alert is posted. In other words, it we are writing about a speculative position, it means that it is up-to-date on the day it was posted. We are also featuring the initial target prices, so that you can decide whether keeping a position on a given day is something that is in tune with your approach (some moves are too small for medium-term traders and some might appear too big for day-traders).
Plus, you might want to read why our stop-loss orders are usually relatively far from the current price.
Please note that a full position doesn't mean using all of the capital for a given trade. You will find details on our thoughts on gold portfolio structuring in the Key Insights section on our website.
As a reminder - "initial target price" means exactly that - an "initial" one, it's not a price level at which we suggest closing positions. If this becomes the case (like it did in the previous trade) we will refer to these levels as levels of exit orders (exactly as we've done previously). Stop-loss levels, however, are naturally not "initial", but something that, in our opinion, might be entered as an order.
Since it is impossible to synchronize target prices and stop-loss levels for all the ETFs and ETNs with the main markets that we provide these levels for (gold, silver and mining stocks - the GDX ETF), the stop-loss levels and target prices for other ETNs and ETF (among other: UGLD, DGLD, USLV, DSLV, NUGT, DUST, JNUG, JDST) are provided as supplementary, and not as "final". This means that if a stop-loss or a target level is reached for any of the "additional instruments" (DGLD for instance), but not for the "main instrument" (gold in this case), we will view positions in both gold and DGLD as still open and the stop-loss for DGLD would have to be moved lower. On the other hand, if gold moves to a stop-loss level but DGLD doesn't, then we will view both positions (in gold and DGLD) as closed. In other words, since it's not possible to be 100% certain that each related instrument moves to a given level when the underlying instrument does, we can't provide levels that would be binding. The levels that we do provide are our best estimate of the levels that will correspond to the levels in the underlying assets, but it will be the underlying assets that one will need to focus on regarding the signs pointing to closing a given position or keeping it open. We might adjust the levels in the "additional instruments" without adjusting the levels in the "main instruments", which will simply mean that we have improved our estimation of these levels, not that we changed our outlook on the markets. We are already working on a tool that would update these levels on a daily basis for the most popular ETFs, ETNs and individual mining stocks.
Our preferred ways to invest in and to trade gold along with the reasoning can be found in the how to buy gold section. Additionally, our preferred ETFs and ETNs can be found in our Gold & Silver ETF Ranking.
As a reminder, Gold & Silver Trading Alerts are posted before or on each trading day (we usually post them before the opening bell, but we don't promise doing that each day). If there's anything urgent, we will send you an additional small alert before posting the main one.
=====
Latest Free Trading Alerts:
Stocks extended their short-term run-up on Wednesday, as investors' sentiment further improved following Tuesday's rally. The S&P 500 index got closer to its late May local highs. Is this a new uptrend or just an upward correction?
S&P 500 - 100 Points Above Monday's Low, Will Rally Continue?
=====
Thank you.
Sincerely,
Przemyslaw Radomski, CFA
Editor-in-chief, Gold & Silver Fund Manager


