Briefly: in our opinion, full (250% of the regular size of the position) speculative short position in gold, silver, and mining stocks is justified from the risk/reward perspective at the moment of publishing this Alert.
Silver, the HUI Index (proxy for gold stocks) and the SIL ETF (proxy for silver stocks) just broke to new 2019 lows while the USD Index moved higher once again. Gold and GDX declined, but not so significantly as both mining indices. Are these the green shoots of an imminent upswing? Does their resilience foster hopes for a wind of change?
Not really. Let's take a look at why.
GDX Revealing Its True Colors
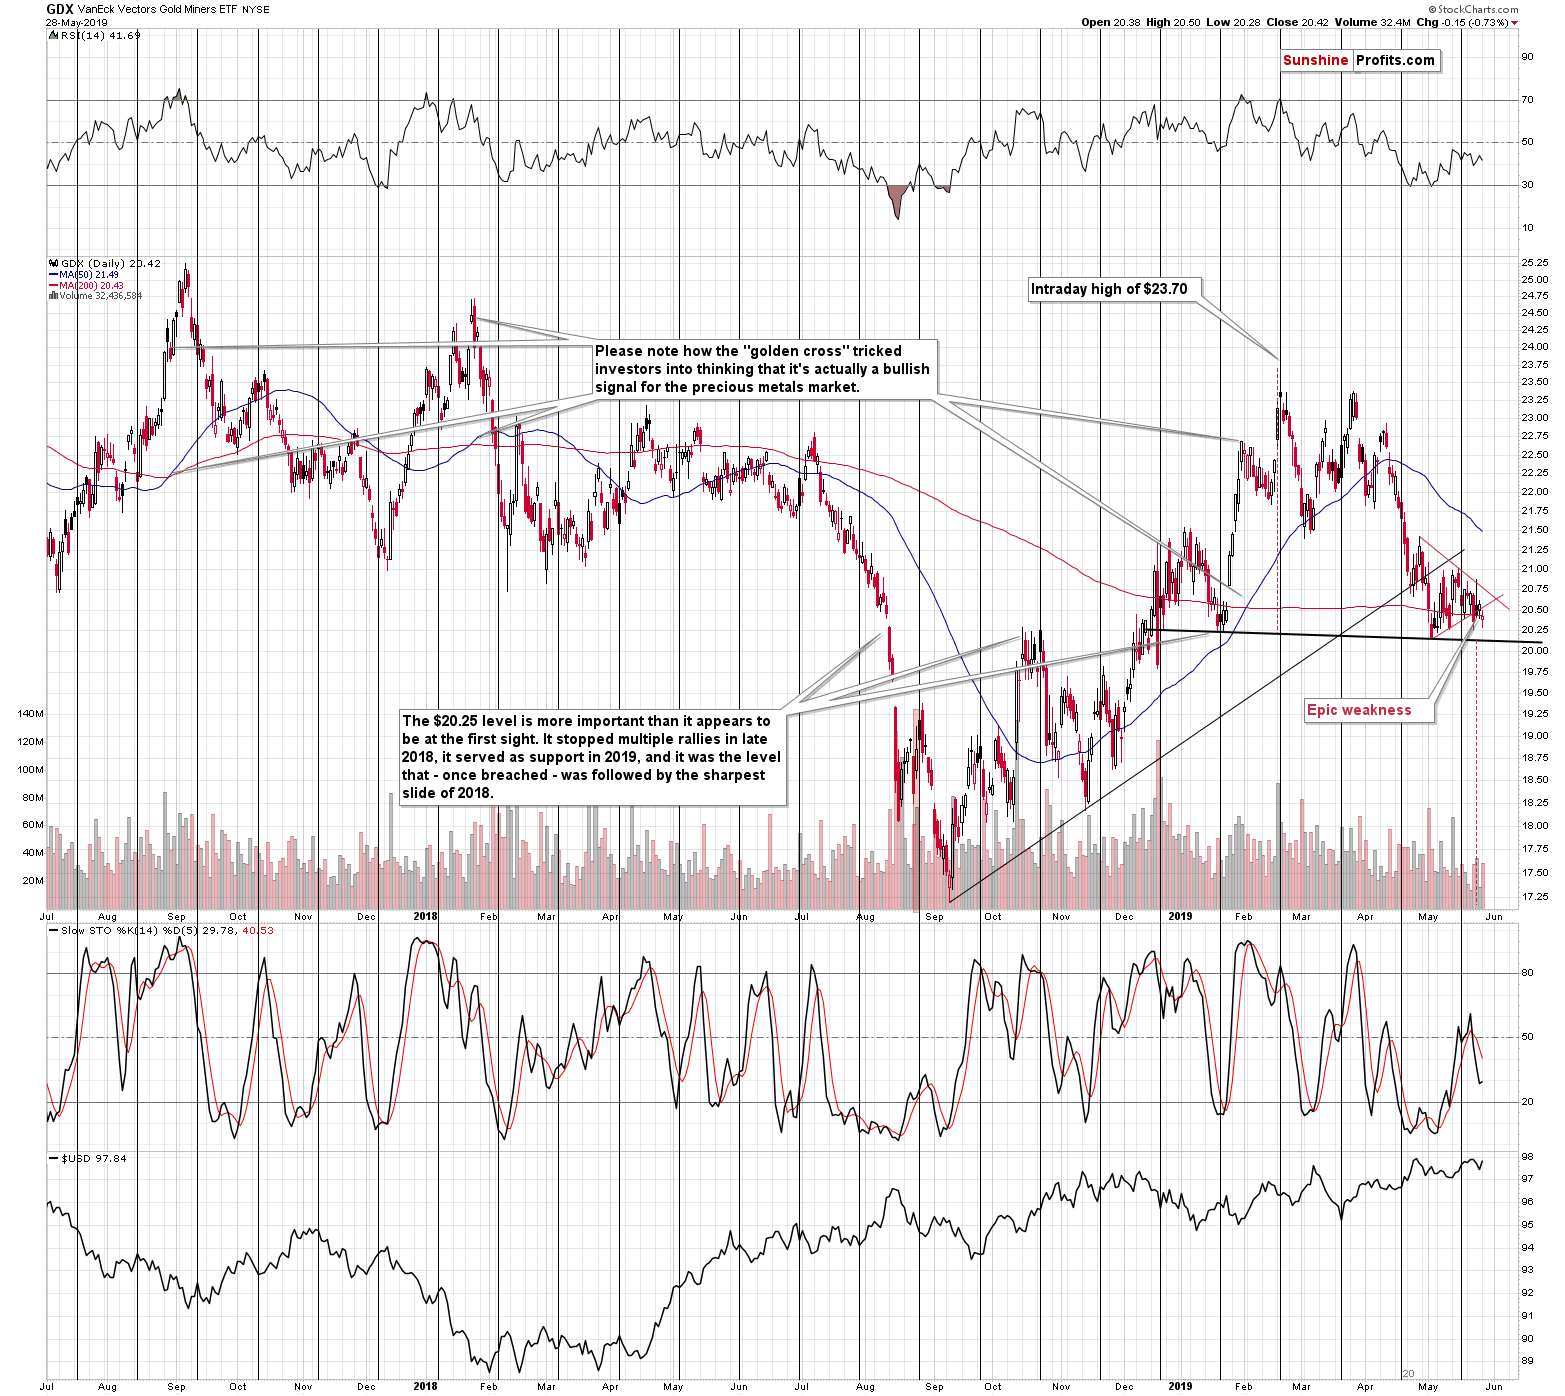
The GDX ETF is not at the new 2019 lows yet, but it's definitely below the triangle pattern, which confirms that Friday's move back above its lower border was accidental. The implications never became bullish - they remained bearish all along.
Triangles are usually a continuation pattern, which suggests a move lower. In this case, the triangle is the right shoulder of the potential head-and-shoulders pattern, which means that once GDX slides, it's likely to slide in tune with this pattern. And the target based on this pattern is at about $17.20 - at the 2018 lows.
The breakdown below the lower border of the triangle is the thing that makes it very likely that we will not have to wait long for the above to take place.
The Metals Are Leading the Way
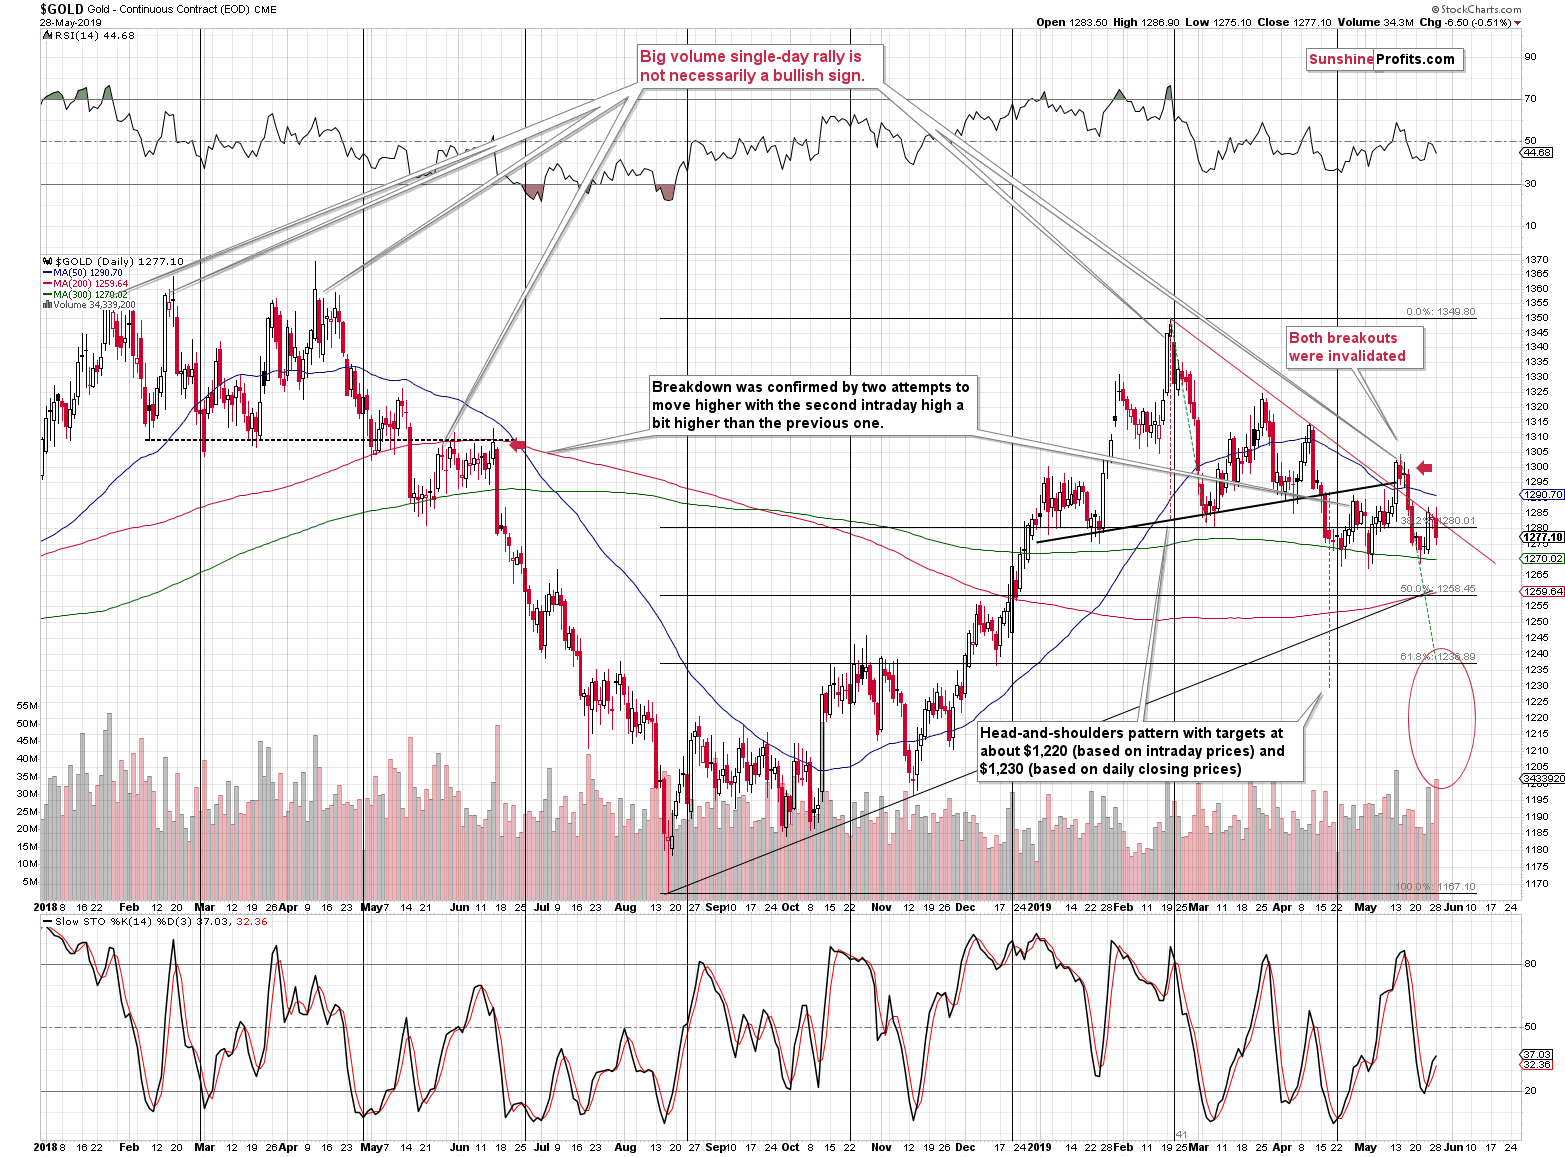
Gold is relatively close to its 2019 lows, but it has yet to break below them. What's quite interesting on the above gold chart is that the consolidation that we see forming below the January - early-April head-and-shoulders formation is by itself taking the form of a smaller head-and-shoulders pattern.
The initial top in late April (left shoulder), then the big top in mid-May (head), and last week's upswing along with this week's decline seems (right shoulder) seem to on the verge of being confirmed as a full pattern once gold breaks below the early-May lows. And we will likely not have to wait long for that to happen. Just look at how silver is paving the way to lower levels.
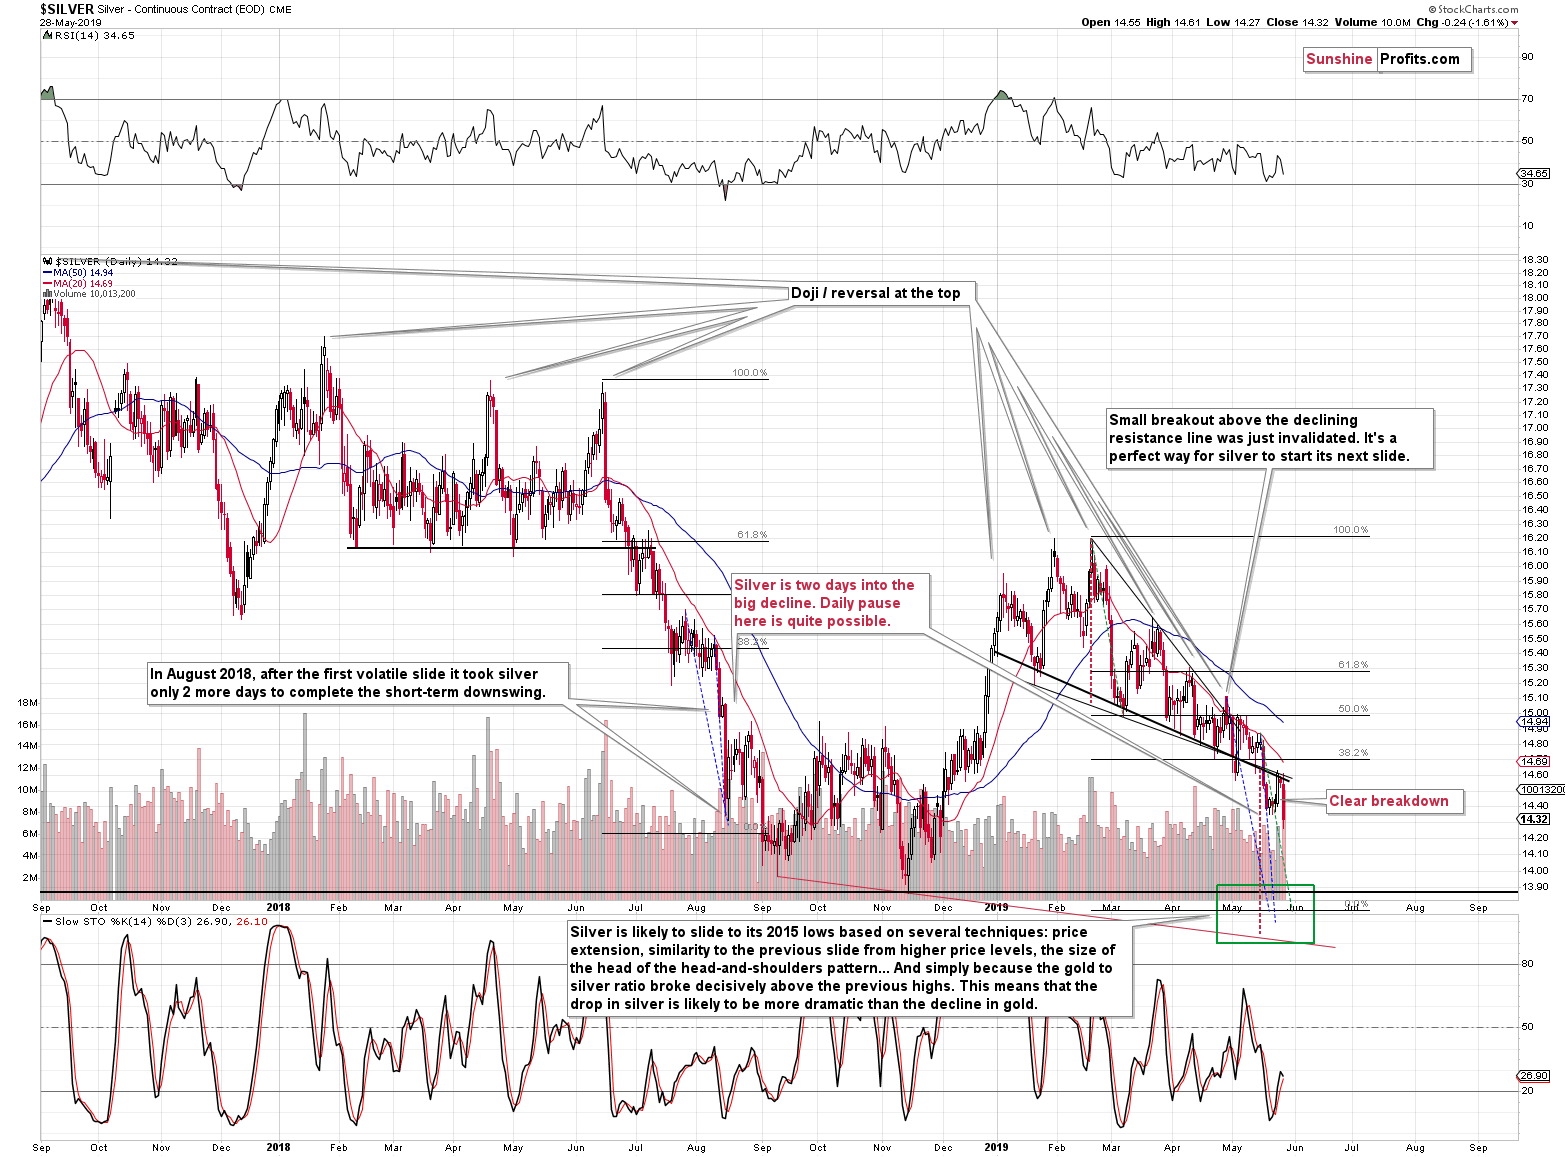
The white metal is declining at an increasing pace. After breaking below the declining support line in mid-May, silver simply moved back to it, verified it as resistance and it's now declining once again. Our silver short profits keep on increasing.
It may appear that silver is already low enough and it may be tempting to close the position and take profits off the table, but let's keep in mind that the downside potential is still quite sizable. The next strong support levels are the 2018 lows and the 2015 lows. Based on multiple short-term techniques, it seems that silver will go below the 2018 lows - the 2015 lows appear more likely. Since silver is likely to slide to about $13.70, closing the position now seems premature.
The short-term techniques that we mentioned above are the analogy to the July - August 2018 decline, the height of the declining wedge (red dashed line), and the analogy to the first short-term decline of the current medium-term move lower (green dashed line).
HUI Index Takes the Spotlight as the Decline's Leader
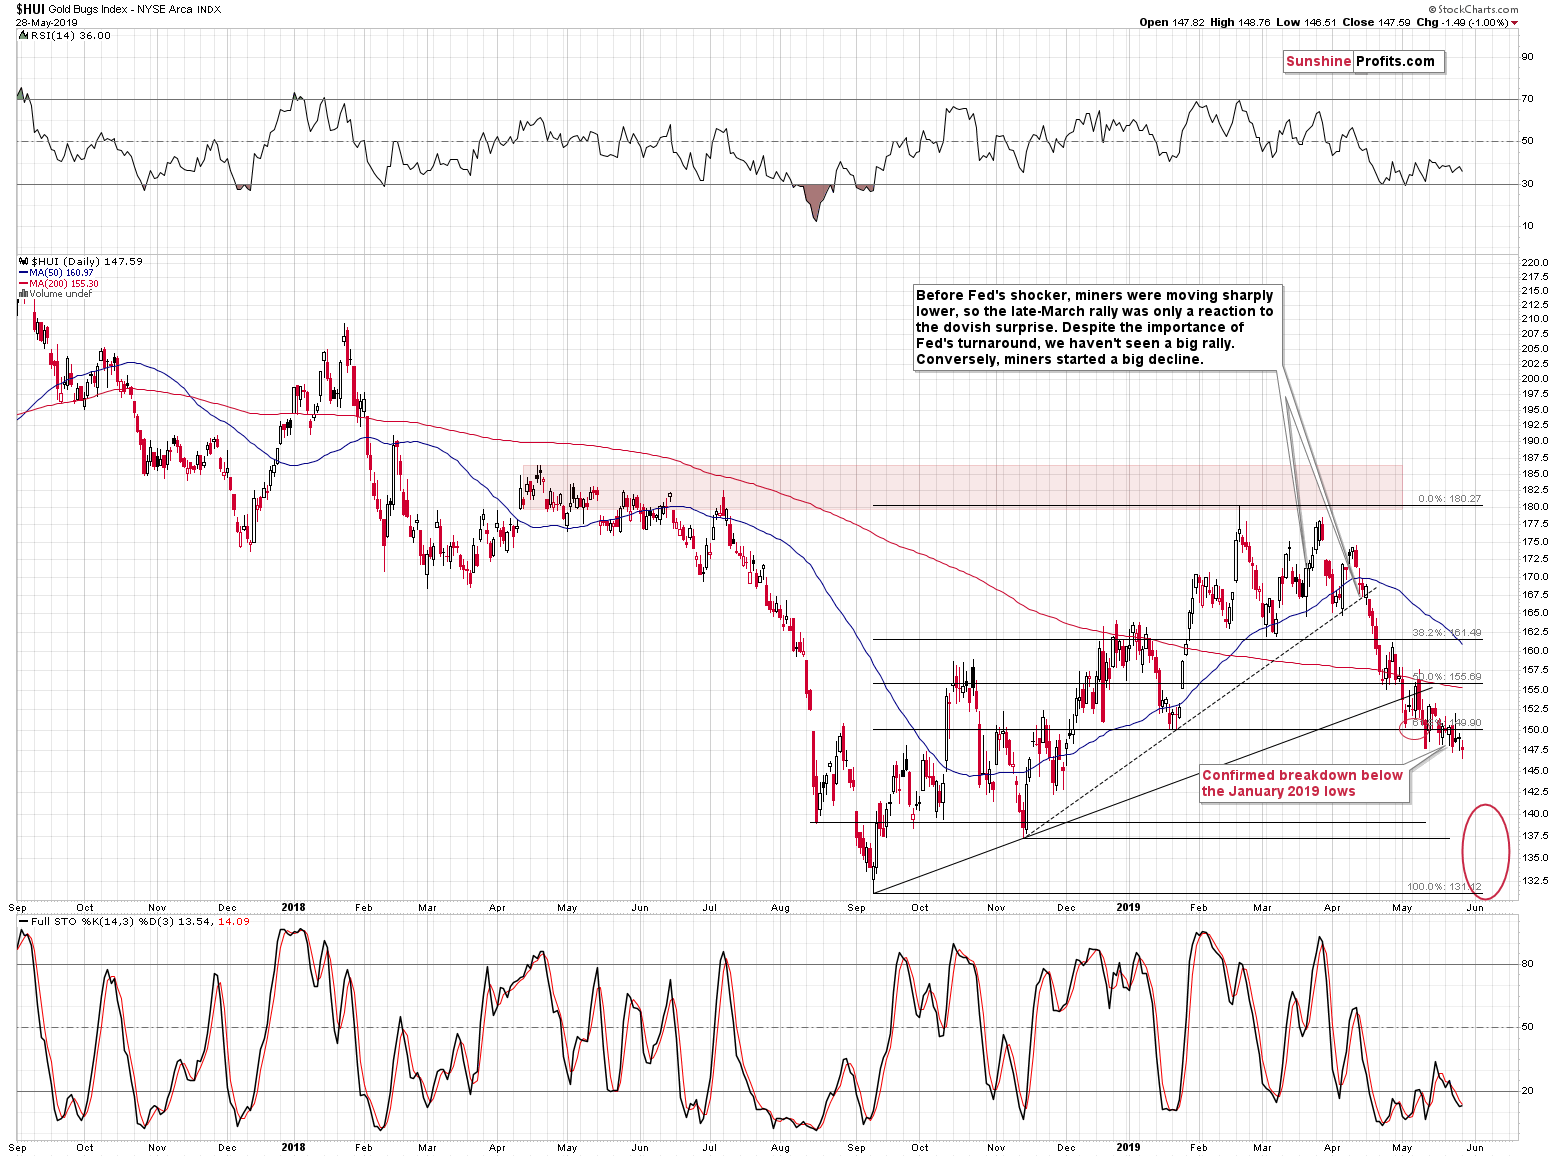
The HUI Index is already well below the January lows and the breakdown has been more than confirmed. Yesterday, the HUI Index closed at new yearly lows, confirming the bearish outlook. The decline has not been volatile recently, but the breakdowns and confirmations hint at one important distinction. It has simply not been volatile yet. The volatility is likely to pick up soon.
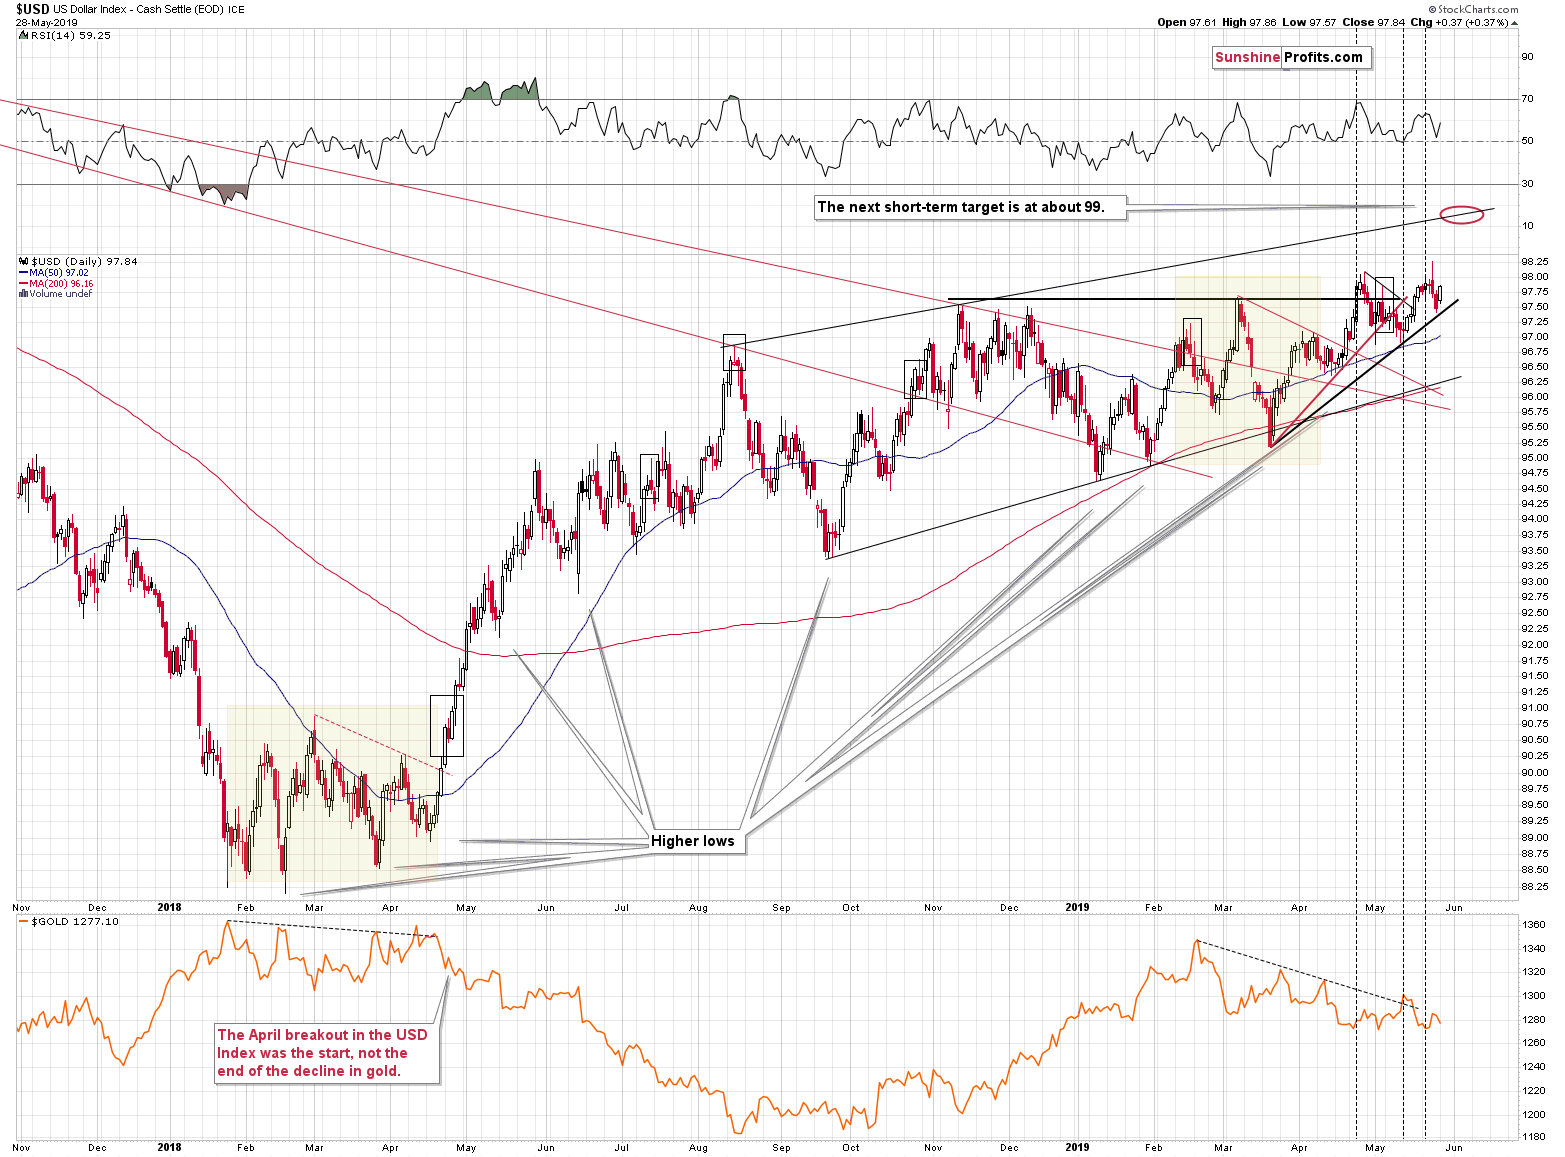
As far as the USD Index in concerned, our previous comments remain up-to-date.
USD Index: The Pressure Meter Keeps Rising
In Friday's analysis, we wrote the following regarding Thursday's reversal:
The USD Index reversed in a clear way, which likely caught everyone's attention. No wonder that gold and silver investors reacted as well. But, let's check how often these reversals marked tops in the recent past and how often they were followed by some other price action. We marked similar cases with grey rectangles.
In April 2018 this kind of reversal formed early during a massive rally. [VERY BULLISH]
In August 2018 this kind of reversal formed at the top. [BEARISH]
In October 2018 this kind reversal formed within a rally - the final top was over 1 index point above the reversal's closing price. [BULLISH]
In February 2019 this kind of reversal formed at the top. [BEARISH]
In early May 2019 this kind of reversal formed close to local bottoms - higher prices followed relatively soon. [BULLISH]
So, we have 5 similar cases, 3 of which were actually bullish. So, should we really take the reversal as a bearish signal this time? What seems much more likely than a profound decline from here, is a tiny move lower to the rising black support line (about 0.3 below yesterday's closing price) and then another wave up. This action would be most similar to the most recent, early-May analogy. At the moment of writing these words, the USD Index is already down by 0.16 today and gold and silver are basically flat (precisely, gold is down $0.80 and silver is down $0.05) in turn.
After we wrote about the possible move of 0.3 below Thursday's closing price, the USD Index moved lower by 0.32 intraday and then started to move back up.
This means that even though we saw a reversal on Thursday, the move higher might continue shortly. The implications for the precious metals market are bearish.
Summary
Summing up, silver and gold stocks moved to new yearly lows which serves as a good indication of what's to come also for gold. The next reversal is likely to take place close to or at the turn of the month. This means that we are likely to see either a volatile move lower this week, or the start of the next sizable downswing might be delayed until the next week and start in early June. In other words, gold might reach our interim target level of $1,240 shortly and thus we might adjust our trading position also relatively soon.
Also, if you've been wondering if it's a good idea to simply buy gold and hold it for the next 10-15 years while using it for everyday expenses, we encourage you to read our article on this topic. It's a pointed reply to a question about such a strategy that we have received recently - this topic is too important to give it just a passing glance.
To summarize:
Trading capital (supplementary part of the portfolio; our opinion): Full short position (250% of the full position) in gold, silver, and mining stocks is justified from the risk/reward perspective with the following stop-loss orders and exit profit-take price levels:
- Gold: profit-take exit price: $1,241; stop-loss: $1,357; initial target price for the DGLD ETN: $51.87; stop-loss for the DGLD ETN $39.87
- Silver: profit-take exit price: $13.81; stop-loss: $15.72; initial target price for the DSLV ETN: $39.38; stop-loss for the DSLV ETN $26.97
- Mining stocks (price levels for the GDX ETF): profit-take exit price: $17.61; stop-loss: $24.17; initial target price for the DUST ETF: $34.28; stop-loss for the DUST ETF $15.47
In case one wants to bet on junior mining stocks' prices (we do not suggest doing so - we think senior mining stocks are more predictable in the case of short-term trades - if one wants to do it anyway, we provide the details), here are the stop-loss details and target prices:
- GDXJ ETF: profit-take exit price: $24.71; stop-loss: $35.67
- JDST ETF: profit-take exit price: $78.21 stop-loss: $30.97
Long-term capital (core part of the portfolio; our opinion): No positions (in other words: cash)
Insurance capital (core part of the portfolio; our opinion): Full position
Whether you already subscribed or not, we encourage you to find out how to make the most of our alerts and read our replies to the most common alert-and-gold-trading-related-questions.
Please note that the in the trading section we describe the situation for the day that the alert is posted. In other words, it we are writing about a speculative position, it means that it is up-to-date on the day it was posted. We are also featuring the initial target prices, so that you can decide whether keeping a position on a given day is something that is in tune with your approach (some moves are too small for medium-term traders and some might appear too big for day-traders).
Plus, you might want to read why our stop-loss orders are usually relatively far from the current price.
Please note that a full position doesn't mean using all of the capital for a given trade. You will find details on our thoughts on gold portfolio structuring in the Key Insights section on our website.
As a reminder - "initial target price" means exactly that - an "initial" one, it's not a price level at which we suggest closing positions. If this becomes the case (like it did in the previous trade) we will refer to these levels as levels of exit orders (exactly as we've done previously). Stop-loss levels, however, are naturally not "initial", but something that, in our opinion, might be entered as an order.
Since it is impossible to synchronize target prices and stop-loss levels for all the ETFs and ETNs with the main markets that we provide these levels for (gold, silver and mining stocks - the GDX ETF), the stop-loss levels and target prices for other ETNs and ETF (among other: UGLD, DGLD, USLV, DSLV, NUGT, DUST, JNUG, JDST) are provided as supplementary, and not as "final". This means that if a stop-loss or a target level is reached for any of the "additional instruments" (DGLD for instance), but not for the "main instrument" (gold in this case), we will view positions in both gold and DGLD as still open and the stop-loss for DGLD would have to be moved lower. On the other hand, if gold moves to a stop-loss level but DGLD doesn't, then we will view both positions (in gold and DGLD) as closed. In other words, since it's not possible to be 100% certain that each related instrument moves to a given level when the underlying instrument does, we can't provide levels that would be binding. The levels that we do provide are our best estimate of the levels that will correspond to the levels in the underlying assets, but it will be the underlying assets that one will need to focus on regarding the signs pointing to closing a given position or keeping it open. We might adjust the levels in the "additional instruments" without adjusting the levels in the "main instruments", which will simply mean that we have improved our estimation of these levels, not that we changed our outlook on the markets. We are already working on a tool that would update these levels on a daily basis for the most popular ETFs, ETNs and individual mining stocks.
Our preferred ways to invest in and to trade gold along with the reasoning can be found in the how to buy gold section. Additionally, our preferred ETFs and ETNs can be found in our Gold & Silver ETF Ranking.
As a reminder, Gold & Silver Trading Alerts are posted before or on each trading day (we usually post them before the opening bell, but we don't promise doing that each day). If there's anything urgent, we will send you an additional small alert before posting the main one.
=====
Latest Free Trading Alerts:
Have you thought about simply buying gold and forgetting about it for the next 10-15 years? We certainly did. And it seems not bad. But is „not bad" enough?
Better Than Buy-and-Hold Gold Investment
More than 200 million people in 28 nations voted in the second-largest democratic elections in the world. What interesting information can we glean from their vote - which way the wind blows now? Crucially, how does it reflect on gold?
Eurosceptics Gained Seats in the EU. Will Gold Shine Now?
Oil bulls look to have arrested the slide as there hasn't been a down day since Thursday. One could easily expect a more vigorous rebound, however. The nearby resistances remain and black gold has hardly gone anywhere today so far. After the long weekend, will the bulls muster more strength, or does the technical picture favor another trip south in the coming days? The answer isn't as easy as might be inferred from the Alert's title...
Are We Looking at a Dead Cat Bounce in Oil?
=====
Thank you.
Sincerely,
Przemyslaw Radomski, CFA
Editor-in-chief, Gold & Silver Fund Manager


