Briefly: in our opinion, full (250% of the regular size of the position) speculative short positions in gold, silver and mining stocks are justified from the risk/reward perspective at the moment of publishing this alert.
Very little changed in the precious metals market yesterday and the vast majority of investors and traders will think that this means that nothing changed. And that will be very wrong. “What changed” is not the only important question that one should be asking. “How did it happen” and “in light of what” questions and replies to them provide very important details to those, who can read between the lines in reports and candlesticks on charts.
Let’s start with the “in light of what” part of the analysis. Gold, silver and mining stocks haven’t done much in light of…
The USD’s Daily Decline
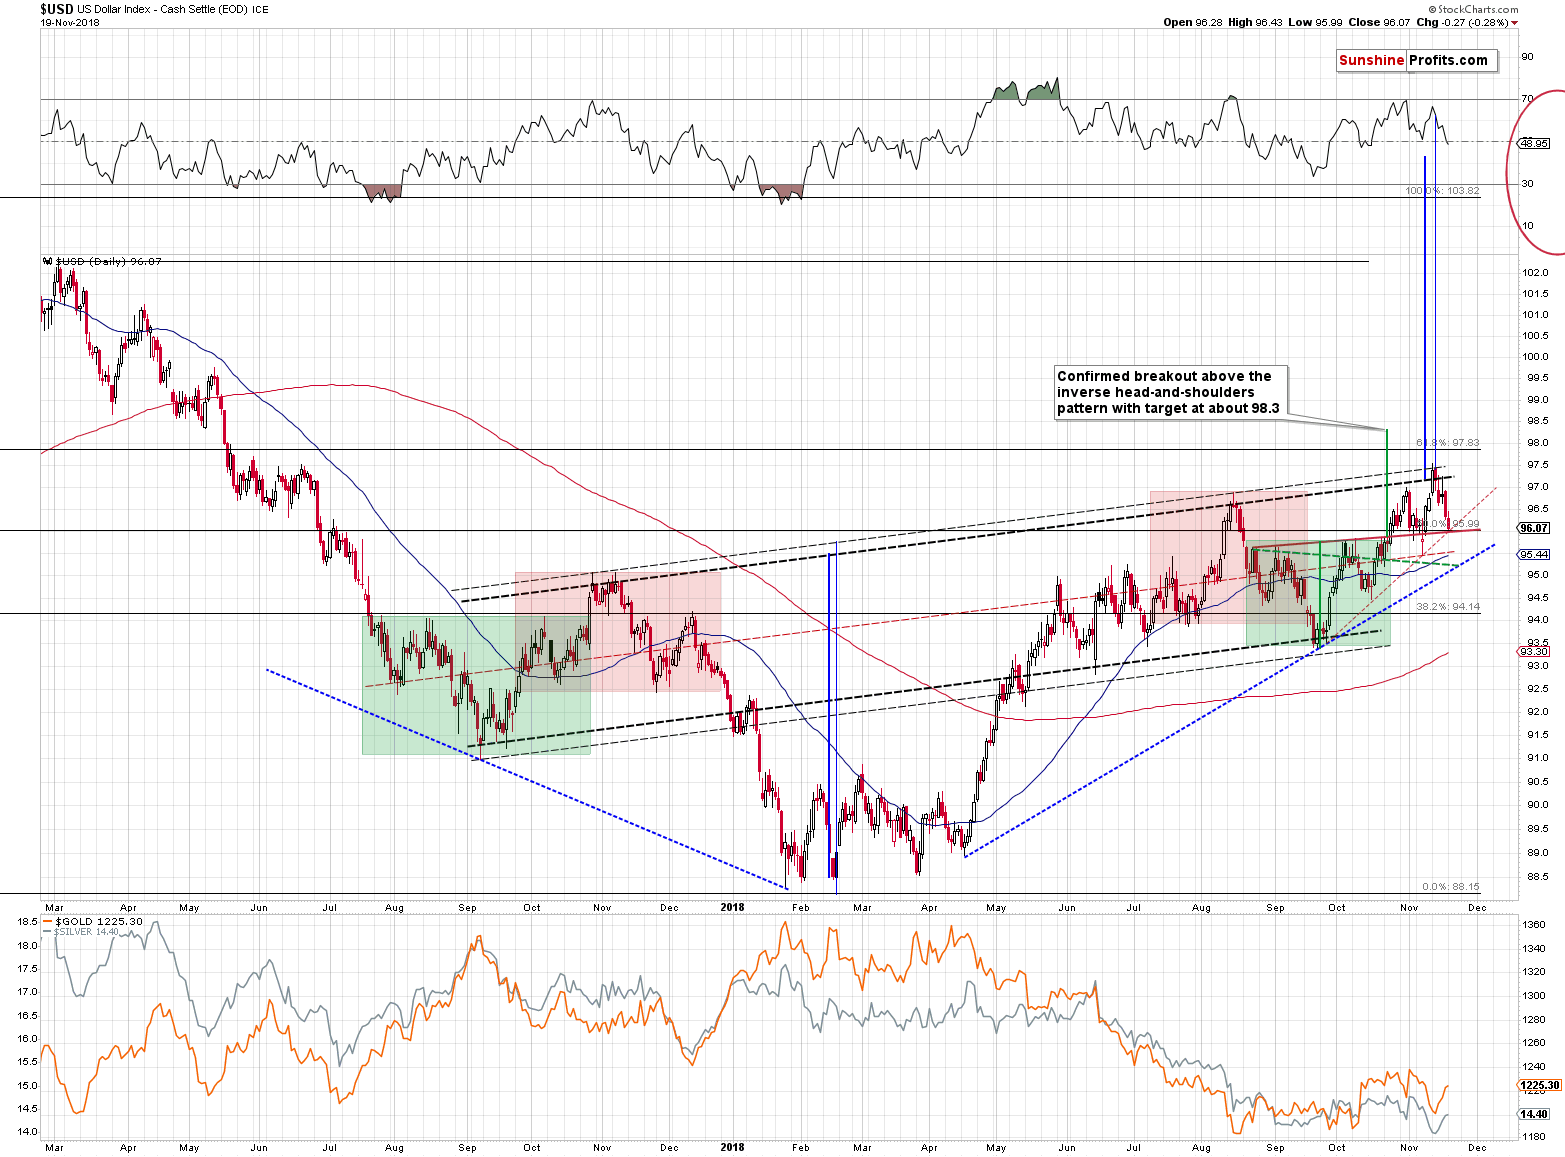
USD Index moved lower yesterday, moving to our likely downside target. We wrote about the possibility of the USDX reaching the 96 level and yesterday’s intraday low was 95.99. The zigzag reflecting the early-August 2017 zigzag may have just completed. May, because even if the USDX moves a bit lower, this similarity will remain present.
The USD Index bottomed at the intersection of the two rising red support lines – one is the neckline of the inverse head-and-shoulders pattern and the other is the rising support line that’s based on the previous intraday lows. If the rising blue line was based on the closing prices it would be crossing the declining green line that’s based on the closing prices, thus creating another triangle-vertex-based reversal. We didn’t annotate the latter on the chart as it would make it too unclear. However, both vertexes confirm each other and suggest that the turnaround in the USDX is here or at hand.
Yesterday’s decline should have caused the precious metals sector to move higher. Gold was up by just $2 and silver was up by just 2 cents. This is a weak reaction, that is – by itself – a bearish indication, confirming that the days of this corrective upswing are numbered, or that it is already over. This is in tune with the reversals on the USD Index chart, cyclical turning point for the mining stocks, and triangle-vertex-based reversal for silver.
That’s also in perfect tune with what we wrote about the mining stocks performance relative to gold yesterday. The outperformance was too significant, and the bullish flame was too bright to last long.
Mining Stocks’ Lack of Strength
In yesterday’s analysis, we described the situation in the mining stocks in the following way:
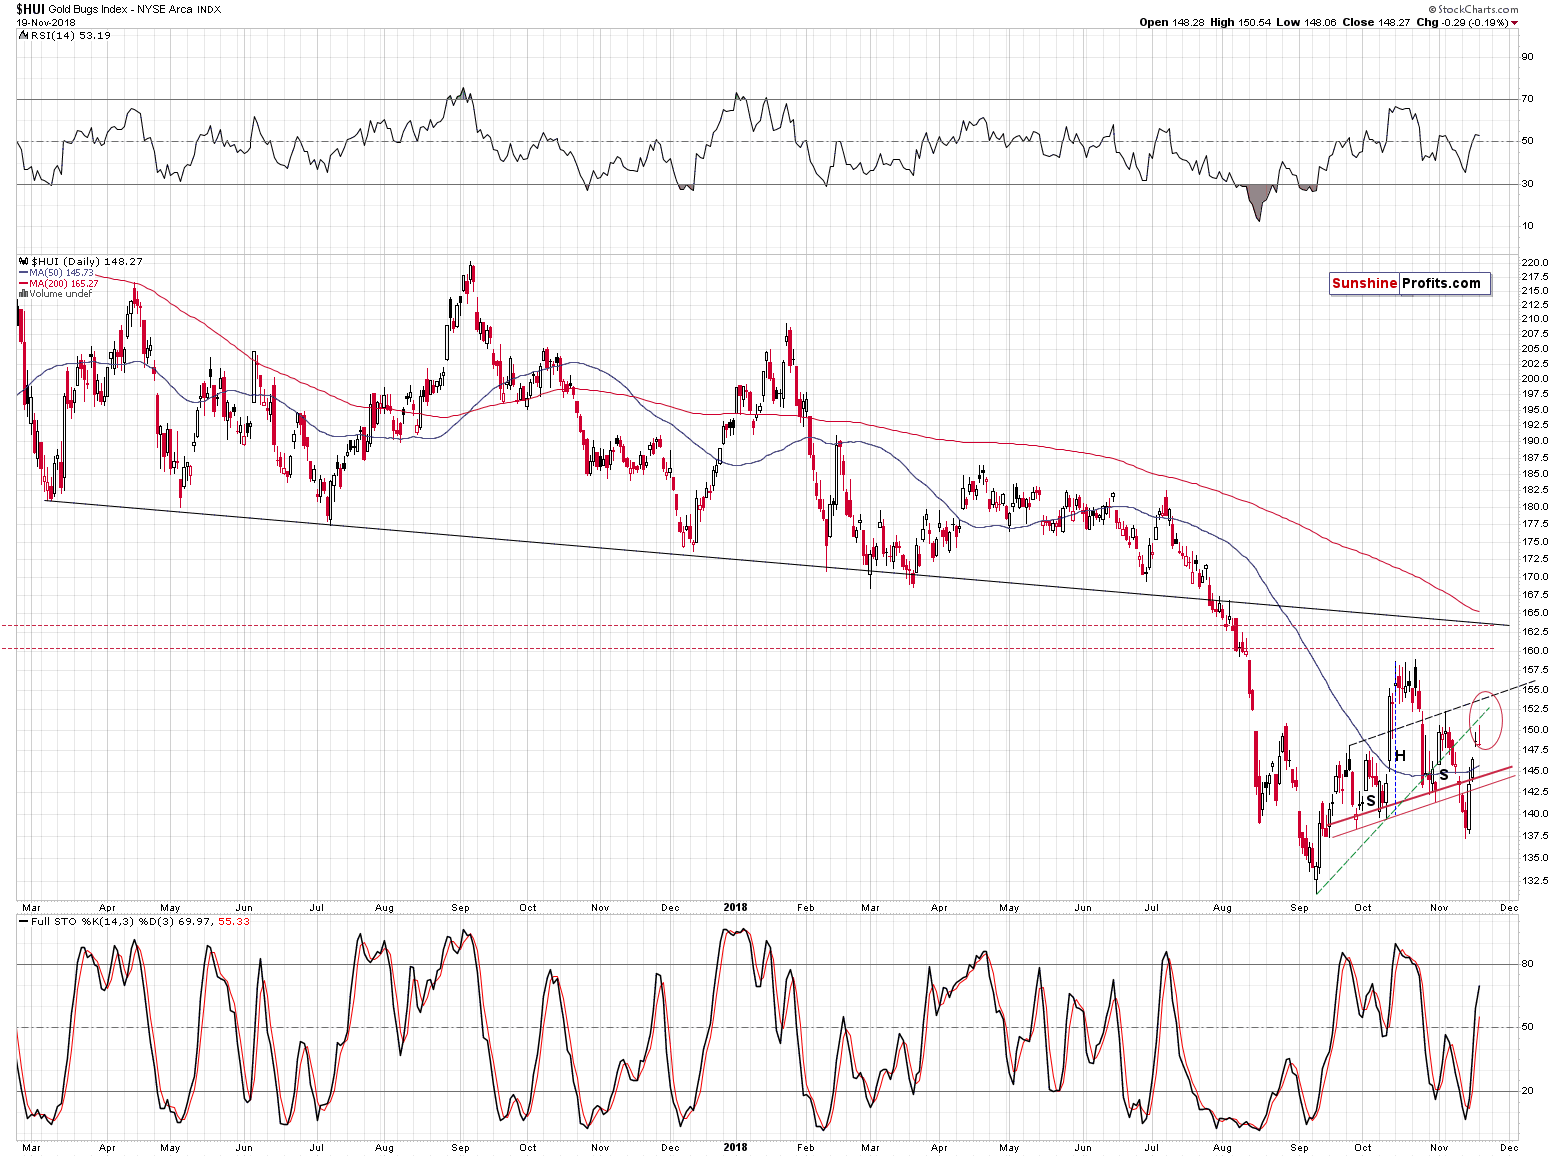
The situation in the mining stocks is not developing in perfect tune with their major downtrend, but within the borders of what one might call reasonable for a downtrend. A local head-and-shoulders formation was invalidated, which was a bullish development for the short term (and only for the short term) and it was followed by higher mining stock prices. What does it imply for the future? It suggests that the rally that was likely to happen based on the invalidation, may have already happened. Moreover, since the miners are approaching their resistance levels, it seems that the upside potential is quite limited.
The gold miners are already in the lower part of their target area. This means that they might have already topped, or that the top will be formed at slightly higher levels. The HUI Index is already at the height of the left shoulder of the previous head-and-shoulders pattern. It might reverse right away, but it might move also to the right shoulder (at about 152.5) or to the rising dashed line that’s based on both above-mentioned shoulders (at about 154).
Gold miners are naturally connected with the price of gold and if gold declined significantly from here, it would be normal to expect the mining stocks to decline. And indeed, we expect both to decline. But does it mean that the bearish outlook for the mining stocks is based only on the outlook for gold? Of course not. One of the things that should be considered is mining stocks’ relative performance to gold.
They just jumped relative to gold, so that’s definitely bullish? No.
In all areas of life, things in excess can easily turn into their opposite. And that seems to be the case here.
Mining Stocks’ Outperformance: The Brightest Flame Burns Quickest
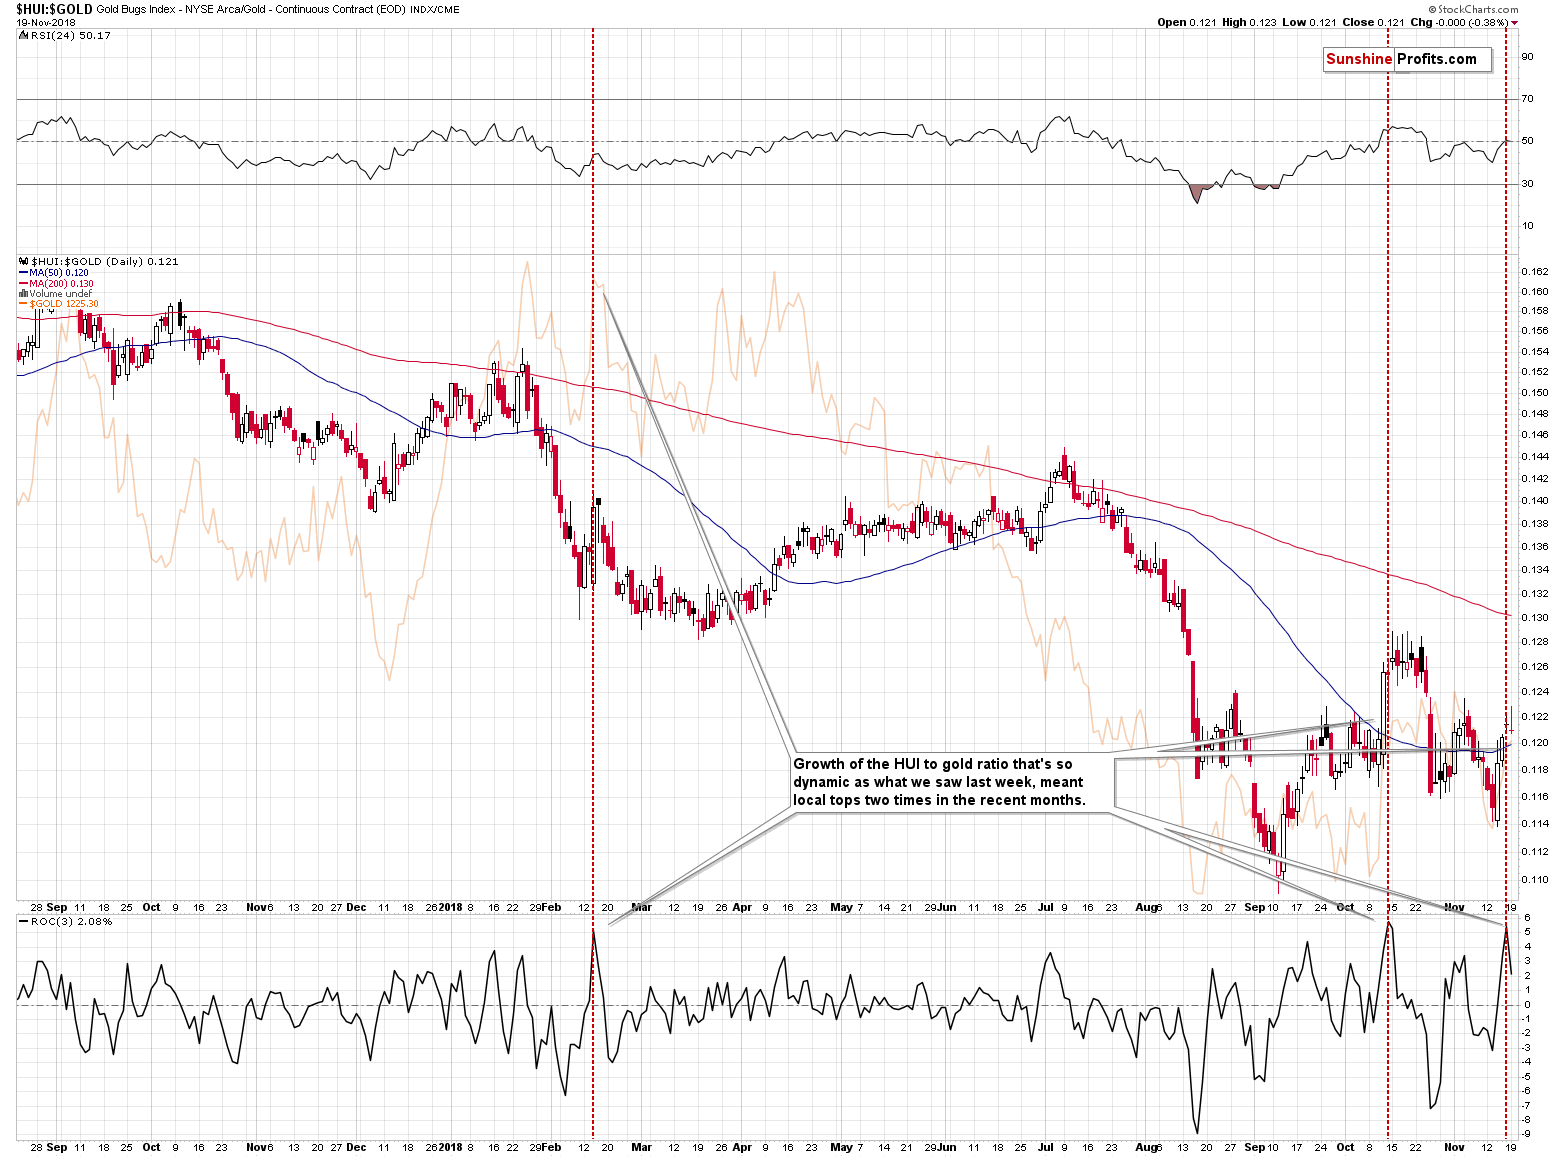
The above chart features the gold stock to gold ratio. It rallied recently and the rally was sharp. Too sharp. The ROC (Rate of Change) indicator in the bottom part of the above chart shows the rapidness of the recent growth in the ratio. In other words, it gives a numerical and comparable value of how fast miners outperformed.
This value moved to its previous extreme and this was the case only two times in the recent past. Once about a month ago, and once in February. What happened next? The orange line in the background of the above chart shows what happened in gold. It moved back and forth for several days and then it declined. The most important thing is that the rally didn’t continue in any significant way. Whether it was the top or not wasn’t that critical. It was critical to close any remaining long positions at that time and at least consider opening short positions. In the absence of other bearish factors, one might have preferred to wait for more bearish confirmations, but at this time we have multiple sell signals in place, many of which are very strong.
In Metallica’s Mama Said song, one of the verses starts with the statement that “the brightest flame burns quickest” and it’s likely that we just saw an example thereof in case of the gold stocks to gold ratio. The rally was too sharp to be sustainable and thus it’s quite likely to end rather sooner than later.
This brings us to the “how did it happen” part of yesterday’s price action.
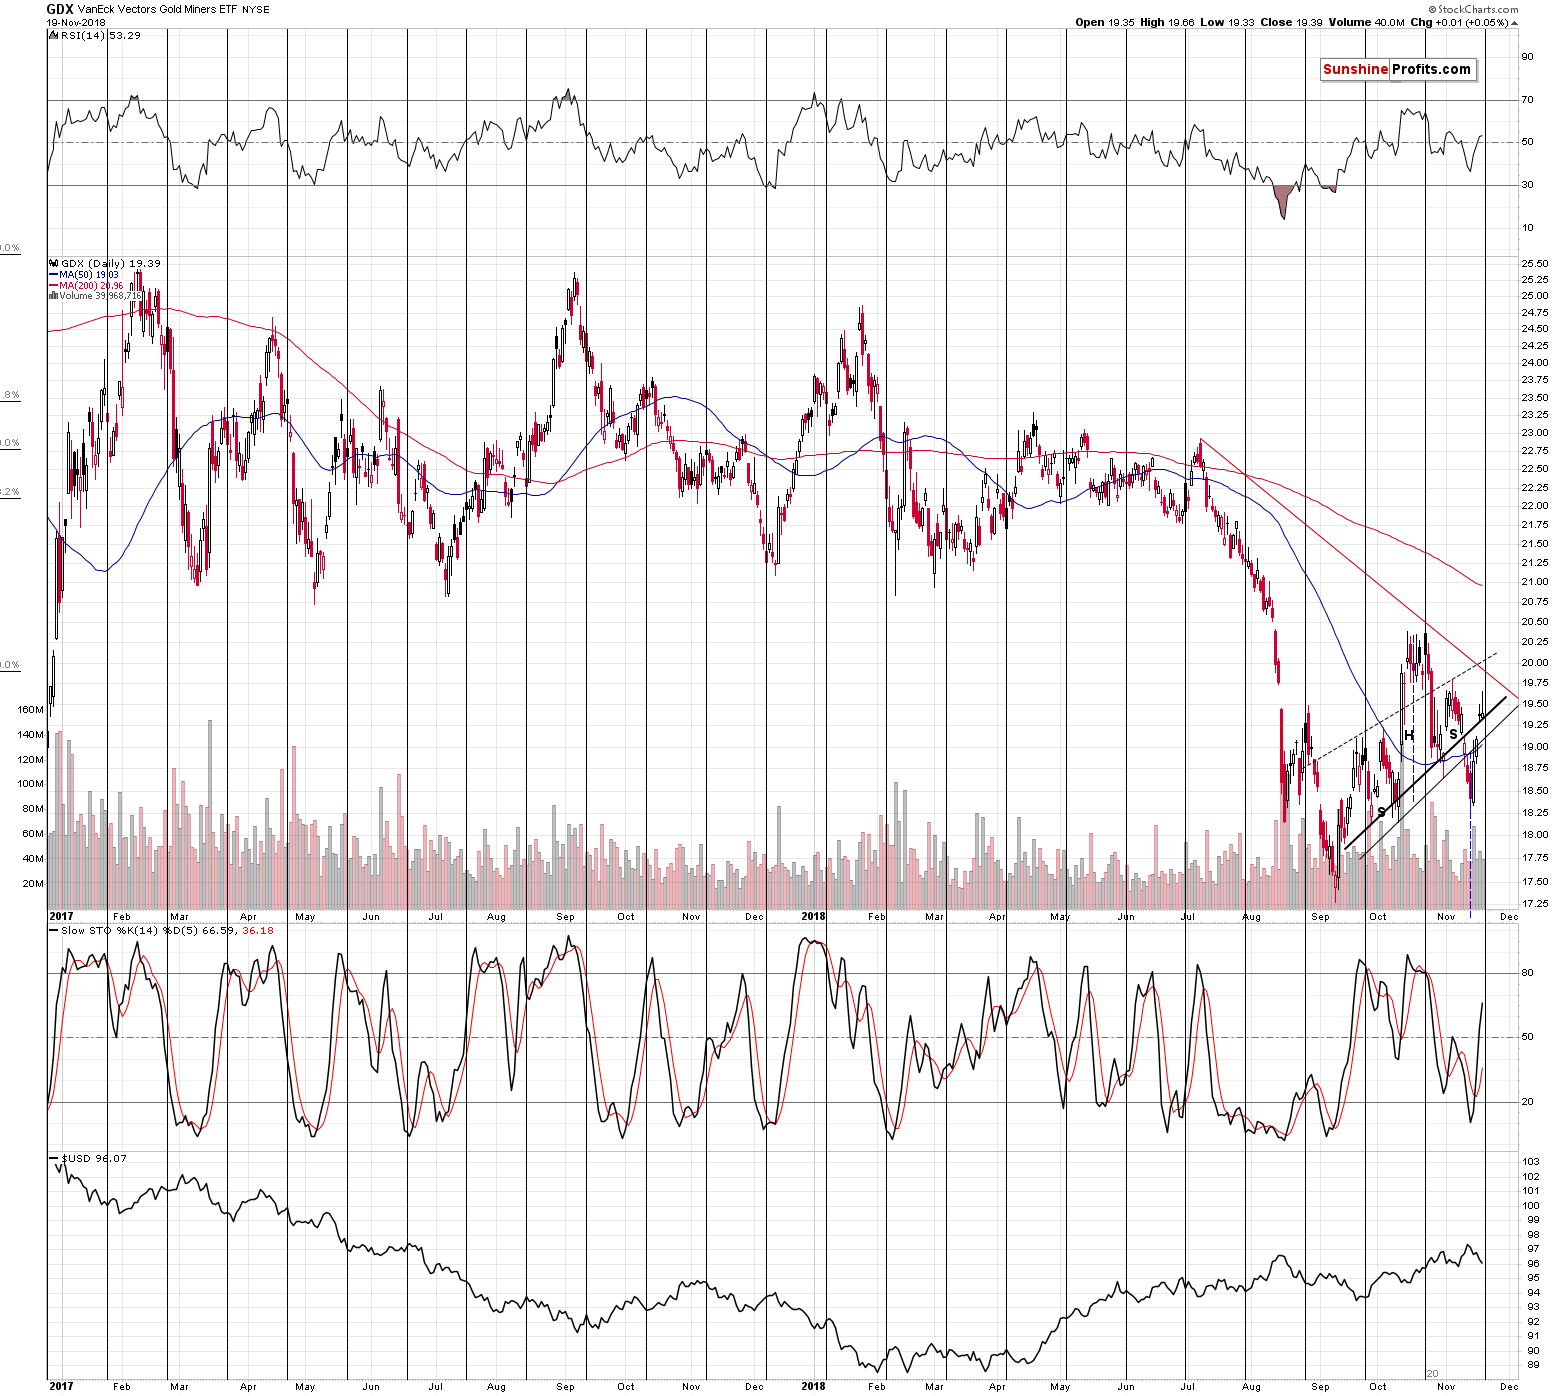
Both proxies for the mining stocks: the HUI Index and the GDX ETF moved higher yesterday, but reversed and erased their previous gains before the end of the session. Precisely: the GDX ETF erased a little less than it had gained, and the HUI Index erased a little more than it had gained.
The momentum had been strong, so it’s quite normal that they initially moved higher. But, what is not normal and what should get one’s attention, is the weakness that followed. If this was a true rally, miners should have shown strength and they certainly didn’t. They got ahead of themselves like it was indicated by the ROC indicator in the HUI to gold ratio. In yesterday’s analysis, we emphasized that this spike in the ROC most likely suggested that the rally is not likely to continue in any significant way. And that’s exactly what happened.
The PMs had a good reason to rally further (a daily decline in the USDX) and they didn’t. Miners should have rallied and they didn’t – they showed that they had it in them (early rally) and that “it” wasn’t enough. “It” – the buying power seems to have dried up. If the buyers are giving up, then who’s going to keep pushing the price higher? The likely action for the price in such case is to simply decline. And that is the outcome that is confirmed by multiple strong medium-term sell signals.
Silver’s Upcoming Reversal
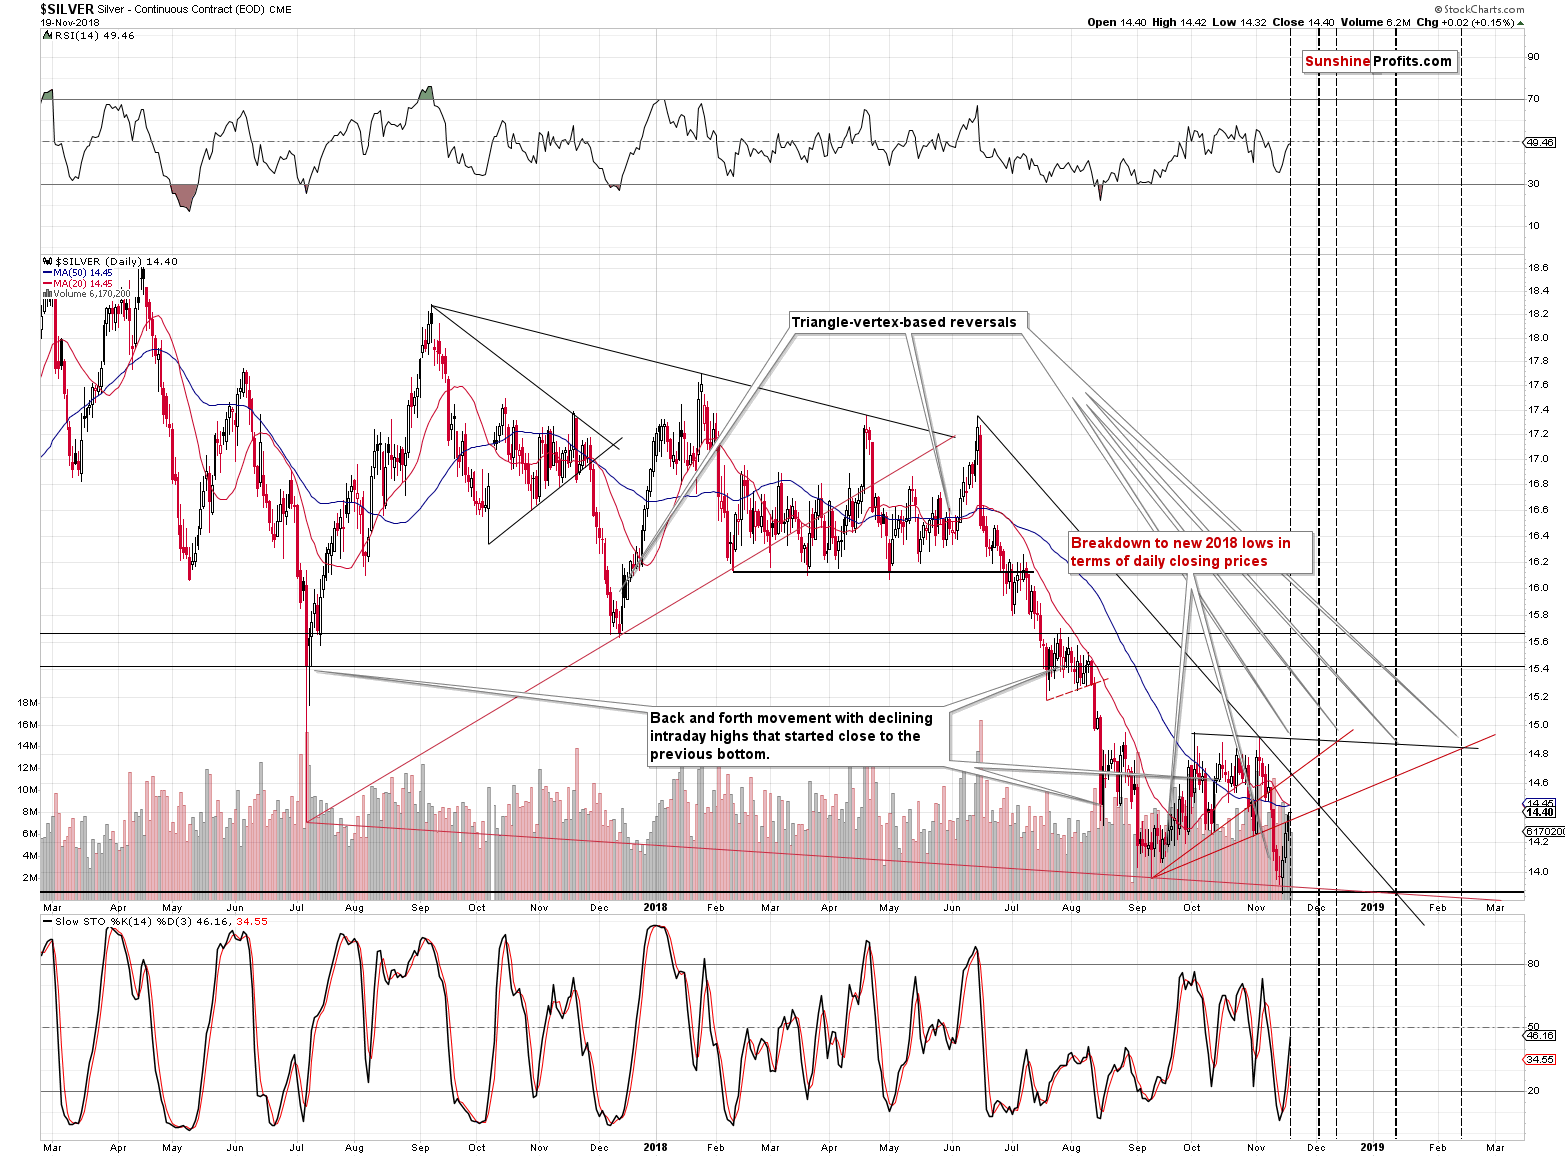
Silver’s triangle-vertex-based reversal is today… Or tomorrow, as it’s not 100% clear if the lines (upper rising red line and the black declining line) cross today or tomorrow. The reversal might take place today or we might have seen it yesterday.
Actually, if silver moves higher today, outperforming gold, it will not be a bullish sign. The white metal tends to outperform right before local tops and since we are expecting such top to form here, temporarily (perhaps just a few hours of exceptional strength relative to gold) rally in silver would be quite normal.
Then again, we wouldn’t bet the farm on this rally and the reason is the analogy to 2013, when silver corrected 50% of the previous decline before plunging. And silver is at this important retracement right now. Consequently, an additional upswing would make the current situation less similar to what happened in 2013 and since the link between both situations remains in place, bigger deviations from it are not likely.
Still, the analogy to 2013 is exactly that – an analogy – not a 100% copy. Consequently, even if silver moves above the current 50% retracement, it will not automatically invalidate the 2013-now link.
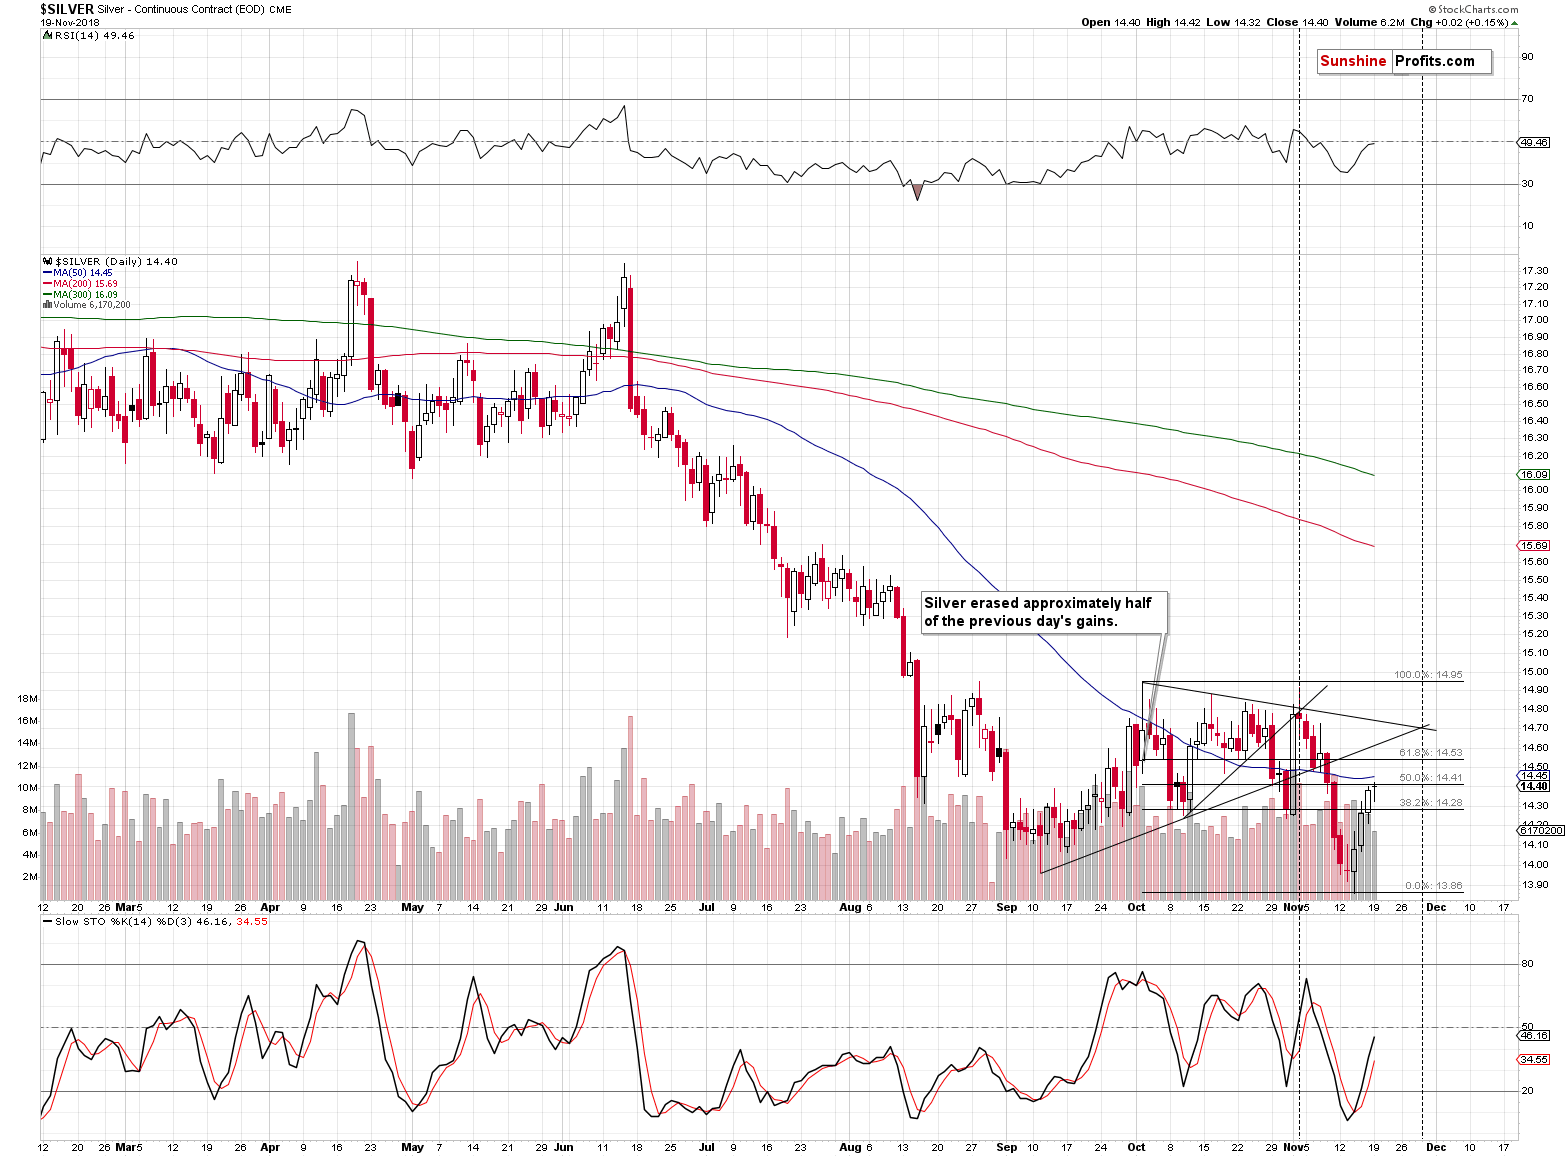
All in all, the very short-term outlook for silver (meaning today and tomorrow) is not clear, but it doesn’t matter much, because the outlook is clear for the next several weeks and the amount of bearish confirmations that we have is more than enough to justify the current trading positions.
If you haven’t read yesterday’s Alert, we strongly encourage you to do so today – it explains silver’s 2013-now link in greater detail.
Administrative Note Regarding This and Next Week’s Publication Schedule
The long Thanksgiving weekend is approaching. There will be no / limited trading in the final part of this week and we will be taking this opportunity to take some time off from our regular analyses. Tomorrow’s (Wednesday’s) Alert will likely be very brief. There will be no regular Alerts on Thursday and Friday. The Monday’s (November 26th) and Tuesday’s (November 27th) Alerts will most likely be very short as well.
However, the above does not mean that we will stop monitoring the market entirely. Conversely, the time is quite critical, so despite taking time off from regular tasks, we will be monitoring the market and if anything urgent happens, we will let you know through a quick intraday Alert.
Summary
Summing up, the small corrective upswing that was likely to take place based on the few short-term bullish signals seems to have already taken place – either entirely, or mostly. It seems that we will not have to wait long before the big downswings resumes. And if the likely outcome takes place and the decline is indeed similar to the one from 2013, all this waiting will be extremely well worth it. We may see somewhat higher PM prices in the next few days, but this move is not likely to change anything. The key word here is “may” – the big plunge could take place any day, so we are not adjusting our positions based on the above possibility. The risk to reward ratio continues to favor short positions in gold, silver, and mining stocks because of all the long-term factors that remain in place and that we discussed recently. It seems very likely that gold, silver and mining stocks will soon do what bitcoin did recently – they will dive (by the way, we’ve been shorting bitcoin). The difference is that the precious metals sector is likely to form a major bottom within the next several months and then rally above its previous highs, whereas bitcoin’s future may not be so bright.
As always, we’ll keep you – our subscribers – informed.
To summarize:
Trading capital (supplementary part of the portfolio; our opinion): Full short positions (250% of the full position) in gold, silver and mining stocks are justified from the risk/reward perspective with the following stop-loss orders and exit profit-take price levels:
- Gold: profit-take exit price: $1,062; stop-loss: $1,257; initial target price for the DGLD ETN: $82.96; stop-loss for the DGLD ETN $49.27
- Silver: profit-take exit price: $12.32; stop-loss: $15.11; initial target price for the DSLV ETN: $47.67; stop-loss for the DSLV ETN $28.37
- Mining stocks (price levels for the GDX ETF): profit-take exit price: $13.12; stop-loss: $20.83; initial target price for the DUST ETF: $80.97; stop-loss for the DUST ETF $27.67
Note: the above is a specific preparation for a possible sudden price drop, it does not reflect the most likely outcome. You will find a more detailed explanation in our August 1 Alert. In case one wants to bet on junior mining stocks’ prices (we do not suggest doing so – we think senior mining stocks are more predictable in the case of short-term trades – if one wants to do it anyway, we provide the details), here are the stop-loss details and target prices:
- GDXJ ETF: profit-take exit price: $17.52; stop-loss: $31.23
- JDST ETF: initial target price: $154.97 stop-loss: $51.78
Long-term capital (core part of the portfolio; our opinion): No positions (in other words: cash)
Insurance capital (core part of the portfolio; our opinion): Full position
Important Details for New Subscribers
Whether you already subscribed or not, we encourage you to find out how to make the most of our alerts and read our replies to the most common alert-and-gold-trading-related-questions.
Please note that the in the trading section we describe the situation for the day that the alert is posted. In other words, it we are writing about a speculative position, it means that it is up-to-date on the day it was posted. We are also featuring the initial target prices, so that you can decide whether keeping a position on a given day is something that is in tune with your approach (some moves are too small for medium-term traders and some might appear too big for day-traders).
Plus, you might want to read why our stop-loss orders are usually relatively far from the current price.
Please note that a full position doesn’t mean using all of the capital for a given trade. You will find details on our thoughts on gold portfolio structuring in the Key Insights section on our website.
As a reminder – “initial target price” means exactly that – an “initial” one, it’s not a price level at which we suggest closing positions. If this becomes the case (like it did in the previous trade) we will refer to these levels as levels of exit orders (exactly as we’ve done previously). Stop-loss levels, however, are naturally not “initial”, but something that, in our opinion, might be entered as an order.
Since it is impossible to synchronize target prices and stop-loss levels for all the ETFs and ETNs with the main markets that we provide these levels for (gold, silver and mining stocks – the GDX ETF), the stop-loss levels and target prices for other ETNs and ETF (among other: UGLD, DGLD, USLV, DSLV, NUGT, DUST, JNUG, JDST) are provided as supplementary, and not as “final”. This means that if a stop-loss or a target level is reached for any of the “additional instruments” (DGLD for instance), but not for the “main instrument” (gold in this case), we will view positions in both gold and DGLD as still open and the stop-loss for DGLD would have to be moved lower. On the other hand, if gold moves to a stop-loss level but DGLD doesn’t, then we will view both positions (in gold and DGLD) as closed. In other words, since it’s not possible to be 100% certain that each related instrument moves to a given level when the underlying instrument does, we can’t provide levels that would be binding. The levels that we do provide are our best estimate of the levels that will correspond to the levels in the underlying assets, but it will be the underlying assets that one will need to focus on regarding the signs pointing to closing a given position or keeping it open. We might adjust the levels in the “additional instruments” without adjusting the levels in the “main instruments”, which will simply mean that we have improved our estimation of these levels, not that we changed our outlook on the markets. We are already working on a tool that would update these levels on a daily basis for the most popular ETFs, ETNs and individual mining stocks.
Our preferred ways to invest in and to trade gold along with the reasoning can be found in the how to buy gold section. Additionally, our preferred ETFs and ETNs can be found in our Gold & Silver ETF Ranking.
As a reminder, Gold & Silver Trading Alerts are posted before or on each trading day (we usually post them before the opening bell, but we don't promise doing that each day). If there's anything urgent, we will send you an additional small alert before posting the main one.
=====
Latest Free Trading Alerts:
Powell is apparently between a rock and a hard place. Inflation surged, while the global economy slowed down. What will he do? And how will gold react?
Powell and Gold between Inflation and Global Slowdown
=====
Thank you.
Sincerely,
Przemyslaw Radomski, CFA
Editor-in-chief, Gold & Silver Fund Manager
Gold & Silver Trading Alerts
Forex Trading Alerts
Oil Investment Updates
Oil Trading Alerts


