

Briefly: in our opinion, full (250% of the regular position size) speculative short positions in mining stocks are justified from the risk/reward point of view at the moment of publishing this Alert.
The analogy to the first half of March in silver was practically perfect. They say that all good things come to an end, and so did this perfection. But does it mean that the entire similarity can be thrown out of the window? Conservatism bias should be avoided, but there's also a limit to which one should take new information into account without giving them a second thought. After all, it's prudent to wait for a confirmation of a breakout or a breakdown for a reason.
So, what happened in the silver market, and what didn't?
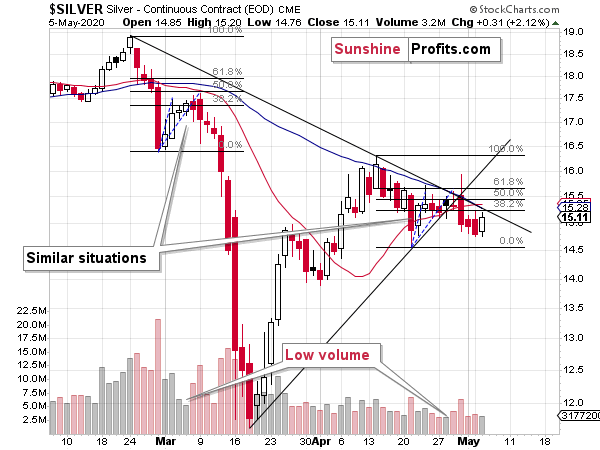
On Thursday, the white metal reversed and declined profoundly on relatively big volume - just like it had done on March 9th. In the following two trading days, it had moved lower, but just slightly so. That's exactly what happened also this month - on May 1st and May 4th. And then...
In March, silver then plunged, and it took the white metals just three more days to slide below $12 from about $17.
As the starting point for silver for now is approximately $15, could it slide to about $10 in just 3 trading days?
Obviously, silver didn't slide profoundly yesterday (conversely, it moved higher), so the day-to-day similarity is no longer perfect. Does the lack of perfection invalidate the similarity altogether? No, at least not yet.
A useful question to ask is if this similarity - aside from the previous several days - was perfect from the beginning? It wasn't.
The mid-April bottom appears to be analogous to the late-February bottom, and the blue dashed lines (might not be clear at first sight, but once one knows where to look, they become visible) that connected these bottoms along with initial and final tops, were almost identical.
Almost.
Almost, means that they were not perfect, and the difference was in the length of the consolidation. The final short-term top took place a day later than the blue dashed line suggested. Initially, it even seemed that silver was breaking higher - above the declining resistance line.
Did this daily delay or the initial move in the other direction change the analogy? No. It delayed its consequences. Silver reversed and declined, anyway. And it did so in a profound manner, just like it did on March 9th. Throwing the analogy out of the window in late April would have been a mistake, a moderately costly one. Now, if the analogy does remain intact, then throwing it out of the window would now be very costly, as the follow-up move is likely to be much bigger.
Silver is up in today's pre-market trading, and it's once again above its declining resistance line. It's the same line that it tried to break on April 30th, right before sliding during the day. Should we trust this move at this time, and view the bearish March - now analogy as invalidated? It seems too early for that, especially that viewing silver's short-term outperformance of gold as a bearish gold indicator is one of the most important gold trading tips. In our opinion, the bearish implications thereof remain intact, especially since it's just one of the markets that showed similarity to this period.
Gold and mining stocks moved higher yesterday, but the moves were not huge and they didn't invalidate our previous comments. Our comments on the link between gold and the USD Index remains up-to-date as well:
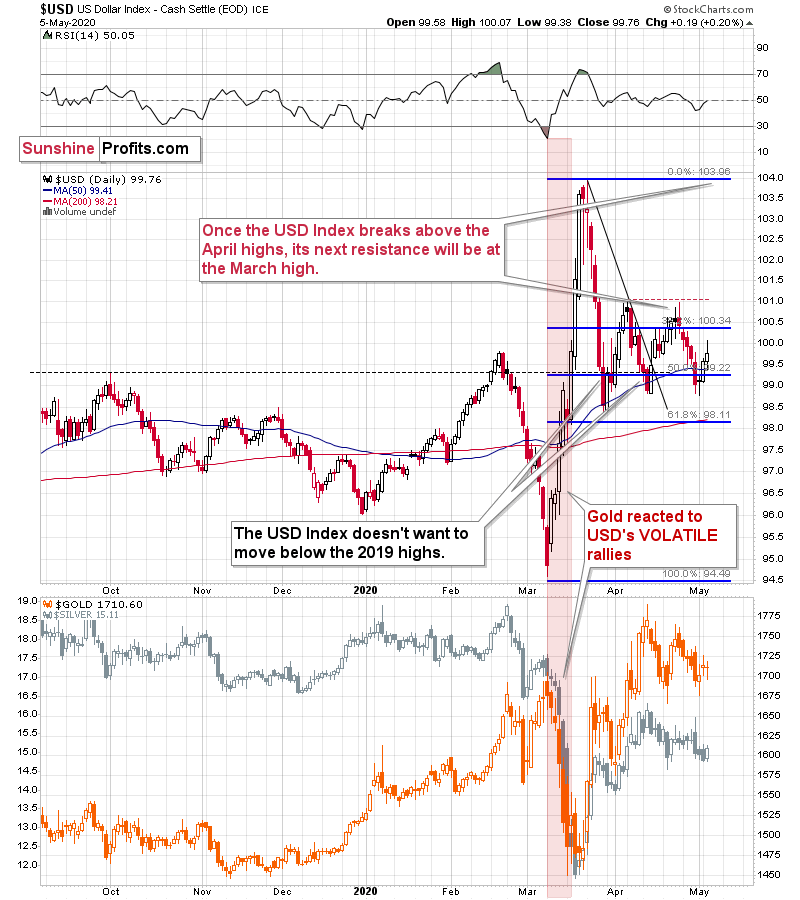
The USD Index moved higher (invalidating the breakdown below the 50-day moving average), but not particularly sharply so it's little wonder that gold didn't plunge. Gold futures moved slightly lower (while the GLD ETF closed slightly higher, which explains the daily gain in the miners - as we discussed in details in yesterday's Gold Trading Alert), but without any major repercussions.
Right now, the price moves appear to be taking place at a slower pace than their March pace of decline, but the price moves are similar, nonetheless. Back in March, gold declined with the USD Index for just one day, and this time they both declined for a several days. This time, gold corrected for two days (three if taking GLD into account), so by comparison, perhaps it corrected similarly significantly during the session? If so, then the analogy would remain present... And that was exactly what happened.
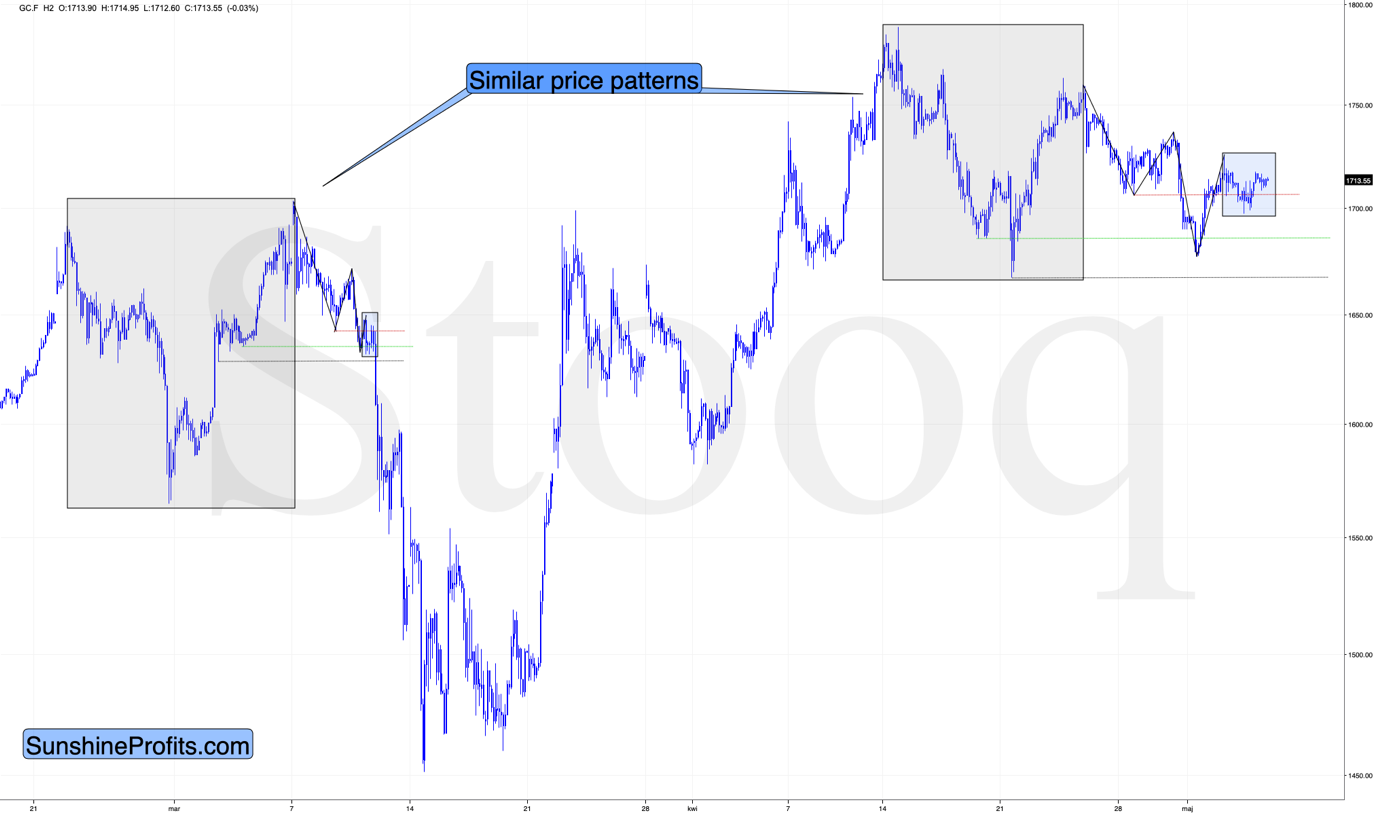
Looking at the above 2-hour gold chart, we see that gold's recent price movement resembles what the yellow metal did on March 11th and 12th. We connected the analogous highs and lows with black lines, and we used red, green, and black dotted lines to show you which levels were broken, and which ones were not.
The March 11th and 12th consolidation took place around the level of the most recent low - marked with red dotted line. It started when gold moved below one of the recent lows (the higher one - marked with green dotted line), but not below the final of the recent lows (the lowest one - marked with black dotted line).
Back in March, this was the final pause before the big drop, so the implications of the above similarity are bearish.
Please note that the price patterns that led to the above-mentioned self-similarity are similar as well - we marked them with grey rectangles.
From the Readers' Mailbag
Q: Hey PR: I honestly don't get it. I follow Stephanie Kammerman who tracks the Dark Pool prints of the big Wall Street firms. On March 20 there was a massive 3 million share print of UUP, the dollar index and then on April 7th there was the largest print of USDU that she had ever seen of 6 million shares of this dollar index. She was so moved that she wrote a blog about it saying it would have huge ramifications for gold. And what have these indexes done since then = NOTHING! I know that the Dark Pool sold the IAU shares of gold at the top and it appears they sold GDX at around $34 so it appeared you were onto something. But gold won't go down if the dollar goes down and folks are buying the QQQs like it is 1999 all over again! You keep saying to wait and wait and wait but what will make the dollar go up when the Fed & Treasury have debased the currency beyond any precedent?
A: These are critical times, so the amounts and volume levels can be truly epic, indeed. If this is indeed the case that there were huge trades in the dark pools (private exchanges that are generally not publicly available, and that are used by big institutions to conduct large transactions without impacting the market price). Ms. Kammerman writes in this blog post the following:
How can this information benefit you? Whenever we get massive prints on this index fund, we get massive moves on the dollar. If you trade forex, this could really give you an edge knowing that a big potential move on the dollar is about to happen. If you don't trade forex, here's another way you can use this valuable information.
If the dollar goes down, it must go down against something. Some years, the dollar has fallen fast against gold, and most likely gold would continue to rise if the dollar falls.
However, the exact opposite could happen if the dollar were to rise off this incoming Dark Pool volume.
In short, this is in tune with our preceding analysis. Now, let's speculate about how this could be taking place behind the scenes (all below is a mix of assumptions and estimations, not a fact, but it's easier to write in this way, without using "might have" every second word):
Really big players have already made huge bets for the moves in the US dollar index, which makes all the major bullish signals for it stronger. It's interesting that the bets were made about a month ago, on days when the USDX-based ETFs were declining after the rally. It's as if someone knew that something much bigger is just around the corner, and wanted to enter the market while it was still relatively easy to do so. Buying during daily declines is much easier than during rallies, as you don't have to chase the price higher, risking that the orders won't get filled. This might be particularly important, when the trades are so huge. Buying well ahead of the really big move (even a month) is also a good idea if you have a huge amount of capital, as you don't want to risk triggering the move before your entire order is already filled. Once the big guys have their positions, they can wait out whatever the smaller investors are going to do and ignore the temporary price moves while they wait for the move that they "knew" is coming.
As the big guys wait, we should see some signs of gold investment public's activity in the market. Remember that recently gold soared while it made headlines? Guess who's buying based on the headlines. Hint: it's not the pros. The mining stocks were one of the worst-performing parts of the stock market during the March decline. And they now soared. Investment public buys what is or just was very cheap, just because of that (note: this factor is not fully bearish, as it might actually be the real strength of the PM sector here - we view it as doubtful, but felt it needs to be said for greater clarity). Finally, did you notice that silver outperformed gold visibly during the previous top (April 30th), and it's doing so also today? That's yet another sign of investment public's activity. Among other reasons connecting silver's very short-term outperformance with investment public, silver is much smaller and more prone to being moved by individual investors.
What would trigger the moves? There doesn't have to be absolutely any meaningful trigger. When the market is ready to slide from the technical / emotional point of view, it will just react to some random event or news announcement. There are tens of them released each day and the market could attribute greater weight to any of them. If something profound happens or a profound news is released, it could speed things up, but regular news are likely to be enough anyway. Good candidates are ADP nonfarm employment change (released today), initial jobless claims (released tomorrow), non-farm payrolls (released on Friday), inflation, and GDP numbers. Plus, any official and unofficial (speeches) from monetary authorities (especially by the Fed). Or it could be something as small as Donald Trump's tweet. Or a new record in the Covid-19 death toll (it's about 71k in the US, and the UK just surpassed Italy in the death toll, moving to the second place globally, at least according to the official numbers).
Finally, let's take a look at something interesting on the UUP ETF chart (proxy for the USD Index).
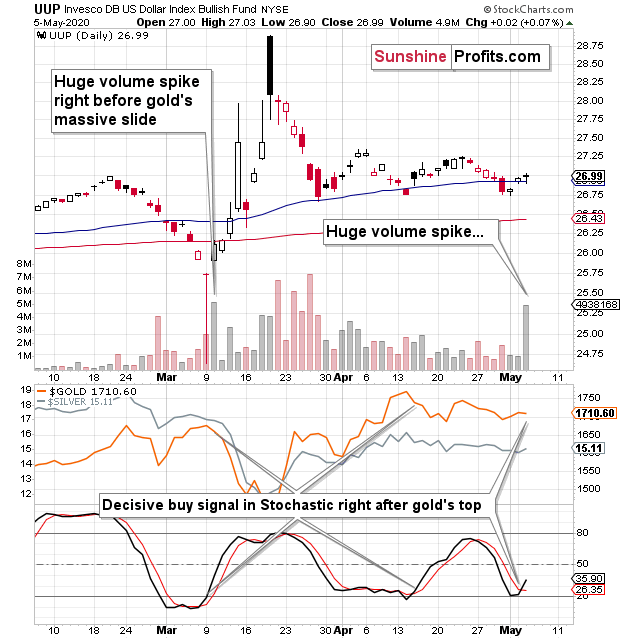
Please note yesterday's huge volume spike. There was only one similar volume spike in the past several weeks and it took place at an analogous time - right before the big rally in the USD Index, and right before the massive slide in gold, silver, and mining stocks. That's yet another confirmation of the March - May similarity.
We get another confirmation from the Stochastic indicator based on the UUP ETF. It just flashed a decisive buy signal. There were only two cases when it had done so in the recent past and they were both right after gold's top and before its short-term decline. The implications are bearish, and when combined with other points made today and in the previous days, they are very bearish.
Summary
Summing up, the outlook for the precious metals market remains very bearish for the next few weeks. The general stock market seems to have already topped, which means that the bearish pressure on the mining stocks and silver is now likely to be much bigger than it was in April. Gold declined along with the USD Index last week, which has very bearish implications for the precious metals sector, because gold is likely to truly plunge once the USD Index finally rallies in a meaningful way. And it is likely to rally in a meaningful way, not only for purely technical reasons, but also thanks to plunging stock markets, and demand coming from the BRIC (and other) countries.
The above is particularly likely given multiple signs pointing to self-similarity between the current situation and what we saw in early March. The spike-high volume in the UUP ETF, and silver's very short-term outperformance serve as additional bearish confirmations.
After the sell-off (that takes gold below $1,400), we expect the precious metals to rally significantly. The final decline might take as little as 1-3 weeks, so it's important to stay alert to any changes.
Most importantly - stay healthy and safe. We made a lot of money on the March decline and the subsequent rebound (it's initial part) price moves (and we'll likely make much more in the following weeks and months), but you have to be healthy to really enjoy the results.
By the way, we recently opened a possibility to extend one's subscription for a year with a 10% discount in the yearly subscription fee (the profits that you took have probably covered decades of subscription fees...). It also applies to our All-Inclusive Package (if you didn't know - we just made huge gains shorting crude oil and are also making money on both the decline and temporary rebound in stocks). The boring time in the PMs is over and the time to pay close attention to the market is here - it might be a good idea to secure more access while saving 10% at the same time.
Important: If your subscription got renewed recently, but you'd like to secure more access at a discount - please let us know, we'll make sure that the discount applies right away, while it's still active. Moreover, please note that you can secure more access than a year - if you secured a yearly access, and add more years to your subscription, each following year will be rewarded with an additional 10% discount (20% discount total). We would apply this discount manually - please contact us for details.
Secure more access at a discount.
As always, we'll keep you - our subscribers - informed.
To summarize:
Trading capital (supplementary part of the portfolio; our opinion): Full speculative short positions (250% of the full position) in mining stocks is justified from the risk to reward point of view with the following binding exit profit-take price levels:
Senior mining stocks (price levels for the GDX ETF): binding profit-take exit price: $10.32; stop-loss: none (the volatility is too big to justify a SL order in case of this particular trade); binding profit-take level for the DUST ETF: $231.75; stop-loss for the DUST ETF: none (the volatility is too big to justify a SL order in case of this particular trade)
Junior mining stocks (price levels for the GDXJ ETF): binding profit-take exit price: $9.57; stop-loss: none (the volatility is too big to justify a SL order in case of this particular trade); binding profit-take level for the JDST ETF: $284.25; stop-loss for the JDST ETF: none (the volatility is too big to justify a SL order in case of this particular trade)
For-your-information targets (our opinion; we continue to think that mining stocks are the preferred way of taking advantage of the upcoming price move, but if for whatever reason one wants / has to use silver or gold for this trade, we are providing the details anyway. In our view, silver has greater potential than gold does):
Silver futures downside profit-take exit price: $8.58 (the downside potential for silver is significant, but likely not as big as the one in the mining stocks)
Gold futures downside profit-take exit price: $1,382 (the target for gold is least clear; it might drop to even $1,170 or so; the downside potential for gold is significant, but likely not as big as the one in the mining stocks or silver)
Long-term capital (core part of the portfolio; our opinion): No positions (in other words: cash)
Insurance capital (core part of the portfolio; our opinion): Full position
Whether you already subscribed or not, we encourage you to find out how to make the most of our alerts and read our replies to the most common alert-and-gold-trading-related-questions.
Please note that the in the trading section we describe the situation for the day that the alert is posted. In other words, it we are writing about a speculative position, it means that it is up-to-date on the day it was posted. We are also featuring the initial target prices, so that you can decide whether keeping a position on a given day is something that is in tune with your approach (some moves are too small for medium-term traders and some might appear too big for day-traders).
Plus, you might want to read why our stop-loss orders are usually relatively far from the current price.
Please note that a full position doesn't mean using all of the capital for a given trade. You will find details on our thoughts on gold portfolio structuring in the Key Insights section on our website.
As a reminder - "initial target price" means exactly that - an "initial" one, it's not a price level at which we suggest closing positions. If this becomes the case (like it did in the previous trade) we will refer to these levels as levels of exit orders (exactly as we've done previously). Stop-loss levels, however, are naturally not "initial", but something that, in our opinion, might be entered as an order.
Since it is impossible to synchronize target prices and stop-loss levels for all the ETFs and ETNs with the main markets that we provide these levels for (gold, silver and mining stocks - the GDX ETF), the stop-loss levels and target prices for other ETNs and ETF (among other: UGLD, DGLD, USLV, DSLV, NUGT, DUST, JNUG, JDST) are provided as supplementary, and not as "final". This means that if a stop-loss or a target level is reached for any of the "additional instruments" (DGLD for instance), but not for the "main instrument" (gold in this case), we will view positions in both gold and DGLD as still open and the stop-loss for DGLD would have to be moved lower. On the other hand, if gold moves to a stop-loss level but DGLD doesn't, then we will view both positions (in gold and DGLD) as closed. In other words, since it's not possible to be 100% certain that each related instrument moves to a given level when the underlying instrument does, we can't provide levels that would be binding. The levels that we do provide are our best estimate of the levels that will correspond to the levels in the underlying assets, but it will be the underlying assets that one will need to focus on regarding the signs pointing to closing a given position or keeping it open. We might adjust the levels in the "additional instruments" without adjusting the levels in the "main instruments", which will simply mean that we have improved our estimation of these levels, not that we changed our outlook on the markets. We are already working on a tool that would update these levels on a daily basis for the most popular ETFs, ETNs and individual mining stocks.
Our preferred ways to invest in and to trade gold along with the reasoning can be found in the how to buy gold section. Additionally, our preferred ETFs and ETNs can be found in our Gold & Silver ETF Ranking.
As a reminder, Gold & Silver Trading Alerts are posted before or on each trading day (we usually post them before the opening bell, but we don't promise doing that each day). If there's anything urgent, we will send you an additional small alert before posting the main one.
Thank you.
Sincerely,
Przemyslaw Radomski, CFA
Editor-in-chief, Gold & Silver Fund Manager

