Briefly: in our opinion, full (300% of the regular position size) speculative short positions in junior mining stocks are justified from the risk/reward point of view at the moment of publishing this Alert.
Today’s short-term analysis will once again be in video format. However, to make a long story short, the precious metals sector declined yesterday, and what we wrote previously remains up-to-date.
Having said that, let’s take a look at the markets from a more fundamental angle.
Is Gold Running Toward a Cliff?
With gold, silver and mining stocks continuing to climb on Jan. 4, the metals have become the momentum kings of the financial markets. However, while their prices head in one direction, their fundamentals have diverged. As a result, when market participants come around to the hawkish realities that are bearish for many risk assets, the PMs’ drawdowns could be fast and furious.
To explain, the narrative proclaims that the Fed will pivot in 2023, and the front running has begun for the PMs. But, the fundamentals do not support this thesis, and the employment data signals a much more hawkish outlook,
The U.S. Bureau of Labor Statistics (BLS) released its JOLTS job openings report on Jan. 4; and with hiring intentions outperforming expectations, the medium-term outlook for wage inflation remains highly bullish.
Please see below:
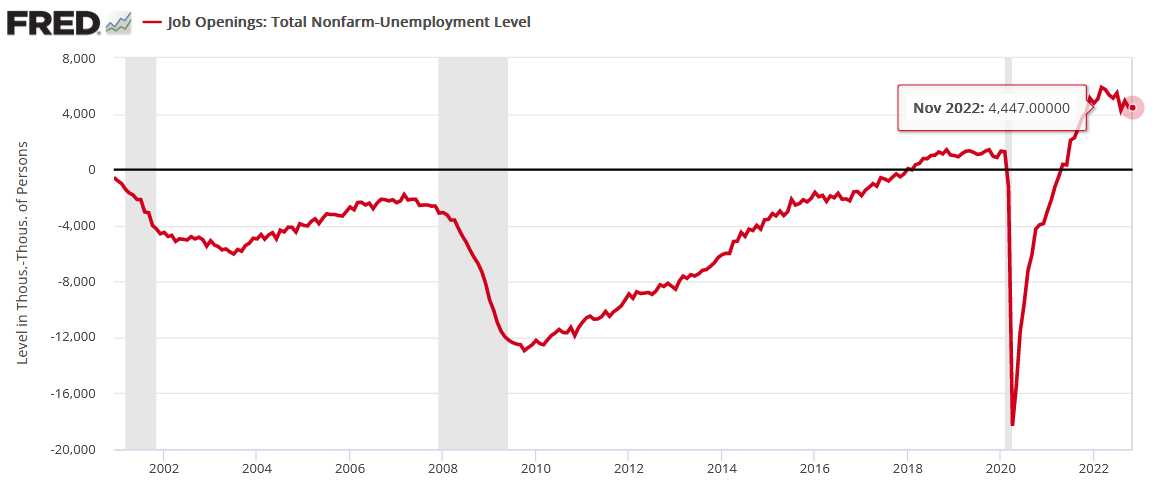
To that point, with nearly 4.5 million more job openings than Americans unemployed, the imbalances built up post-pandemic have decelerated at a snail’s pace. Therefore, the U.S. federal funds rate (FFR) needs to continue its ascent to normalize supply and demand in the U.S. labor market.
Please see below:
To explain, the red line above tracks the number of unemployed Americans from the number of JOLTS job openings. If you analyze the right side of the chart, you can see that labor demand remains well above supply, and investors underestimate the liquidity drain required to restore the historical symmetry.
Likewise, the Institute for Supply Management (ISM) released its manufacturing PMI on Jan. 4; and while the headline index declined from 49 in November to 48.4 in December, an excerpt read:
“ISM's Employment Index registered 51.4 percent in December, 3 percentage points higher than the November reading of 48.4 percent…. An Employment Index above 50.5 percent, over time, is generally consistent with an increase in the BLS data on manufacturing employment.”
In addition, S&P Global released its U.S. manufacturing PMI on Jan. 3. The headline index declined from 47.7 in November to 46.2 in December. However, the report stated:
“Firms recorded only a slight increase in employment. The rate of job creation was the second-slowest in the current 29-month sequence of growth, as some firms filled long-held vacancies for skilled workers.”
So, while varying degrees of strength are present, the important point is that U.S. firms are still increasing their headcount, and labor demand remains robust. As such, the results are bullish for wage inflation, output inflation and the FFR. In turn, the backdrop is also bullish for real yields and the USD Index, and it’s likely only a matter of time before the PMs wake up to these fundamental realities.
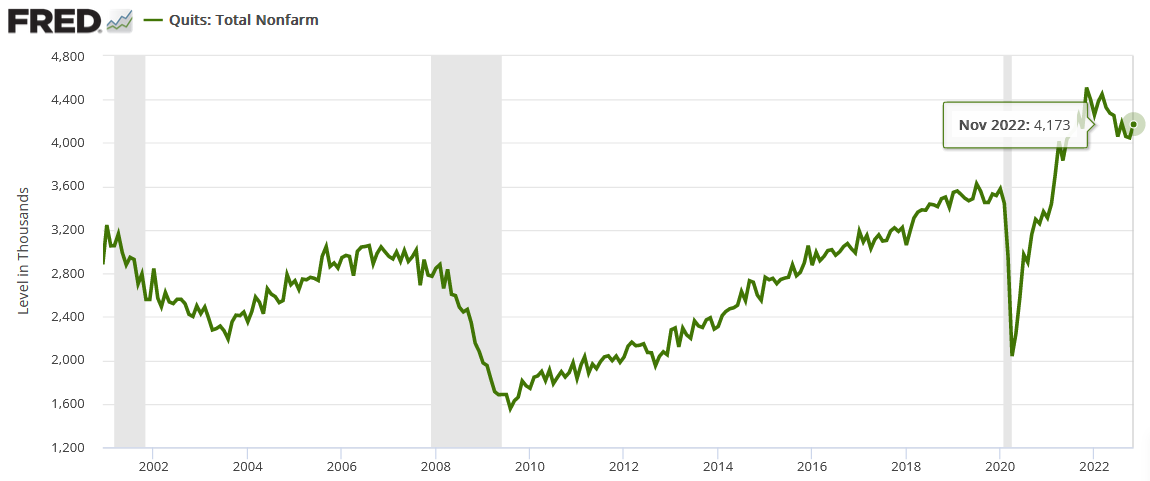
As further evidence, the number of Americans quitting their jobs increased in November, which highlights their confidence in finding other opportunities. Remember, individuals only voluntarily leave positions when better ones arise or when they’re in secure financial positions. Consequently, the data highlights why the liquidity drain needs to continue to create the necessary demand destruction to reduce inflation.
Please see below:
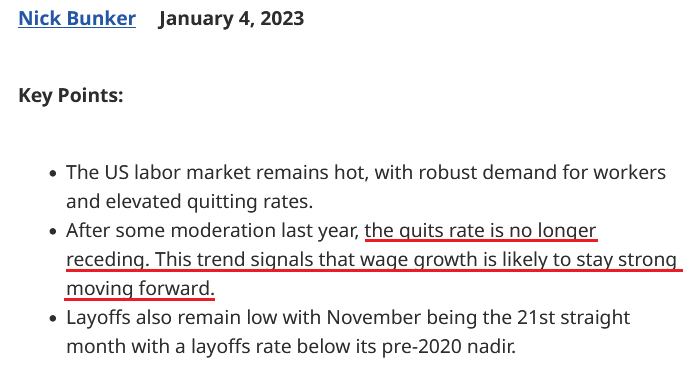
Speaking of which, Nick Bunker, Economic Research Director for North America at the Indeed Hiring Lab, wrote on Jan. 4:
“The U.S. labor market remains on fire. The flames may have receded a bit from the highs of the initial reopening of the economy, but demand for workers remains robust and workers are seizing new opportunities. By any measure, the new data from this report shows a tight, hot labor market. A labor market this strong means an imminent recession is highly improbable.”
Please see below:
On top of that, we warned on Dec. 7 that investors’ recession fears were premature and that the FFR’s best days still lie ahead. We wrote:
With the recession narrative contrasting the data, gold’s medium-term drawdown should be driven by a higher FFR, not an unprovoked collapse of the U.S. economy.
To explain, a recession is bullish for the USD Index and bearish for the FFR, while a resilient U.S. economy is bullish for both. Therefore, while we’ve warned repeatedly that every inflation fight since 1954 has ended with a recession, and we expect one to materialize in late 2023, timing matters.
Furthermore, with the current and historical data contrasting the collapse calls, financial conditions need to tighten dramatically to curb inflation and create the necessary demand destruction to induce a recession. So, the FFR should seek higher ground, and the liquidity drain should continue to haunt the PMs.
Consequently, while the PMs rally as they assume the opposite, the fundamentals continue to unfold as expected: demand is outperforming expectations, and the crowd underestimates the ramifications for rate hikes and QT.
Also revealing, imbalances during the pandemic created a boom-and-bust cycle for technology employment; and with major layoffs announced in recent months, investors assumed that the isolated weakness was prevalent across all industries.
Yet, we warned this thesis contrasted reality, and the Wall Street Journal (WSJ) reported on Dec. 27:
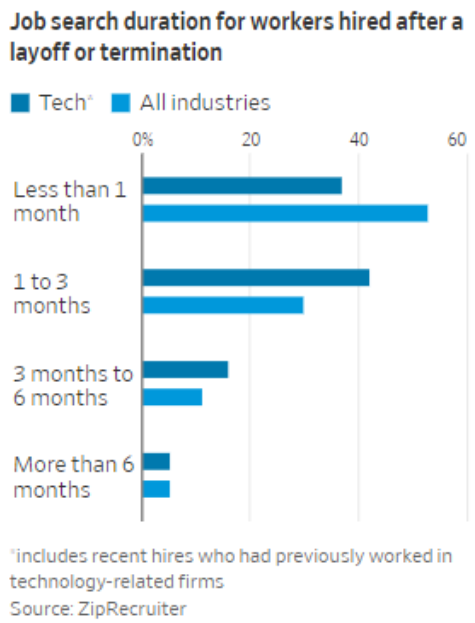
“Most laid off tech workers are finding jobs shortly after beginning their search, a new survey shows, as employers continue to scoop up workers in a tight labor market.
“About 79% of workers recently hired after a tech-company layoff or termination landed their new job within three months of starting their search, according to a ZipRecruiter survey of new hires. That was just below the 83% share of all laid-off workers who were re-employed in the same time frame.”
Please see below:
Thus, the key point is that the U.S. labor market remains resilient, and even the weakness in the technology sector is less ominous than feared. As a result, interest rates are too low to win this inflation battle, and recency bias has the bulls following the post-GFC script. Remember, it’s easy for inflation to decelerate from 8%. But, with wage inflation running at 5%+, the Fed needs to materially cool the labor market to achieve further progress, and the ramifications are far from priced in.
Overall, while the PMs have built their castles on faulty foundations, the bulls are happy to let the price action guide their positioning. However, with household checkable deposits at a record high and wage inflation not far behind, our message throughout 2021 and 2022 remains as relevant as ever: consumers are flush with cash, demand won’t plunge on its own, and the crowd underestimates the potential for higher-for-longer interest rates.
Gold Rolls While Silver Slows
Despite the recent enthusiasm surrounding the PMs, silver was a noticeable underperformer on Jan. 4; and with the S&P 500 ending the day in the green, the white metal’s decline was even more noteworthy. Thus, while one day doesn’t make a trend, silver’s fundamentals are tracking in the same bearish direction as gold.
For example, the FOMC released the minutes from its Dec. 13-14 monetary policy meeting on Jan. 4; and with the revelations highly hawkish, the PMs are ignoring the developments at their own peril. An excerpt read:
“Participants reaffirmed their strong commitment to returning inflation to the Committee's 2 percent objective. A number of participants emphasized that it would be important to clearly communicate that a slowing in the pace of rate increases was not an indication of any weakening of the Committee's resolve to achieve its price-stability goal or a judgment that inflation was already on a persistent downward path.”
In addition:
“Several participants commented that the medians of participants' assessments for the appropriate path of the federal funds rate in the Summary of Economic Projections, which tracked notably above market-based measures of policy rate expectations, underscored the Committee's strong commitment to returning inflation to its 2 percent goal.”
On top of that:
“With inflation still elevated, the staff continued to view the risks to the inflation projection as skewed to the upside (…).”
“Some participants also noted that, by some measures, firms' markups were still elevated and that a continued subdued expansion in aggregate demand would likely be needed to reduce remaining upward pressure on inflation.”
So, while the FOMC emphasized its “resolve to achieve its price-stability goal,” and noted that its peak FFR estimate “tracked notably above market-based measures of policy rate expectations,” investors still assume the FOMC is bluffing.
However, we’ve noted repeatedly that the fundamentals support higher interest rates, and the post-GFC crowd should learn this lesson the hard way over the medium term.
To that point, the FOMC minutes added:
Therefore, while the silver price has benefited from “a misperception by the public of the Committee’s reaction function,” we warned on Dec. 15 that looser financial conditions were antithetical to the FOMC’s goals. We wrote:
Higher stock prices, lower interest rates, a weaker U.S. dollar and smaller credit spreads support inflation and make the Fed's job harder. Again, that's why investors' hopes for a dovish pivot actually reduce the chances of one occurring.
The more the markets dissent, the more inflation will reign, and the higher the Fed will need to push the FFR. As a result, don't be surprised if economic reality haunts the pivot bulls in the months ahead.
To that point, while the PMs have largely ignored the ramifications, the FOMC’s battle against an “unwarranted easing in financial conditions” should materially shift sentiment over the medium term.
Please see below:
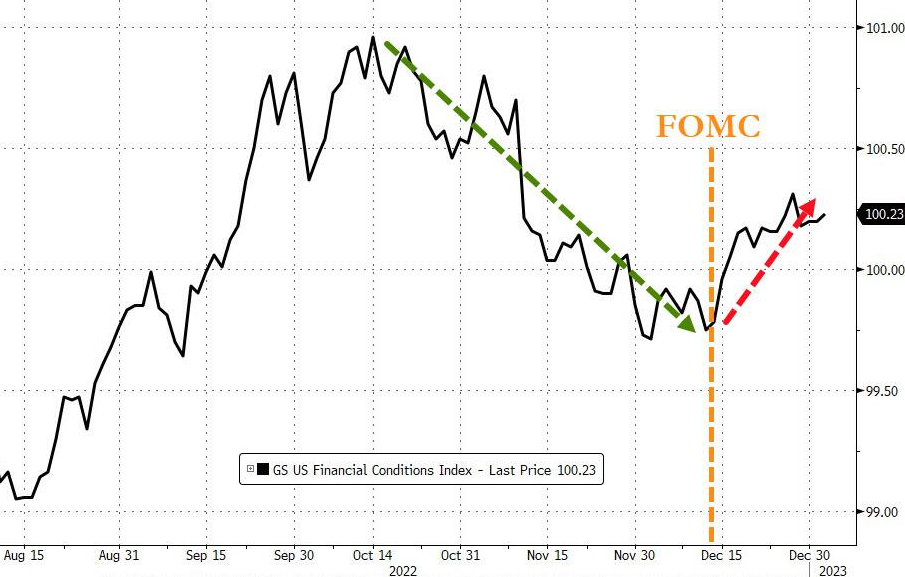
To explain, the black line above tracks Goldman Sachs U.S. Financial Conditions Index (FCI). If you analyze the middle of the chart, you can see that the deceleration from mid-October to mid-December is the opposite of what the Fed wants; so unsurprisingly, the FOMC reversed this narrative on Dec. 14, and the rising black line on the right side of the chart highlights how the fundamentals continue to align with our expectations.
Thus, we expect the FCI, the USD Index and the U.S. 10-Year real yield to hit new highs in 2023. Remember, higher values for all three help alleviate inflation, and the crowd is uninformed about what it will take to permanently reduce the pricing pressures.
Finally, as mining stocks print lower highs versus the S&P 500, please note that silver is highly volatile and exudes similar characteristics; and since we see a sharp slide in the S&P 500 in 2023, silver and mining stocks should suffer the brunt of the devastation.
Moreover, with Satori Fund Manager Dan Niles highlighting the S&P 500’s disdain for inflation on Jan. 3, the PMs are unlikely to celebrate if the S&P 500 comes under pressure. He wrote:
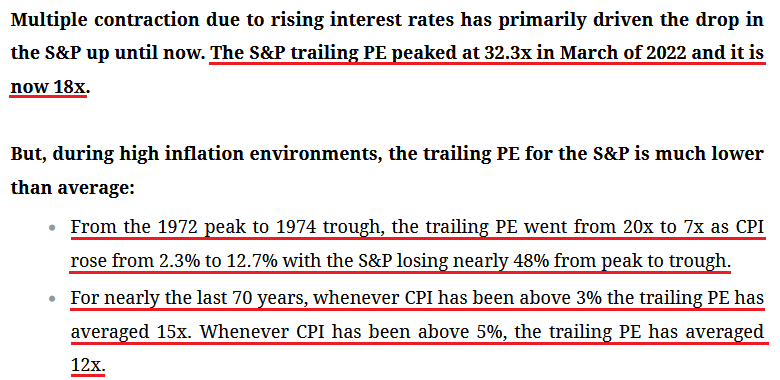
“We believe that reductions in S&P earnings estimates and further multiple compression will drive the next market move lower (…).
“We think the estimate for CY23 will eventually be closer to $200 from its peak of $252 when looking at earnings reductions during prior recessions. In 2022 these estimate cuts led to drops in the stock market and we believe the same will hold for 2023.
“Our single point price target for the market bottom on the S&P is 3,000 derived from 2023 S&P EPS of $200 with a 15x multiple. At the low end we can see the S&P reach 2,400 based on a 12x multiple which is not unreasonable at inflation levels above 5% historically.”
Please see below:
Overall, silver exudes the same misguided optimism that drove its other bear market rallies in 2022. Yet, when investors' pivot hopes crashed, the silver price followed suit. As such, while the bulls remain loyal to their post-GFC playbook, we believe the game has changed, and the dip buyers should suffer more pain before it's all said and done.
The Bottom Line
The lack of demand destruction in the U.S. labor market highlights why the FFR should have plenty of room to run. Furthermore, while Fed officials continuously issue hawkish warnings, their plethora of post-GFC pivots have the crowd viewing them as ‘The Boy Who Cried Wolf.’ But, this is not 2018 or 2020, and more QE can’t solve this fundamental predicament. So, when reality returns, the PMs should undergo substantial re-pricings.
In conclusion, the PMs were mixed on Jan. 4, as silver ended the day in the red; and while the USD Index and the U.S. 10-Year real yield both declined, uninformed narratives have been the primary culprit. As a result, we expect a reversal of fortunes over the medium term.
Overview of the Upcoming Part of the Decline
- It seems to me that the corrective upswing is over (or about to be over) and that the next big move lower is already underway (or that it’s about to start).
- If we see a situation where miners slide in a meaningful and volatile way while silver doesn’t (it just declines moderately), I plan to – once again – switch from short positions in miners to short positions in silver. At this time, it’s too early to say at what price levels this could take place and if we get this kind of opportunity at all – perhaps with gold prices close to $1,500 - $1,550.
- I plan to switch from the short positions in junior mining stocks or silver (whichever I’ll have at that moment) to long positions in junior mining stocks when gold / mining stocks move to their 2020 lows (approximately). While I’m probably not going to write about it at this stage yet, this is when some investors might consider getting back in with their long-term investing capital (or perhaps 1/3 or 1/2 thereof).
- I plan to return to short positions in junior mining stocks after a rebound – and the rebound could take gold from about $1,450 to about $1,550, and it could take the GDXJ from about $20 to about $24. In other words, I’m currently planning to go long when GDXJ is close to $20 (which might take place when gold is close to $1,450), and I’m planning to exit this long position and re-enter the short position once we see a corrective rally to $24 in the GDXJ (which might take place when gold is close to $1,550).
- I plan to exit all remaining short positions once gold shows substantial strength relative to the USD Index while the latter is still rallying. This may be the case with gold prices close to $1,400 and GDXJ close to $15 . This moment (when gold performs very strongly against the rallying USD and miners are strong relative to gold after its substantial decline) is likely to be the best entry point for long-term investments, in my view. This can also happen with gold close to $1,400, but at the moment it’s too early to say with certainty.
- The above is based on the information available today, and it might change in the following days/weeks.
You will find my general overview of the outlook for gold on the chart below:
Please note that the above timing details are relatively broad and “for general overview only” – so that you know more or less what I think and how volatile I think the moves are likely to be – on an approximate basis. These time targets are not binding nor clear enough for me to think that they should be used for purchasing options, warrants, or similar instruments.
Letters to the Editor
We received a few messages over e-mail, but as we are moving to our new Golden Meadow platform, we will be transferring them below the articles as comments – and that’s where we’ll be replying to them.
On the platform, please ask your questions below the articles or in the spaces called “Ask the Community” or “Position Sizes” directly – it will help us deliver a reply sooner. In some cases, someone from the community might reply and help even before we do.
Please remember about the Pillars of our Community, especially about the Kindness of Speech Pillar.
Also, if there’s anything that you’re unhappy with, it’s best to send us a message at [email protected].
Please note that this section is going to go away within the next 1-8 weeks, as you can add comments/questions below the article on Golden Meadow – the platform that we’re using to provide our analyses. Your notification e-mails include an invitation link that allows you to access the “Gold Trading Alerts” space.
Also, if you haven’t had the chance to see the video, in which I’m talking about the new platform and why we essentially moved from Sunshine Profits to Golden Meadow, I strongly encourage you to do so:
Summary
Summing up, it seems that the major bottom in the USD Index is in, while the correction in stocks, gold, silver, and mining stocks is over or very close to being over.
The nature of the recent corrections was mostly technical and rumor-based. The rumor was that the Fed would be making a dovish U-turn soon, and it recently became clear that this was not going to be the case. Consequently, the corrective upswing is likely to be reversed, and medium-term downtrends are likely to resume.
In my opinion, the current trading position is going to become profitable in the following weeks, and quite possibly in the following days. And while I can’t promise any kind of performance, I fully expect it to become very profitable before it’s over and to prolong our 2022 winning streak.
After the final sell-off (that takes gold to about $1,350-$1,500), I expect the precious metals to rally significantly. The final part of the decline might take as little as 1-5 weeks, so it's important to stay alert to any changes.
As always, we'll keep you – our subscribers – informed.
To summarize:
Trading capital (supplementary part of the portfolio; our opinion): Full speculative short positions (300% of the full position) in junior mining stocks are justified from the risk to reward point of view with the following binding exit profit-take price levels:
Mining stocks (price levels for the GDXJ ETF): binding profit-take exit price: $20.32; stop-loss: none (the volatility is too big to justify a stop-loss order in case of this particular trade)
Alternatively, if one seeks leverage, we’re providing the binding profit-take levels for the JDST (2x leveraged). The binding profit-take level for the JDST: $22.87; stop-loss for the JDST: none (the volatility is too big to justify a SL order in case of this particular trade).
For-your-information targets (our opinion; we continue to think that mining stocks are the preferred way of taking advantage of the upcoming price move, but if for whatever reason one wants / has to use silver or gold for this trade, we are providing the details anyway.):
Silver futures downside profit-take exit price: $14.32
SLV profit-take exit price: $13.42
ZSL profit-take exit price: $48.87
Gold futures downside profit-take exit price: $1,504
HGD.TO – alternative (Canadian) 2x inverse leveraged gold stocks ETF – the upside profit-take exit price: $16.47
HZD.TO – alternative (Canadian) 2x inverse leveraged silver ETF – the upside profit-take exit price: $36.87
Long-term capital (core part of the portfolio; our opinion): No positions (in other words: cash)
Insurance capital (core part of the portfolio; our opinion): Full position
Whether you’ve already subscribed or not, we encourage you to find out how to make the most of our alerts and read our replies to the most common alert-and-gold-trading-related-questions.
Please note that we describe the situation for the day that the alert is posted in the trading section. In other words, if we are writing about a speculative position, it means that it is up-to-date on the day it was posted. We are also featuring the initial target prices to decide whether keeping a position on a given day is in tune with your approach (some moves are too small for medium-term traders, and some might appear too big for day-traders).
Additionally, you might want to read why our stop-loss orders are usually relatively far from the current price.
Please note that a full position doesn't mean using all of the capital for a given trade. You will find details on our thoughts on gold portfolio structuring in the Key Insights section on our website.
As a reminder - "initial target price" means exactly that - an "initial" one. It's not a price level at which we suggest closing positions. If this becomes the case (as it did in the previous trade), we will refer to these levels as levels of exit orders (exactly as we've done previously). Stop-loss levels, however, are naturally not "initial", but something that, in our opinion, might be entered as an order.
Since it is impossible to synchronize target prices and stop-loss levels for all the ETFs and ETNs with the main markets that we provide these levels for (gold, silver and mining stocks - the GDX ETF), the stop-loss levels and target prices for other ETNs and ETF (among other: UGL, GLL, AGQ, ZSL, NUGT, DUST, JNUG, JDST) are provided as supplementary, and not as "final". This means that if a stop-loss or a target level is reached for any of the "additional instruments" (GLL for instance), but not for the "main instrument" (gold in this case), we will view positions in both gold and GLL as still open and the stop-loss for GLL would have to be moved lower. On the other hand, if gold moves to a stop-loss level but GLL doesn't, then we will view both positions (in gold and GLL) as closed. In other words, since it's not possible to be 100% certain that each related instrument moves to a given level when the underlying instrument does, we can't provide levels that would be binding. The levels that we do provide are our best estimate of the levels that will correspond to the levels in the underlying assets, but it will be the underlying assets that one will need to focus on regarding the signs pointing to closing a given position or keeping it open. We might adjust the levels in the "additional instruments" without adjusting the levels in the "main instruments", which will simply mean that we have improved our estimation of these levels, not that we changed our outlook on the markets. We are already working on a tool that would update these levels daily for the most popular ETFs, ETNs and individual mining stocks.
Our preferred ways to invest in and to trade gold along with the reasoning can be found in the how to buy gold section. Furthermore, our preferred ETFs and ETNs can be found in our Gold & Silver ETF Ranking.
As a reminder, Gold & Silver Trading Alerts are posted before or on each trading day (we usually post them before the opening bell, but we don't promise doing that each day). If there's anything urgent, we will send you an additional small alert before posting the main one.
Thank you.
Przemyslaw K. Radomski, CFA
Founder, Editor-in-chief


