Briefly: In our opinion, full (100% of the regular full position) speculative long positions in gold, silver and mining stocks are justified from the risk/reward perspective at the moment of publishing this alert.
Normally, gold rallies along with the euro, but this hasn’t been the case recently. The EUR soared this week, but gold declined. Gold doesn’t seem to react to a falling USD and miners are underperforming the yellow metal – what are the implications?
At first sight, both implications are bearish, but is this really the case? Let’s take a closer look at the charts (chart courtesy of http://stockcharts.com), starting with the Euro Index – after all, the movement in the euro and comments from the Eurozone were the main fundamental reason behind gold’s weakness this week.
Euro Index
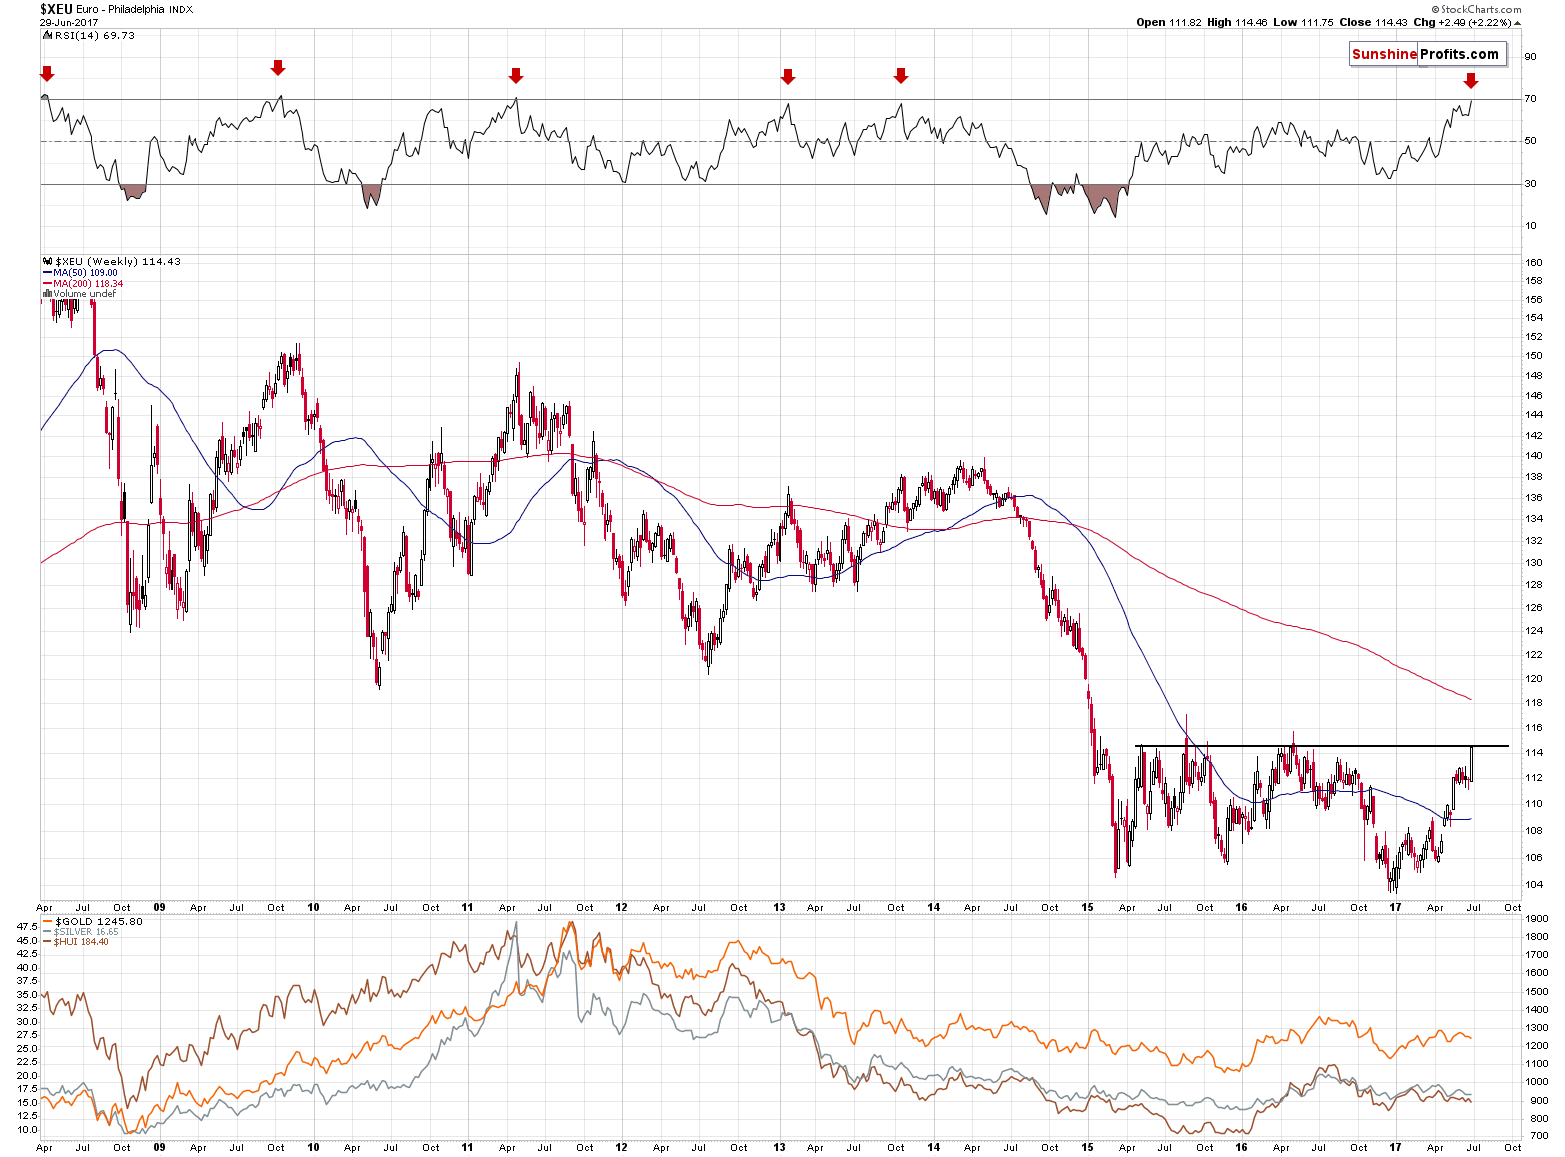
In short, it strongly appears that the euro has either reached its top or is about to do so shortly (perhaps today). The horizontal resistance line that you can see on the above chart is based on the highest weekly closes of the previous years. The weekly closing prices are the key closes to keep in mind in the case of bigger trends and the level that was just reached stopped the rally twice. There were temporary moves above it, but they all were very temporary. Since the week is ending today, it appears that the top is in or that we will see only a temporary upswing and a weekly close back at/below the resistance line.
A strong bearish confirmation comes from the RSI indicator – practically in all recent case (the last 9 years), the readings of the RSI that were as high as the current ones meant that the euro was going to reverse shortly.
So, despite the bullish action this week, the outlook for the euro is actually very bearish and the chart is quite clear about that.
The key question is: how does this relate to the gold market?
In most cases, the euro and gold moved together and thus, in most cases, the interpretation was quite straightforward – what’s bearish for the euro is bearish for gold. However, it was recently the case that the same reason caused the euro to rally and gold to decline – indications that the fundamental situation in the Eurozone is improving.
Consequently, applying the regular relation between the euro and gold in this case may be misleading, as gold showed that this time it behaves differently. The analytical problem here is that it could be the case that as the euro reverses, other things that resulted from the previous upswing in it will also reverse. This would imply a move higher in gold along with a declining euro.
Gold’s Price Changes
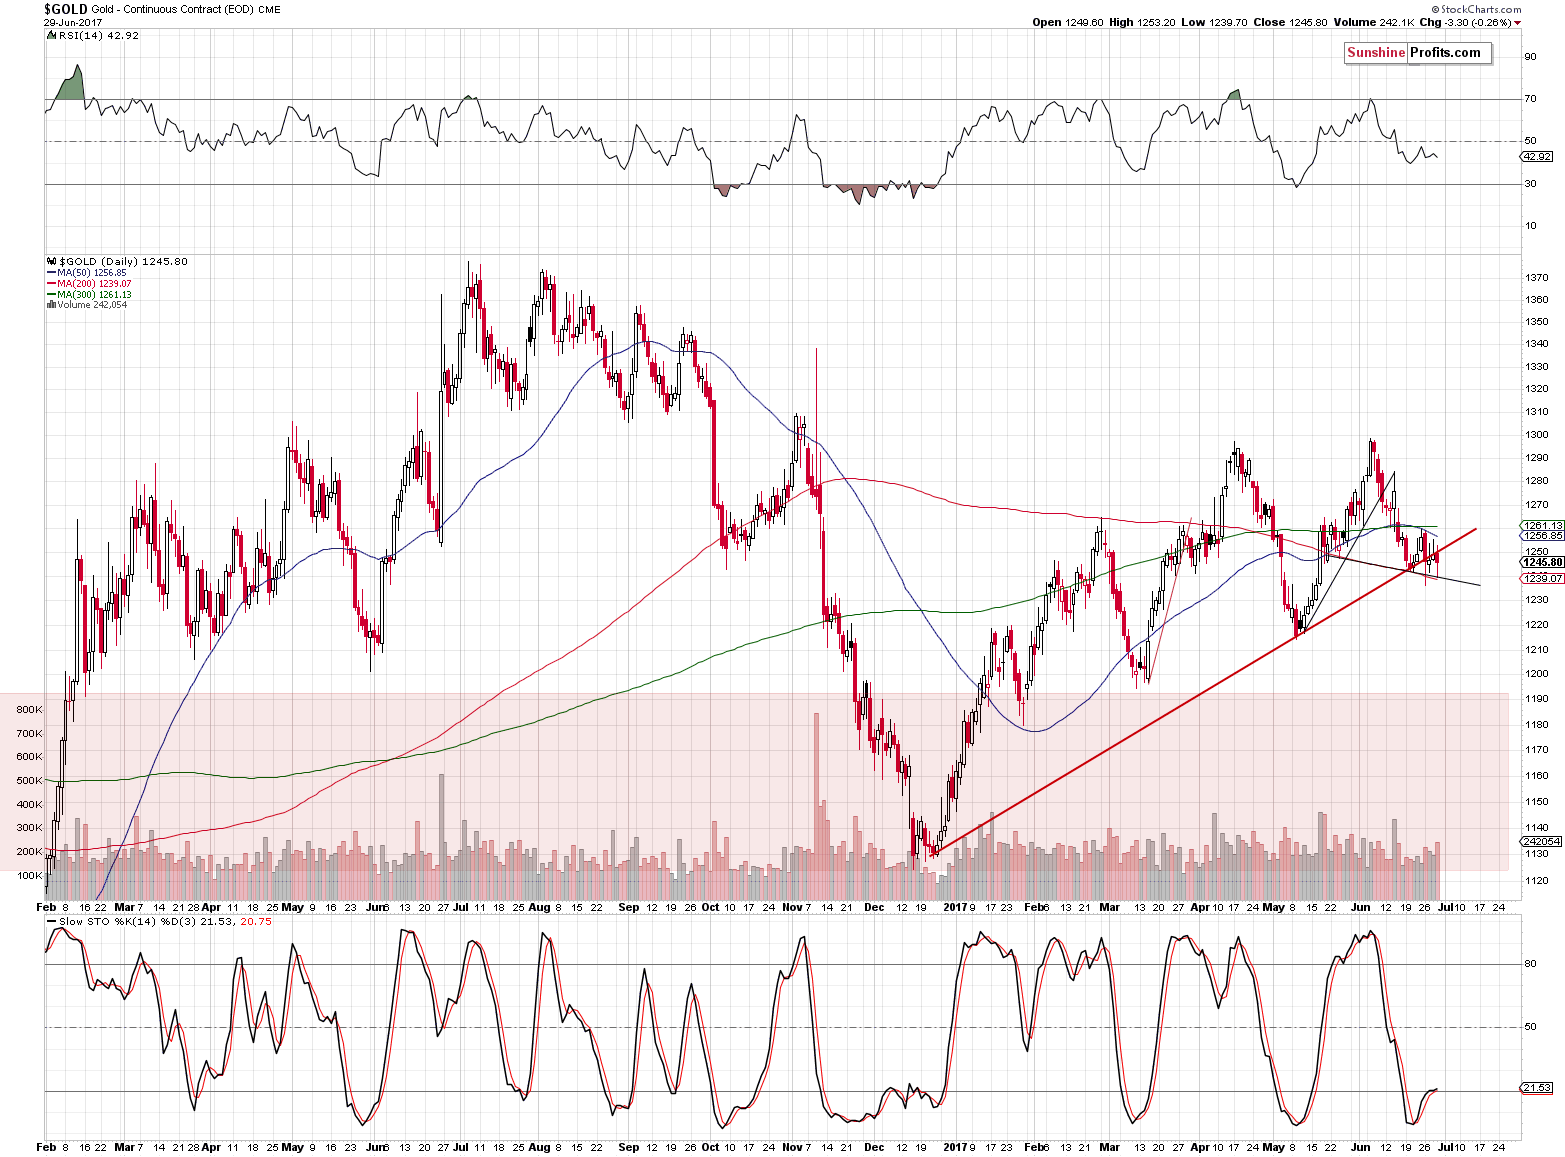
At this moment, gold’s chart doesn’t seem to imply anything new. Yes, gold moved below the rising red support line, but the $4 move was so small that it doesn’t appear to have any implications so far. At this moment, gold is more or less at the level at which we opened the long positions and overall not much has changed technically since that time (except for yesterday’s tiny breakdown). Even the buy signal from the Stochastic indicator hasn’t been invalidated and remains in place.
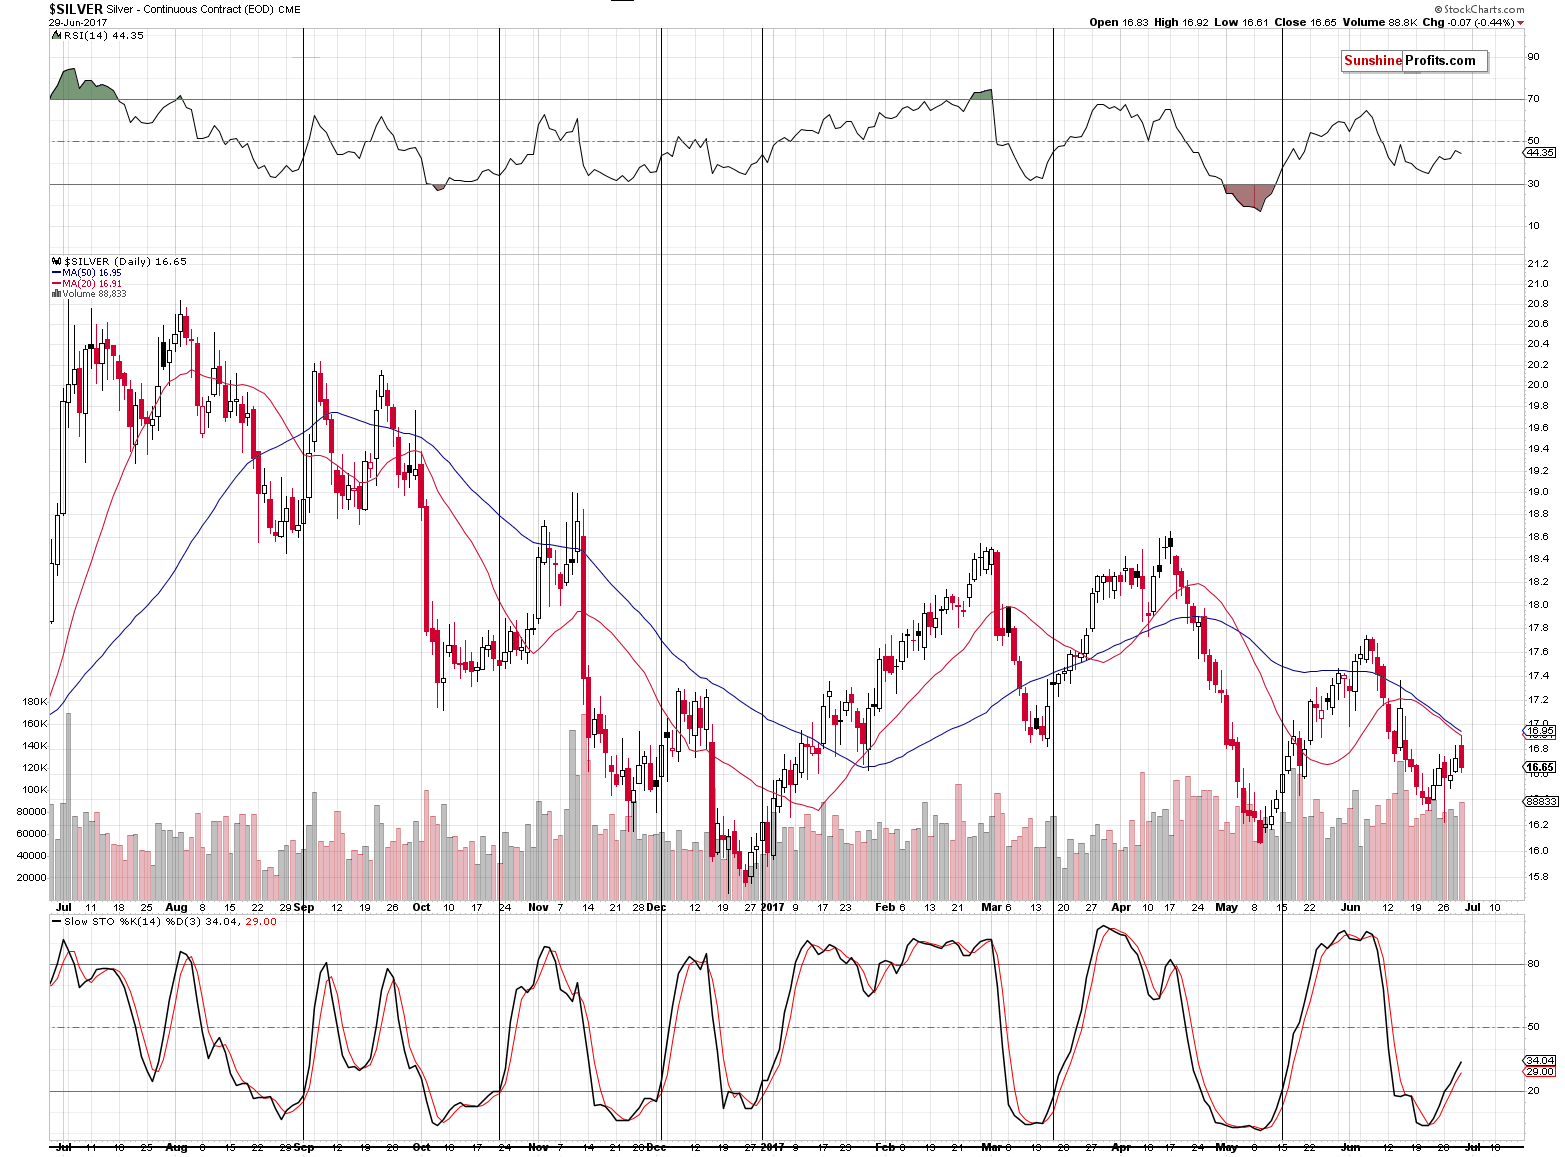
The same goes for silver – the price of the white metal is above the close after which we opened the long position, but overall nothing really changed from the technical point of view. The buy signal from the Stochastic indicator remains in place and please note that when it flashed below 20, it remained in place (and silver kept on rallying) until it moved above 80. It’s at 34 at this time.
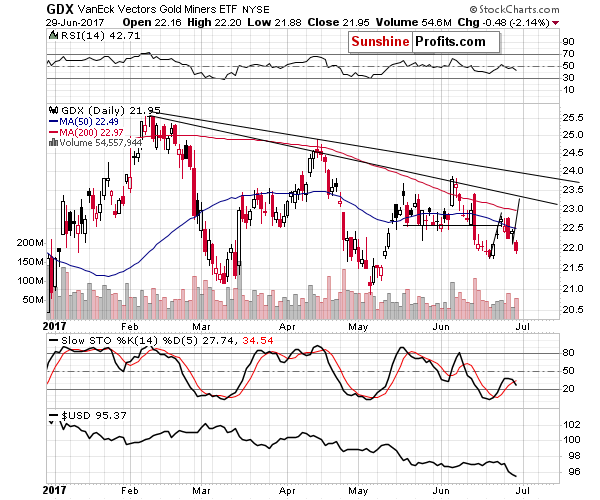
Mining stocks provide us with bearish signals. They are underperforming gold (shortly after they were outperforming it) and they are moving lower on significant volume. However, looking at the miners’ performance relative to gold from a broader perspective provides us with other implications.
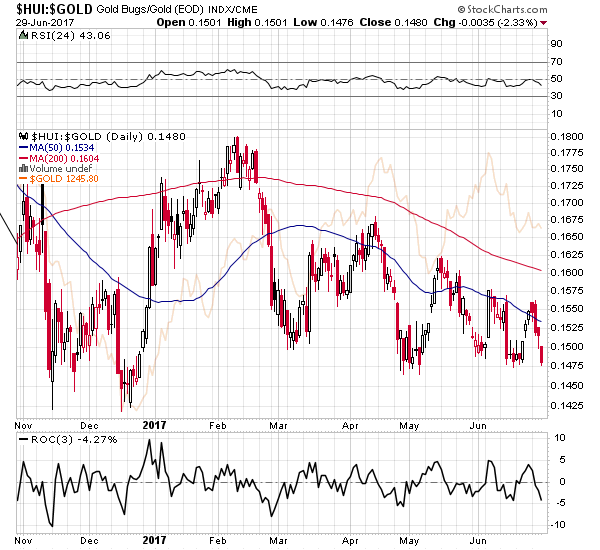
Gold stocks to gold ratio simply moved to the levels that triggered a reversal many times in the previous months (2 times on the exact basis and 2 times on an approximate basis). Consequently, until we see a confirmed breakdown, we are likely to see another rebound in the ratio, and thus higher prices of gold stocks relative to gold.
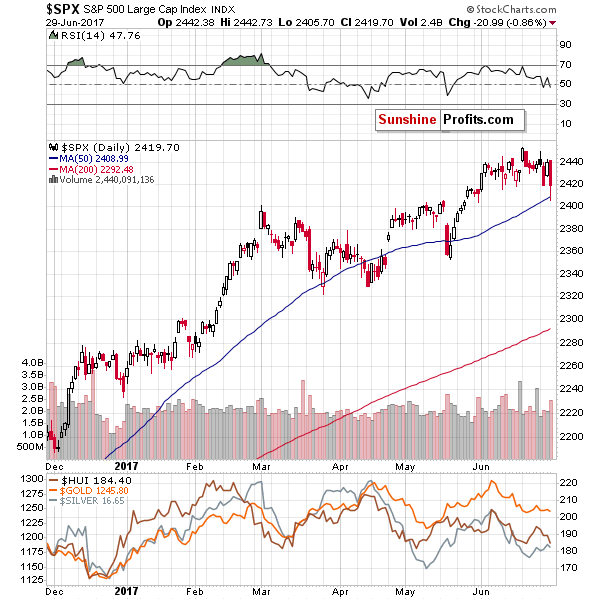
In particular, the above is likely to be the case assuming that the general stock market moves higher shortly. It moved visibly lower yesterday, touching its 50-day moving average and moving below this level triggered reversals 3 times in the recent past (100% of th cases) this year – consequently, we could see some short-term strength, even if the main stock indices were to decline in the coming weeks.
Moving back to gold, let’s look at it in terms of the euro.
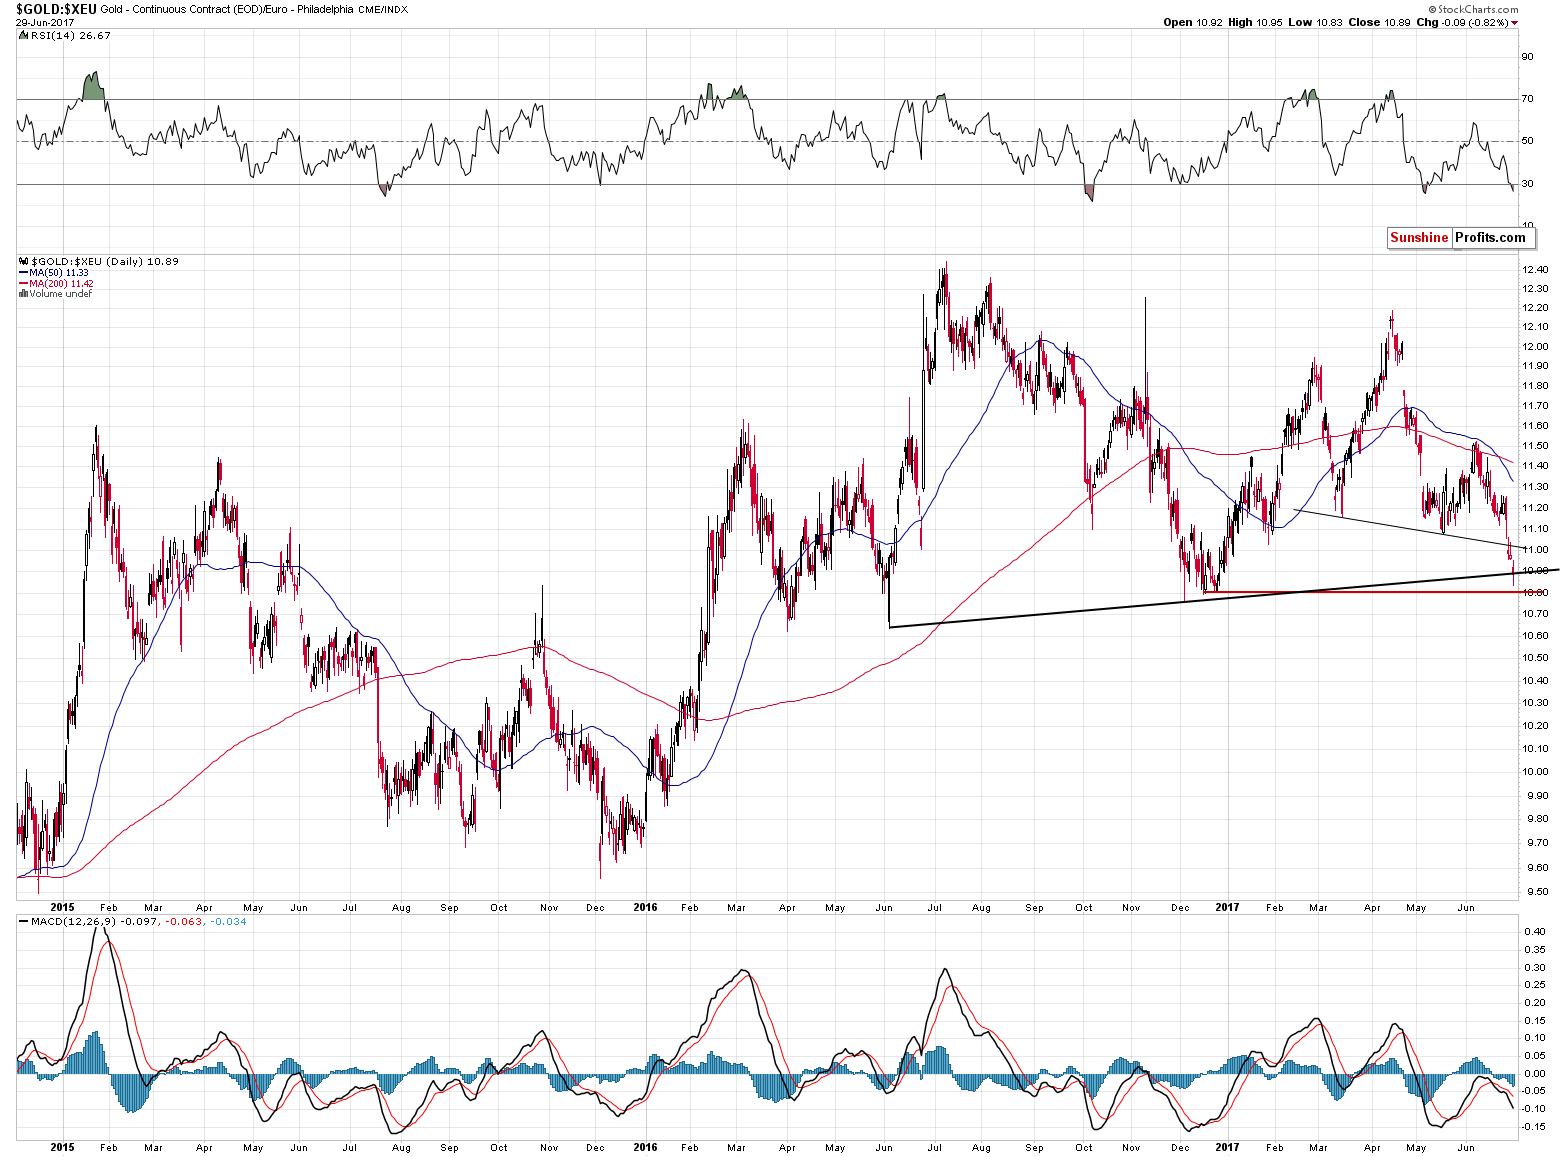
Just as the euro itself is encountering a major resistance despite short-term strength, the gold price in the euro is moving / has moved to important support levels. It confirmed the breakdown below the short-term head-and-shoulders pattern, and that’s a bearish signal, however, with the late 2016 bottom being at hand and the proximity of the rising black support line, it seems that the final weekly closing prices should be taken into account before taking any action. The week ends today, so we should have more information available shortly.
Finally, let’s keep in mind that it is very often the case that gold’s price movement is connected more to the performance of the Japanese yen than it is with the euro movement. Here’s what we write about the yen in today’s Forex Trading Alert:
(…) there are some bearish factors on the very short-term chart, which could trigger a bigger pullback. Let’s take a closer look at them.
At the beginning, let’s focus on the quote from our Wednesday’s alert:
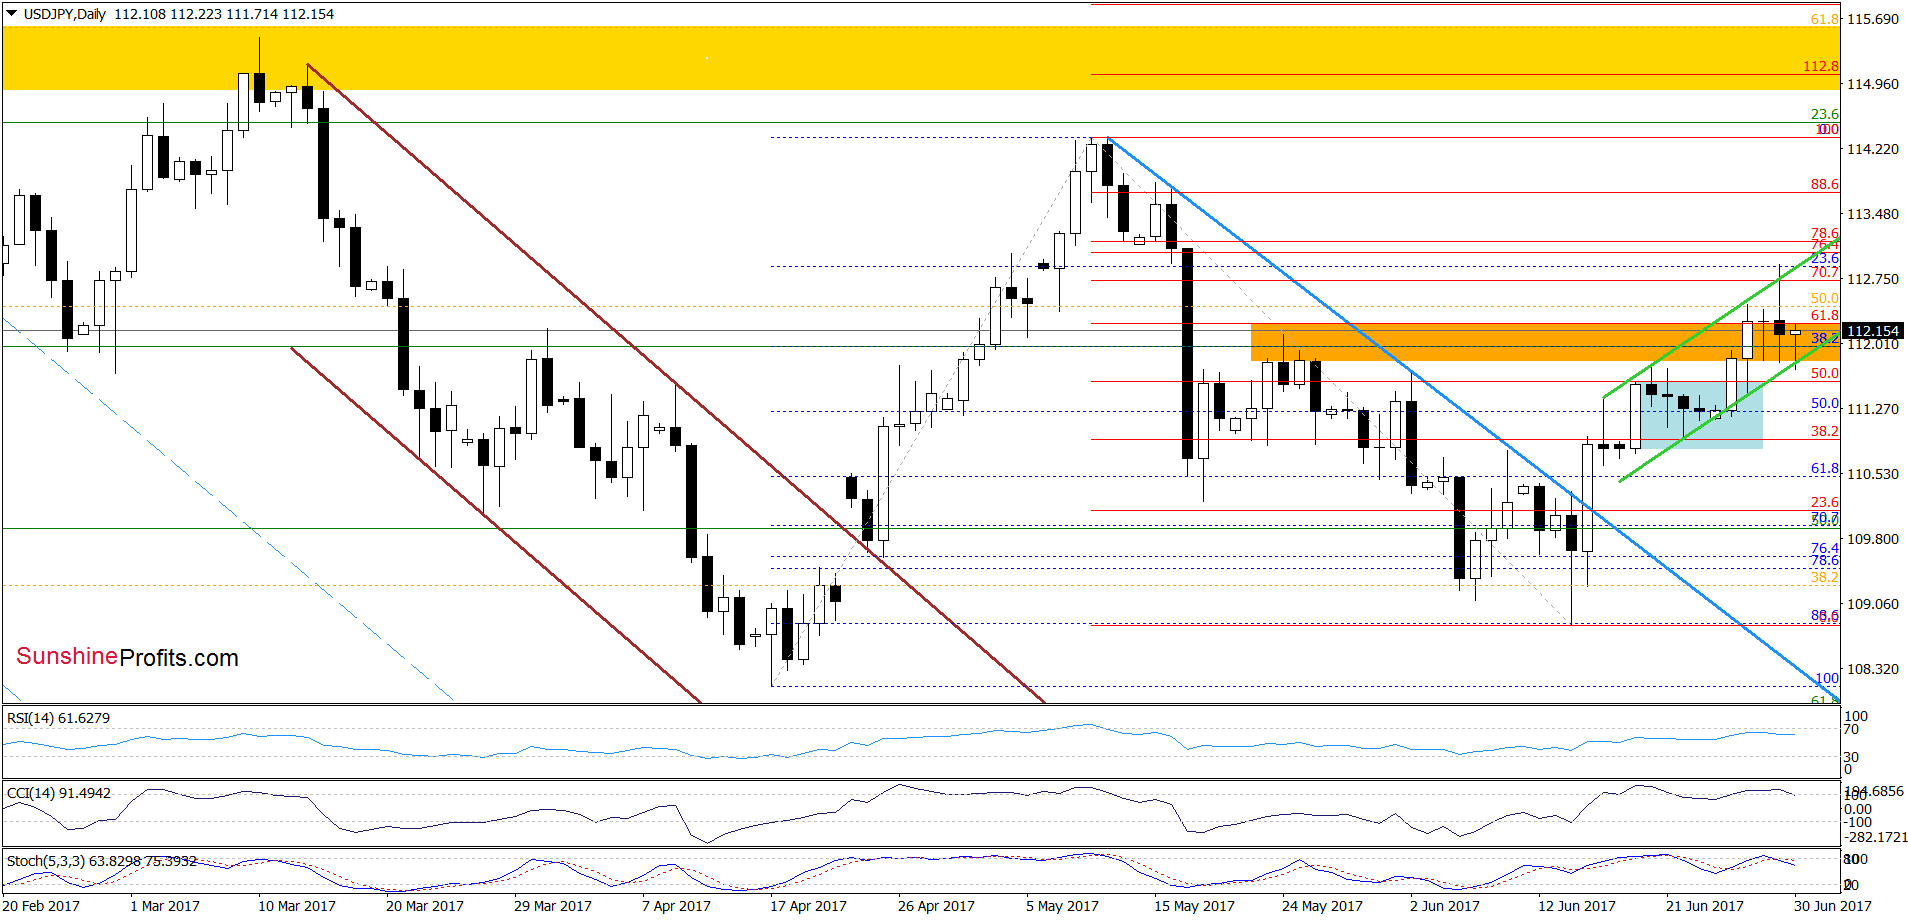
(…) USD/JPY broke above the upper border of the blue consolidation and increased above the 61.8% Fibonacci retracement and the orange resistance zone yesterday. Thanks to this move, the pair approached the upper line of the green rising trend channel, which triggered a pullback earlier today. Nevertheless, the Stochastic Oscillator re-generated the buy signal, which together with the medium-term picture suggests that we’ll likely see a test of the upper border of the green channel in the coming day(s).
From today’s point of view, we see that the situation developed in line with our assumptions and USD/JPY extended gains. Despite this improvement, currency bulls didn’t manage to hold gained levels, which resulted in a pullback and a closure inside the green rising trend channel. In this way, the exchange rate invalidated the tiny breakout above the upper border of the formation, which together with the sell signals generated by the indicators suggests further deterioration in the coming days.
If this is the case, currency bears will try to push the pair under the lower green line. If they succeed, we’ll see a drop to (at least) 110.06, where the upper border of the long-term brown declining trend channel (marked on the weekly chart) currently is. Taking all these facts into account, we think that closing long positions (as a reminder, we opened them when USD/JPY was trading around 109) and taking profits off the table is the best decision at the moment.
With a good possibility of the Japanese yen showing strength against the USD in the near future, the odds are that gold would rally as well.
Summing up, there are many factors that are currently in play and overall it seems that the bullish ones outweigh the bearish ones for the short term. The outlook remains very bearish for the following months, but it still seems that we are likely to see some strength in the following days, and possibly weeks.
There is a long weekend ahead of us (the markets are closed on Tuesday as it’s U.S. Independence Day), but due to the current tense situation in the precious metals market (and the lack of clarity regarding its link to the USD and Euro Indices), we will provide you with a regular alert on Monday, despite our travel plans.
As always, we will keep you – our subscribers – informed.
To summarize:
Trading capital (supplementary part of the portfolio; our opinion): Long positions (100% of the full position) in gold, silver and mining stocks are justified from the risk/reward perspective with the following stop-loss orders and initial target price levels / profit-take orders:
- Gold: initial target price: $1,289; stop-loss: $1,227; initial target price for the UGLD ETN: $11.15; stop-loss for the UGLD ETN $9.64
- Silver: initial target price: $17.29; stop-loss: $15.94; initial target price for the USLV ETN: $13.33; stop-loss for the USLV ETN $10.45
- Mining stocks (price levels for the GDX ETF): initial target price: $23.27; stop-loss: $21.43; initial target price for the NUGT ETF: $36.54; stop-loss for the NUGT ETF $27.81
In case one wants to bet on junior mining stocks' prices (we do not suggest doing so – we think senior mining stocks are more predictable in the case of short-term trades – if one wants to do it anyway, we provide the details), here are the stop-loss details and initial target prices:
- GDXJ ETF: initial target price: $35.57; stop-loss: $31.68
- JNUG ETF: initial target price: $22.48; stop-loss: $15.79
Long-term capital (core part of the portfolio; our opinion): No positions (in other words: cash)
Insurance capital (core part of the portfolio; our opinion): Full position
Please note that the in the trading section we describe the situation for the day that the alert is posted. In other words, it we are writing about a speculative position, it means that it is up-to-date on the day it was posted. We are also featuring the initial target prices, so that you can decide whether keeping a position on a given day is something that is in tune with your approach (some moves are too small for medium-term traders and some might appear too big for day-traders).
Plus, you might want to read why our stop-loss orders are usually relatively far from the current price.
Please note that a full position doesn’t mean using all of the capital for a given trade. You will find details on our thoughts on gold portfolio structuring in the Key Insights section on our website.
As a reminder – “initial target price” means exactly that – an “initial” one, it’s not a price level at which we suggest closing positions. If this becomes the case (like it did in the previous trade) we will refer to these levels as levels of exit orders (exactly as we’ve done previously). Stop-loss levels, however, are naturally not “initial”, but something that, in our opinion, might be entered as an order.
Since it is impossible to synchronize target prices and stop-loss levels for all the ETFs and ETNs with the main markets that we provide these levels for (gold, silver and mining stocks – the GDX ETF), the stop-loss levels and target prices for other ETNs and ETF (among other: UGLD, DGLD, USLV, DSLV, NUGT, DUST, JNUG, JDST) are provided as supplementary, and not as “final”. This means that if a stop-loss or a target level is reached for any of the “additional instruments” (DGLD for instance), but not for the “main instrument” (gold in this case), we will view positions in both gold and DGLD as still open and the stop-loss for DGLD would have to be moved lower. On the other hand, if gold moves to a stop-loss level but DGLD doesn’t, then we will view both positions (in gold and DGLD) as closed. In other words, since it’s not possible to be 100% certain that each related instrument moves to a given level when the underlying instrument does, we can’t provide levels that would be binding. The levels that we do provide are our best estimate of the levels that will correspond to the levels in the underlying assets, but it will be the underlying assets that one will need to focus on regarding the signs pointing to closing a given position or keeping it open. We might adjust the levels in the “additional instruments” without adjusting the levels in the “main instruments”, which will simply mean that we have improved our estimation of these levels, not that we changed our outlook on the markets. We are already working on a tool that would update these levels on a daily basis for the most popular ETFs, ETNs and individual mining stocks.
Our preferred ways to invest in and to trade gold along with the reasoning can be found in the how to buy gold section. Additionally, our preferred ETFs and ETNs can be found in our Gold & Silver ETF Ranking.
As always, we'll keep you - our subscribers - updated should our views on the market change. We will continue to send out Gold & Silver Trading Alerts on each trading day and we will send additional Alerts whenever appropriate.
The trading position presented above is the netted version of positions based on subjective signals (opinion) from your Editor, and the Tools and Indicators.
As a reminder, Gold & Silver Trading Alerts are posted before or on each trading day (we usually post them before the opening bell, but we don't promise doing that each day). If there's anything urgent, we will send you an additional small alert before posting the main one.
=====
Latest Free Trading Alerts:
This week, the U.S. Senate delayed the vote on the healthcare bill. What does it mean for the gold market?
We often hear about ‘peak gold’, i.e. the maximum level of the global production of the yellow metal. Should investors pay attention to data on annual mining production? We invite you to read our today’s article about the notion of the peak in gold production and find out whether gold production has already peaked.
=====
Hand-picked precious-metals-related links:
PRECIOUS-Gold steady on easing dollar, stocks amid hawkish central banks
Gold may trade around $1,250 an ounce in six, 12 months from now
BRIEF-CME raises margins for NYMEX palladium futures by 20 pct
Researchers Find a New Way to Develop Practical Hydrogen Fuel Cells
=====
In other news:
MISES INST.: MYTHS BEHIND THE WAR ON CASH
Euro zone core inflation ticks up in relief for ECB
Europeans Paying Least This Year to Buy Gold on Currency Gains
China Hidden Debt Risks Flare as Trading Halt Fuels Worries
=====
Thank you.
Sincerely,
Przemyslaw Radomski, CFA
Founder, Editor-in-chief, Gold & Silver Fund Manager
Gold & Silver Trading Alerts
Forex Trading Alerts
Oil Investment Updates
Oil Trading Alerts


