Briefly: In our opinion, full (150% of the regular full position) speculative short positions in gold, silver and mining stocks are justified from the risk/reward perspective at the moment of publishing this alert.
Ever since gold moved above $1,300 almost every gold investor out there has been cheering, viewing this development as a very important breakout confirming the existence of the bull market. Ever since, it’s been impossible to publish any analysis with a bearish medium-term outlook without being heavily criticized – yet, we have remained skeptical, as the key signals have not been bullish but bearish and their number has continued to increase.
The extreme optimism and the record-breaking, 2011-top-like volume were likely the key ones, but the confirmations that we saw in the meantime, make it quite obvious that the big move that one should expect is down. Still, most investors continue to focus on the short term and no matter how important signals they see, if they also see gold moving higher on a day-to-day basis, it will indicate to them that the outlook is bullish. On a side note, it is precisely this kind of thinking that creates parabolas at the end of upswings, and subsequent plunges.
Either way, based on what happened yesterday, most of those who focus on the short term only will likely stick to the bullish outlook for some time, but some will abandon their positions after the breakdowns in gold, silver and mining stocks become clearer and more apparent. That’s what’s likely to cause the decline to accelerate.
What kind of short-term indications do we mean? Let’s move to the charts for details (chart courtesy of http://stockcharts.com).


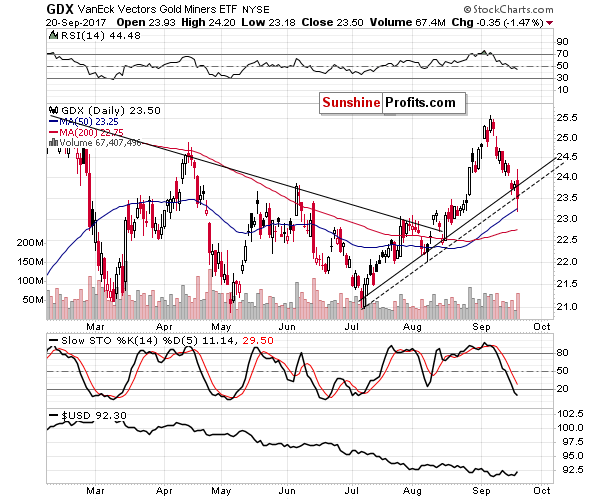
Both gold and mining stocks broke below their rising, short-term support lines yesterday. In the case of the miners, the closing price was at the dashed support line that’s based on the intraday lows and it’s more important that the session closed below the line that was based on other closing prices – the upper, solid line. The comeback to the dashed line seems to be just a post-breakdown correction.
The volume that accompanied the decline in the mining stocks was significant, which further confirms the bearish outlook for the short term.
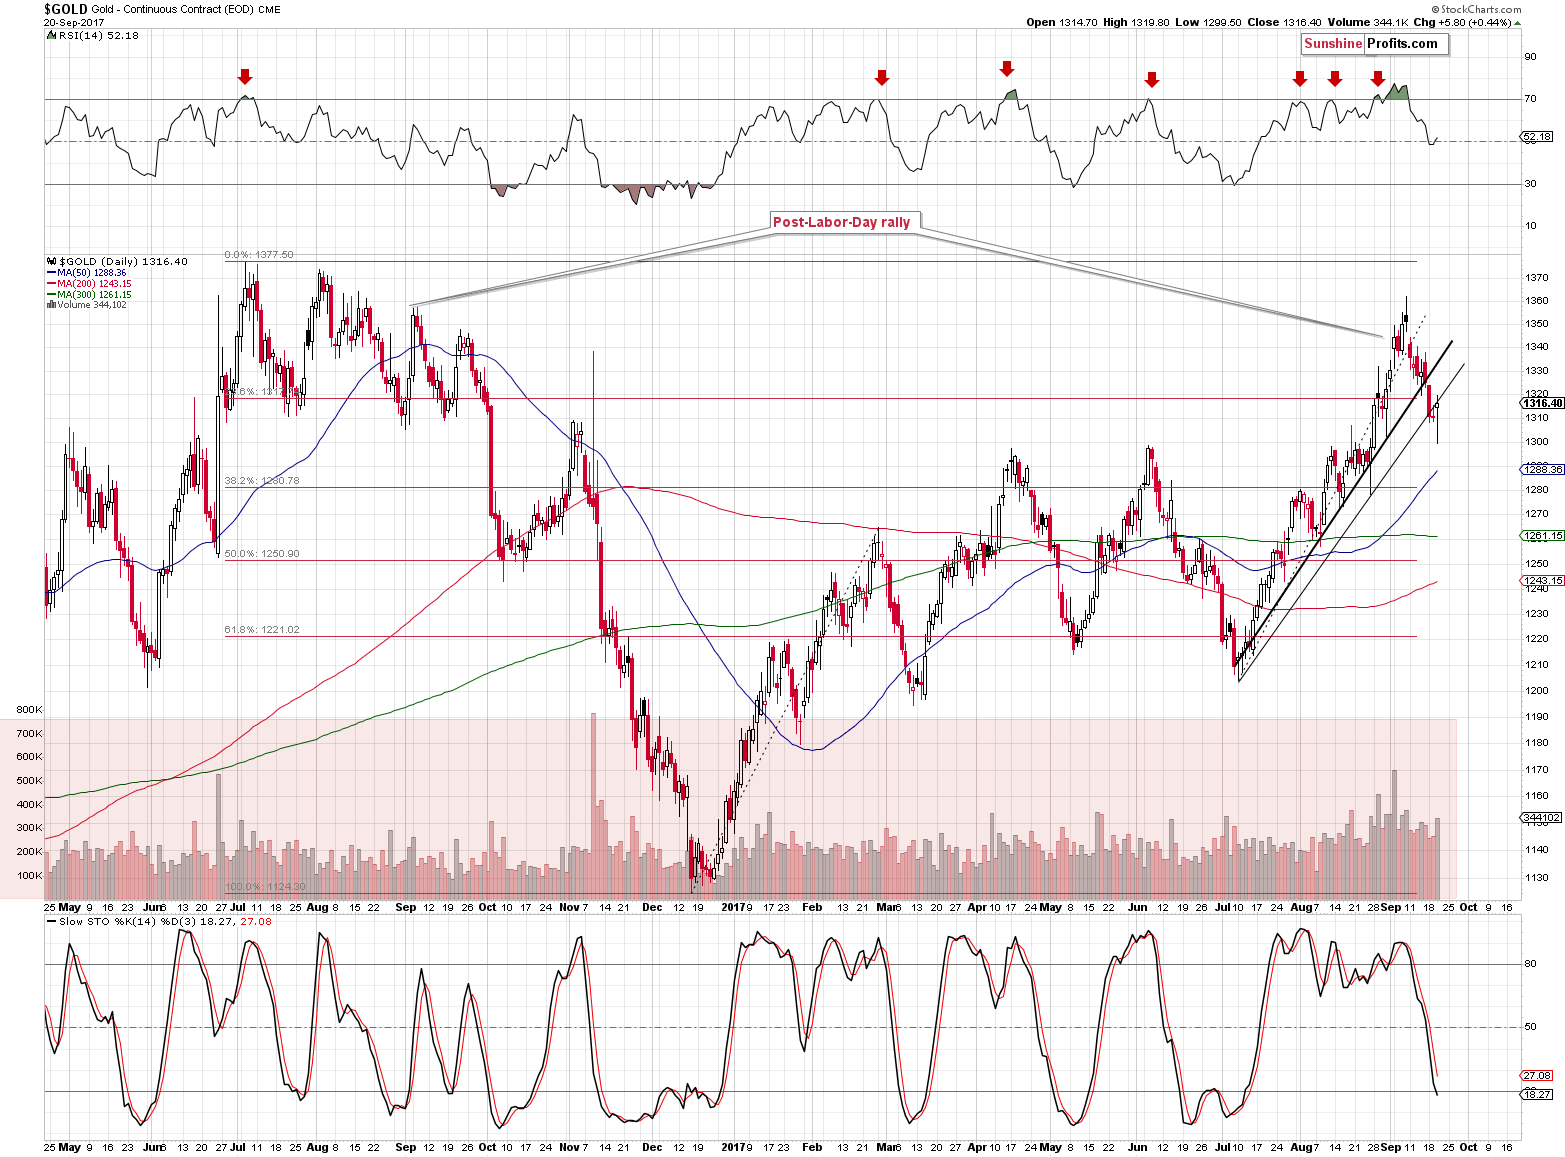
As far as gold is concerned, it seems that the data on the chart is incorrect as gold closed yesterday’s session more or less at $1,300 and since, at the moment of writing these words, it’s trading at about $1,295, it seems that it’s safe to assume that the breakdown below the rising support line is in. In order to fully invalidate the breakdown, gold would need to close above approximately $1,340 and in order to make the situation at least somewhat bullish for the short term, it would need to close above $1,320. It’s already $25 below the latter number, so it seems likely that the breakdown will be confirmed shortly.

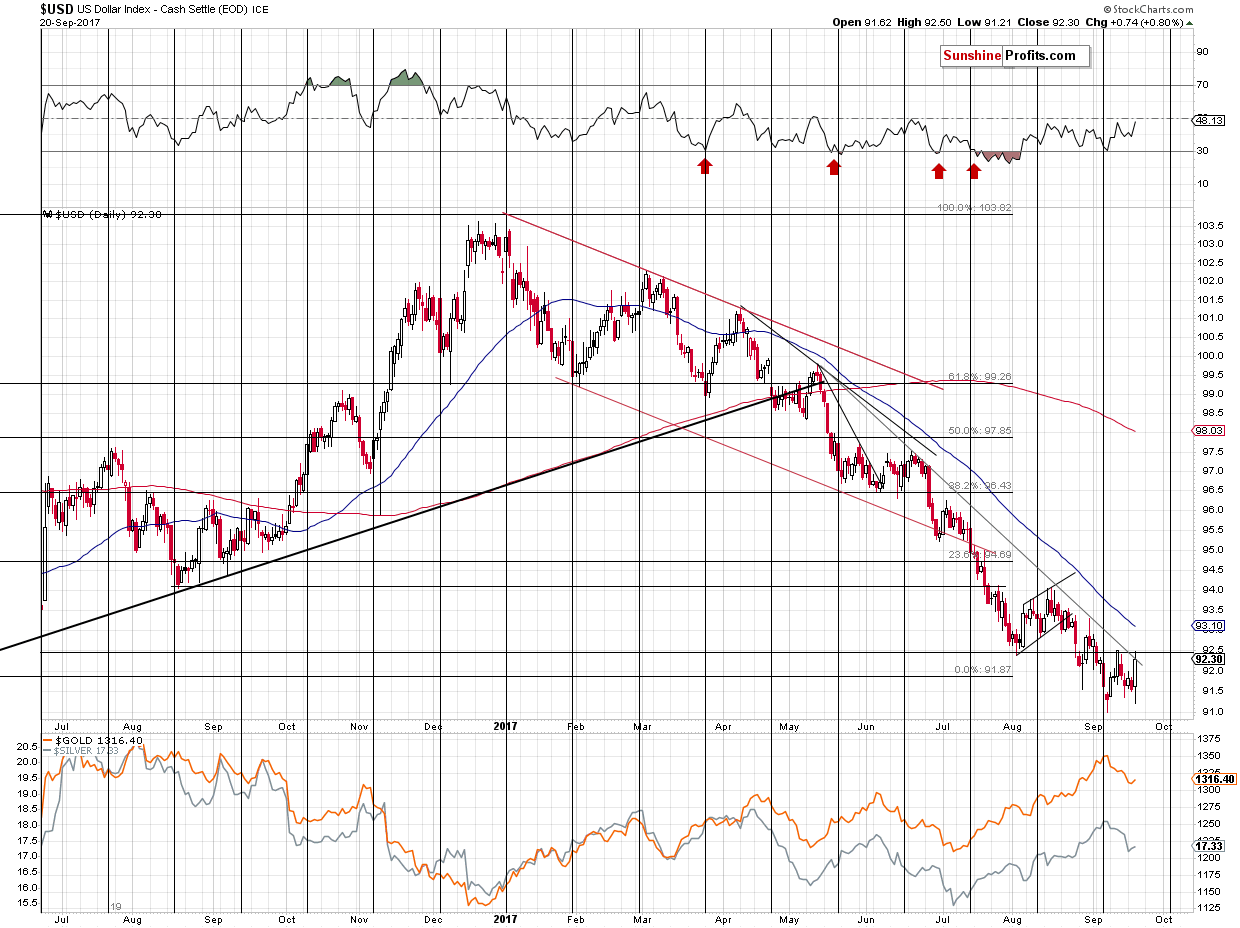
The short-term USD Index chart also became more bullish – the USD moved above 92.50 and even today it’s trading at about 92.40, which is still above the declining resistance line (unfortunately, it’s not clearly visible on the above chart, most likely due to data delay or error).
The breakout is not yet very clear, but once it becomes clear, for instance by closing the week above the resistance line and the previous weekly extremes, the comeback could be quite volatile and the impact on the precious metals market is likely to be huge.

Two days ago, we wrote the following about silver:
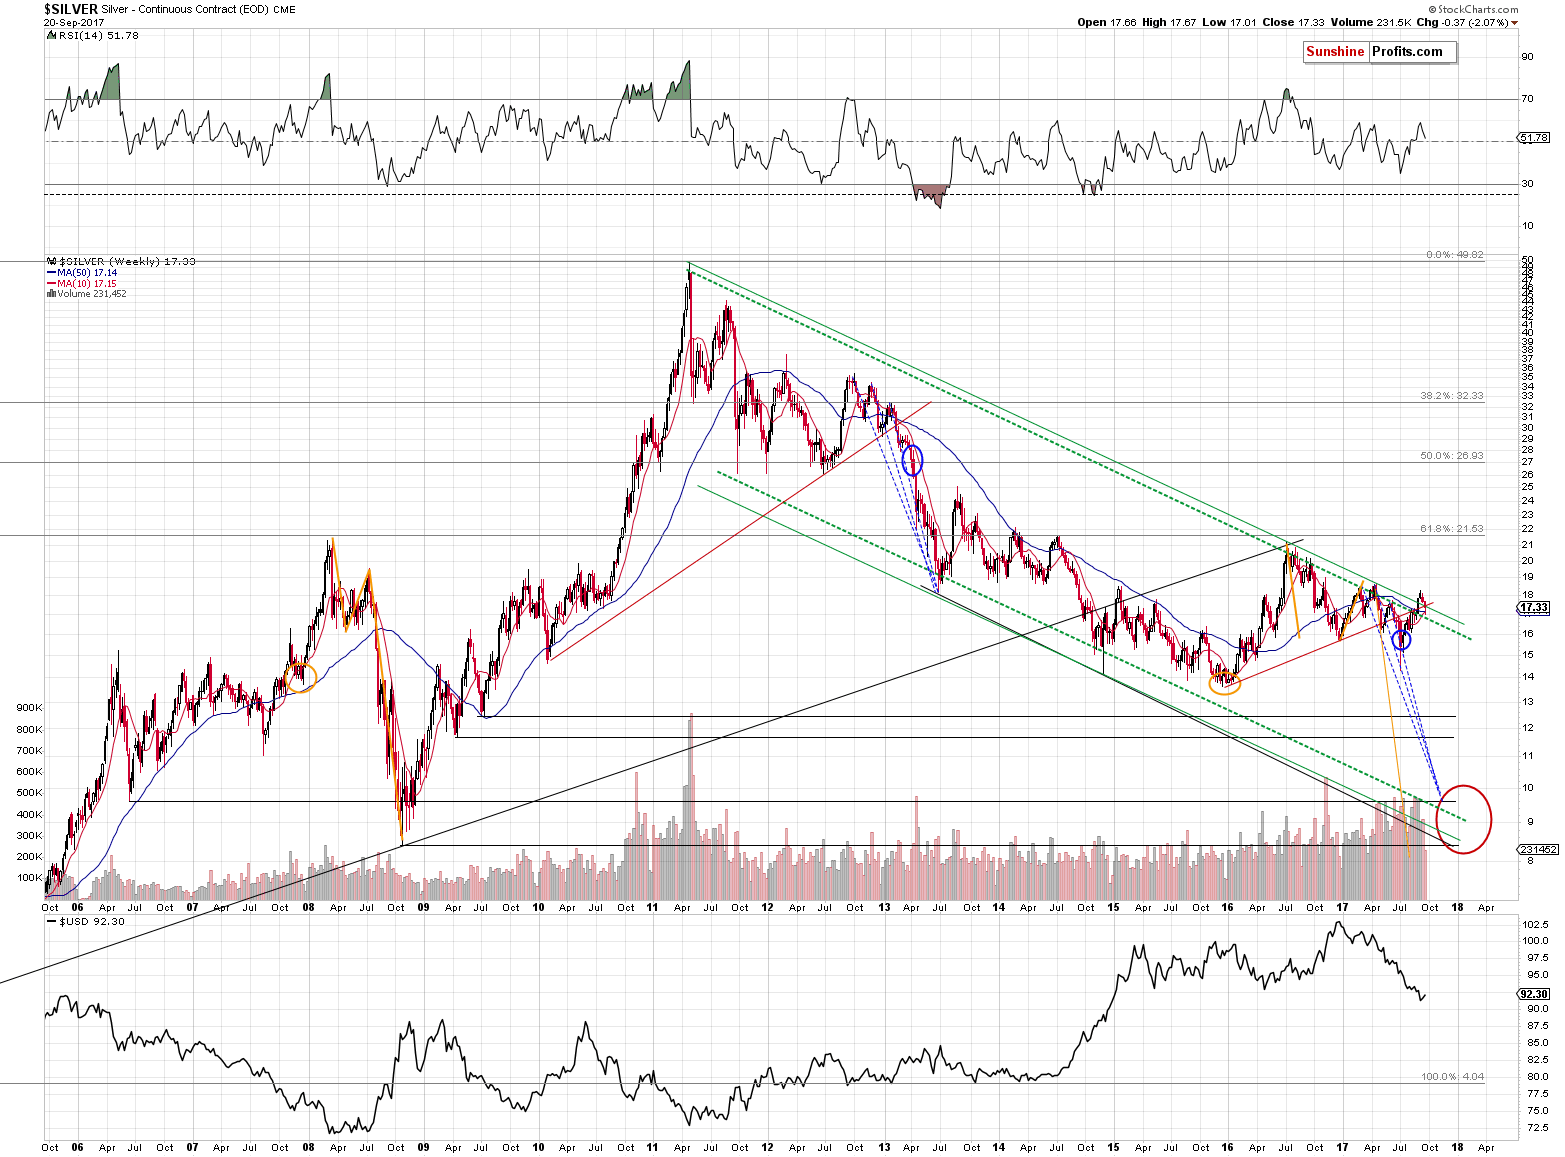
Silver is known for fake breakouts, so we didn’t make much of its recent “strong” performance and a move above the upper green resistance line. We didn’t have to wait long for the market to agree with us – silver closed well below the mentioned line based on the 2011 and 2016 tops. The breakout above the dashed line has not been invalidated so far, but it seems to be only a matter of time (silver was below $17 on an intraday basis yesterday). The dashed line is based on the weekly closing prices and it’s currently at about $16.80. With 4 sessions until the end of the week and only about 30 cents to go, it seems that a move below this line is well within reach.
Still, for now, the implications are already very bearish as most investors focus on the intraday highs instead of the weekly closes and thus the invalidation that has already taken place has already changed the picture for many investors. You knew that silver’s breakout shouldn’t be trusted, but for many investors and traders, what happened now is a new and shocking sign of weakness. Once they capitulate, the decline should accelerate.
Just two days ago we wrote about silver moving to about $16.80, and we just saw this kind of move several hours ago. Today’s intraday low as reported by kitcosilver.com was $16.81. Naturally, a weekly close below it is required for the breakout in weekly terms to be invalidated, but since we have two more sessions until the week is over, it seems very possible and – in light of the recent short-term trend – very likely that we will see this very bearish sign shortly.

In case of gold, the very bearish implications come from the sell signal in the weekly Stochastic indicator even though the above chart assumes that gold closed at $1,316. The supposed head-and-shoulders pattern is now clearly invalidated and it’s the last time that we are featuring its “remains” on the above chart.
It seems that the final gold slide has just begun. The blue dotted line represents the analogy to the 2012-2013 decline. However, if the USD Index does indeed start a major rally (and we expect it do to so), then gold’s decline could be sharper than the decline that we saw in 2012 and 2013, as back then the USD Index didn’t rally substantially. Consequently, the 1:1 analogy between them could work for prices, but not necessarily in terms of time. In other words, the breakdown could be sharper and the bottom could be seen sooner.
Therefore, we updated the target price – it’s based on the above along with the declining red support line (based on the previous lows, and the key 61.8% Fibonacci retracement level. Moreover, the target fits the theory according to which gold should move low enough to scare even the most hardcore gold bulls – a move to $1,000 or even a bit below it might not do it. However, gold at $900 or a bit below, should do the trick.
On a side note, please note that we updated the price target on the long-term silver chart as well.
Summing up, there are more and more long-term signs pointing to a big decline in the precious metals sector – even the palladium market provides us with a strong sell signal. The implications of the August record-breaking volume in gold, the analogies to 2013 and the short-term sell signals (including yesterday’s breakdowns) all confirm the bearish outlook.
As always, we will keep you – our subscribers – informed.
To summarize:
Trading capital (supplementary part of the portfolio; our opinion): Short positions (150% of the full position) in gold, silver and mining stocks are justified from the risk/reward perspective with the following stop-loss orders and initial target price levels / profit-take orders:
- Gold: initial target price level: $1,063; stop-loss: $1,366; initial target price for the DGLD ETN: $81.88; stop-loss for the DGLD ETN $38.74
- Silver: initial target price: $13.12; stop-loss: $19.22; initial target price for the DSLV ETN: $46.18; stop-loss for the DSLV ETN $17.93
- Mining stocks (price levels for the GDX ETF): initial target price: $9.34; stop-loss: $26.34; initial target price for the DUST ETF: $143.56; stop-loss for the DUST ETF $21.37
In case one wants to bet on junior mining stocks' prices (we do not suggest doing so – we think senior mining stocks are more predictable in the case of short-term trades – if one wants to do it anyway, we provide the details), here are the stop-loss details and initial target prices:
- GDXJ ETF: initial target price: $14.13; stop-loss: $45.31
- JDST ETF: initial target price: $417.04; stop-loss: $43.12
Long-term capital (core part of the portfolio; our opinion): No positions (in other words: cash)
Insurance capital (core part of the portfolio; our opinion): Full position
Important Details for New Subscribers
Whether you already subscribed or not, we encourage you to find out how to make the most of our alerts and read our replies to the most common alert-and-gold-trading-related-questions.
Please note that the in the trading section we describe the situation for the day that the alert is posted. In other words, it we are writing about a speculative position, it means that it is up-to-date on the day it was posted. We are also featuring the initial target prices, so that you can decide whether keeping a position on a given day is something that is in tune with your approach (some moves are too small for medium-term traders and some might appear too big for day-traders).
Plus, you might want to read why our stop-loss orders are usually relatively far from the current price.
Please note that a full position doesn’t mean using all of the capital for a given trade. You will find details on our thoughts on gold portfolio structuring in the Key Insights section on our website.
As a reminder – “initial target price” means exactly that – an “initial” one, it’s not a price level at which we suggest closing positions. If this becomes the case (like it did in the previous trade) we will refer to these levels as levels of exit orders (exactly as we’ve done previously). Stop-loss levels, however, are naturally not “initial”, but something that, in our opinion, might be entered as an order.
Since it is impossible to synchronize target prices and stop-loss levels for all the ETFs and ETNs with the main markets that we provide these levels for (gold, silver and mining stocks – the GDX ETF), the stop-loss levels and target prices for other ETNs and ETF (among other: UGLD, DGLD, USLV, DSLV, NUGT, DUST, JNUG, JDST) are provided as supplementary, and not as “final”. This means that if a stop-loss or a target level is reached for any of the “additional instruments” (DGLD for instance), but not for the “main instrument” (gold in this case), we will view positions in both gold and DGLD as still open and the stop-loss for DGLD would have to be moved lower. On the other hand, if gold moves to a stop-loss level but DGLD doesn’t, then we will view both positions (in gold and DGLD) as closed. In other words, since it’s not possible to be 100% certain that each related instrument moves to a given level when the underlying instrument does, we can’t provide levels that would be binding. The levels that we do provide are our best estimate of the levels that will correspond to the levels in the underlying assets, but it will be the underlying assets that one will need to focus on regarding the signs pointing to closing a given position or keeping it open. We might adjust the levels in the “additional instruments” without adjusting the levels in the “main instruments”, which will simply mean that we have improved our estimation of these levels, not that we changed our outlook on the markets. We are already working on a tool that would update these levels on a daily basis for the most popular ETFs, ETNs and individual mining stocks.
Our preferred ways to invest in and to trade gold along with the reasoning can be found in the how to buy gold section. Additionally, our preferred ETFs and ETNs can be found in our Gold & Silver ETF Ranking.
As a reminder, Gold & Silver Trading Alerts are posted before or on each trading day (we usually post them before the opening bell, but we don't promise doing that each day). If there's anything urgent, we will send you an additional small alert before posting the main one.
=====
Latest Free Trading Alerts:
Yesterday, the Fed released its most recent monetary policy statement. How can it affect the financial markets?
September 2017 FOMC Meeting and Gold
S&P 500 index gained 0.1% on Wednesday following relatively volatile trading session, as investors reacted to the FOMC Statement release. Will uptrend continue? Or is this a topping pattern before downward reversal?
Short-Term Uncertainty, As Stocks Fluctuate Along Record Highs
=====
Hand-picked precious-metals-related links:
PRECIOUS-Gold slips to near 4-week low as Fed flags December rate hike
Gold sinks below $1,300 after Fed ends era of easy money
=====
In other news:
Fed's 'Great Unwinding' lifts dollar, China rating gets the chop
Fed to Shrink Assets Next Month, Boost Rates by Year End
EU eyes solo move to increase tax on online giants, risking U.S. anger
Russian central bank rescues B&N Bank, becomes top investor
S&P cuts China's credit rating, says rising debt is stoking economic, financial risks
The 'Historical Unicorn Event' Investors Should Be Concerned With
=====
Thank you.
Sincerely,
Przemyslaw Radomski, CFA
Founder, Editor-in-chief, Gold & Silver Fund Manager
Gold & Silver Trading Alerts
Forex Trading Alerts
Oil Investment Updates
Oil Trading Alerts


