Briefly: in our opinion, full (300% of the regular position size) speculative short positions in junior mining stocks are justified from the risk/reward point of view at the moment of publishing this Alert.
Are things more similar to 2008 or less similar to 2008, given the recent price moves in gold and mining stocks?
Let’s start with gold.
Back in 2008, gold soared sharply in September, and then it moved sideways for some time, not being able to break above the initial top and hold that breakout.
The stock market declined slowly at that time, and mining stocks – being impacted by both (gold and stocks) moved lower in a measured manner.
Let’s see what’s happening now.
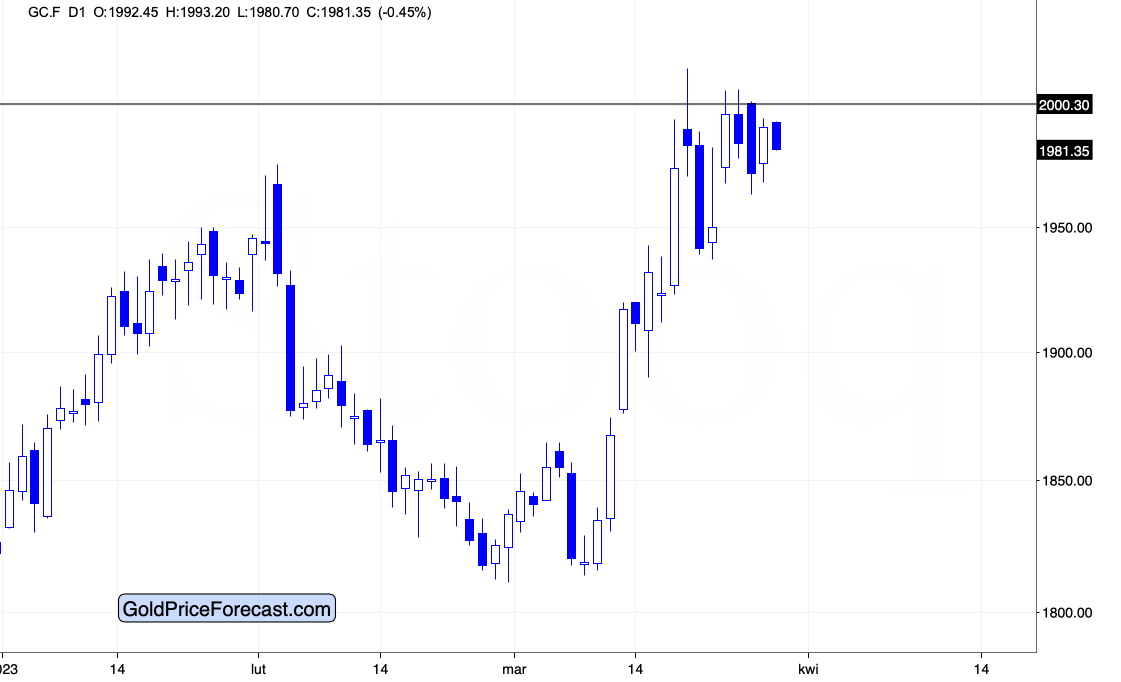
Gold rallied sharply for several days, and now it’s been moving back and forth for several days, unable to break above the initial high and then hold above that high.
This sideways movement makes the current situation more like what we saw in 2008. It’s now not just the sharpness of the rally and similarity in terms of the sudden shift in sentiment (which is a fancy way of saying that people got really scared), but also the post-rally sideways movement that makes both periods alike.
What about the mining stocks? And stocks in general?
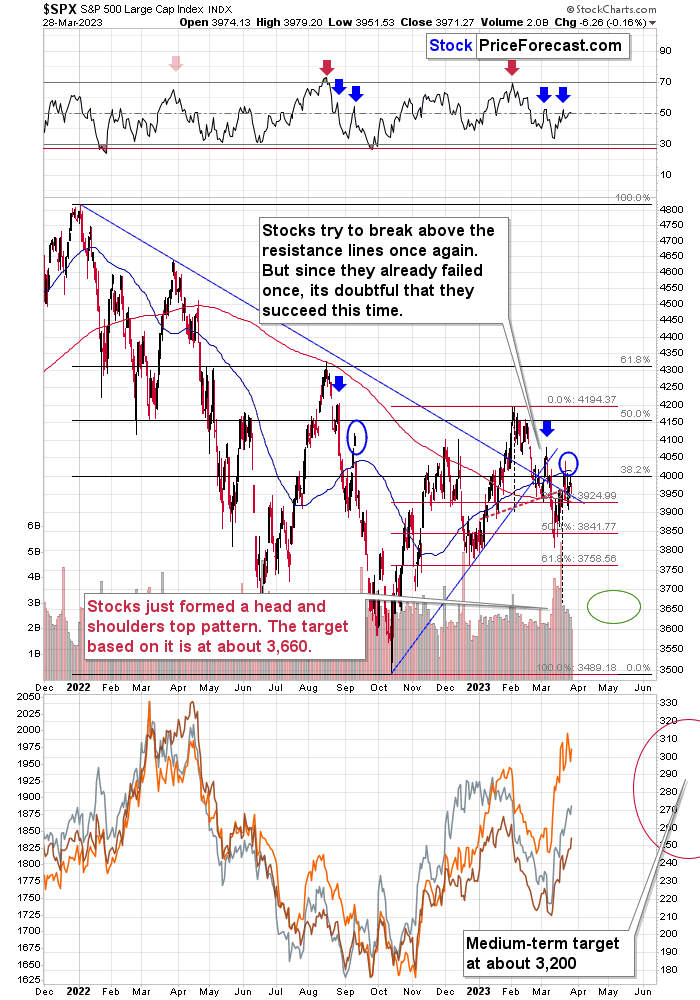
Stocks are likely to slide as well, but this time they have a bit of a different set-up in the short term.
You can see this on the above chart. The most recent very short-term move was to the upside, and while it didn’t change the medium-term trend at all, it likely pushed mining stock prices higher.
So, while miners moved higher for a bit longer than they did in 2008 (so it would seem that both cases are less similar), it’s also true that mines are reacting to the stocks market’s movement just like they did in 2008. So, in a way, if miners had moved lower here while stocks moved higher, it would be a deviation from the similarity.
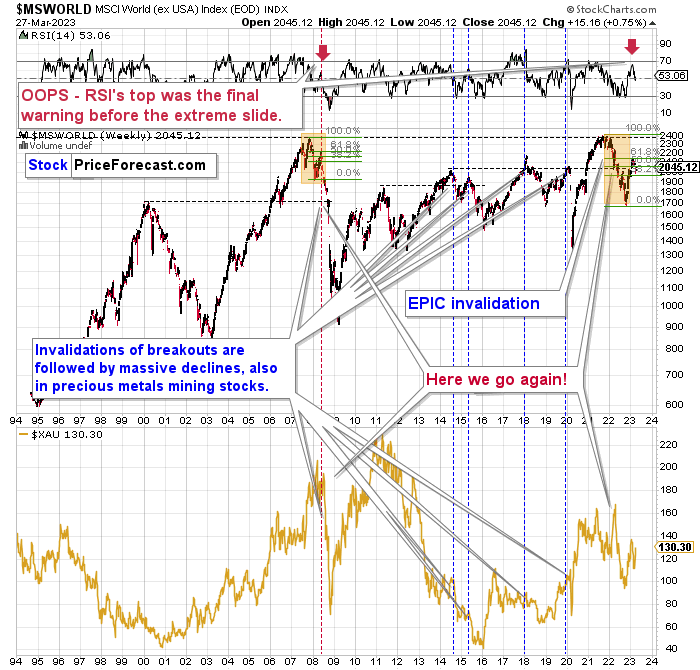
Let’s not forget that stocks showed strength only in the very short term. Their outlook is as bearish as it gets based on what’s happening in world stocks.
I already wrote about it in much greater detail previously, but it’s worth featuring this chart once again. Otherwise, it’s easy to lose track of what’s really important – what is present in the background can be much more important than what’s happening on a day-to-day basis, and this is certainly the case right now.
Based on the above similarity, we are about to see a massive slide in stocks, perhaps even bigger than what we saw in 2008. Of course, this also means huge declines in the S&P 500 and in junior mining stocks. In fact, the latter are likely to be affected to a huge extent.
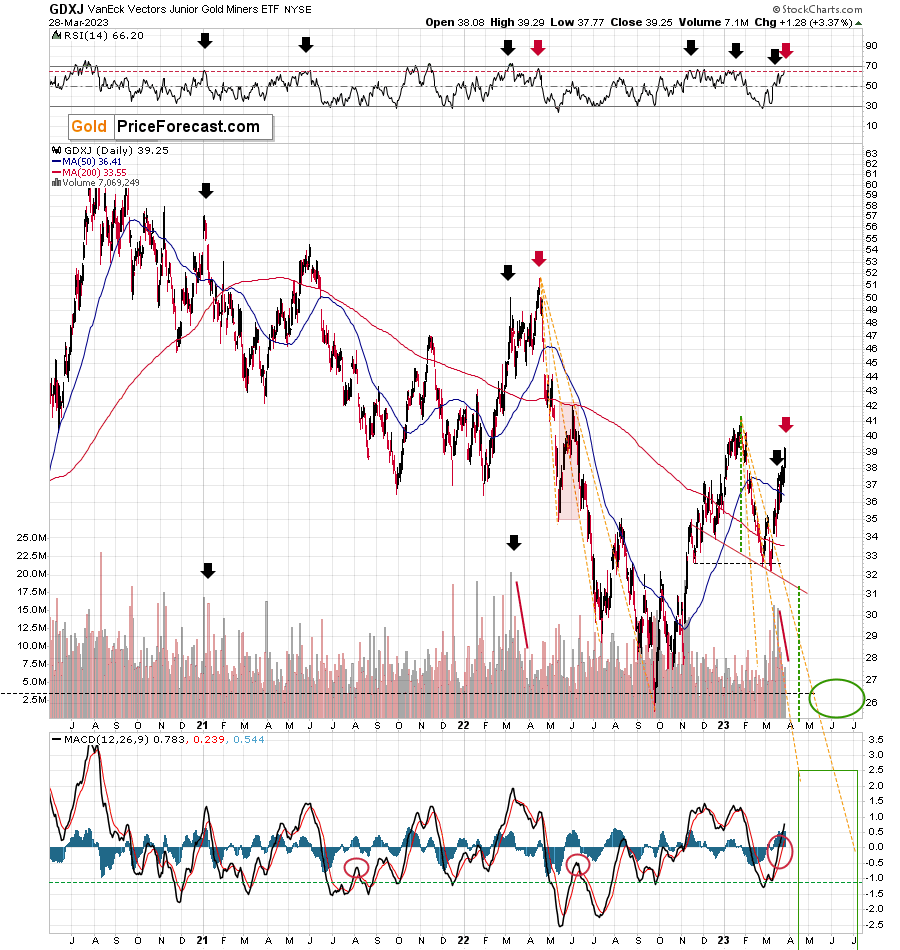
This means that the very short-term rally that we saw recently in the GDXJ is likely to become a WAY bigger decline in the following weeks and months.
In one of the comments that I posted yesterday, I wrote that it’s not the first time that the GDXJ has rallied by $7 only to slide profoundly shortly thereafter. We saw this also in March and April 2022 (it’s the same time of the year. Interesting, isn’t it?).
After investigating the situation in greater detail, it turns out that both situations are even more similar. In both cases, the GDXJ first moved up on huge volume, and then this volume declined visibly as the GDXJ continued to move higher to its final top. I marked both declines in volume levels with declining red lines – they are indeed alike. The difference is that the price moves and volume declines now take less time.
The RSI also shows similarities between now and what happened a year ago. There was more than one move to the current levels in the RSI, and it was the second one that marked the final top.
Interestingly, even putting the analogy aside, the current RSI reading is what stopped previous corrective rallies many times in the past, for example, the early 2021 top.
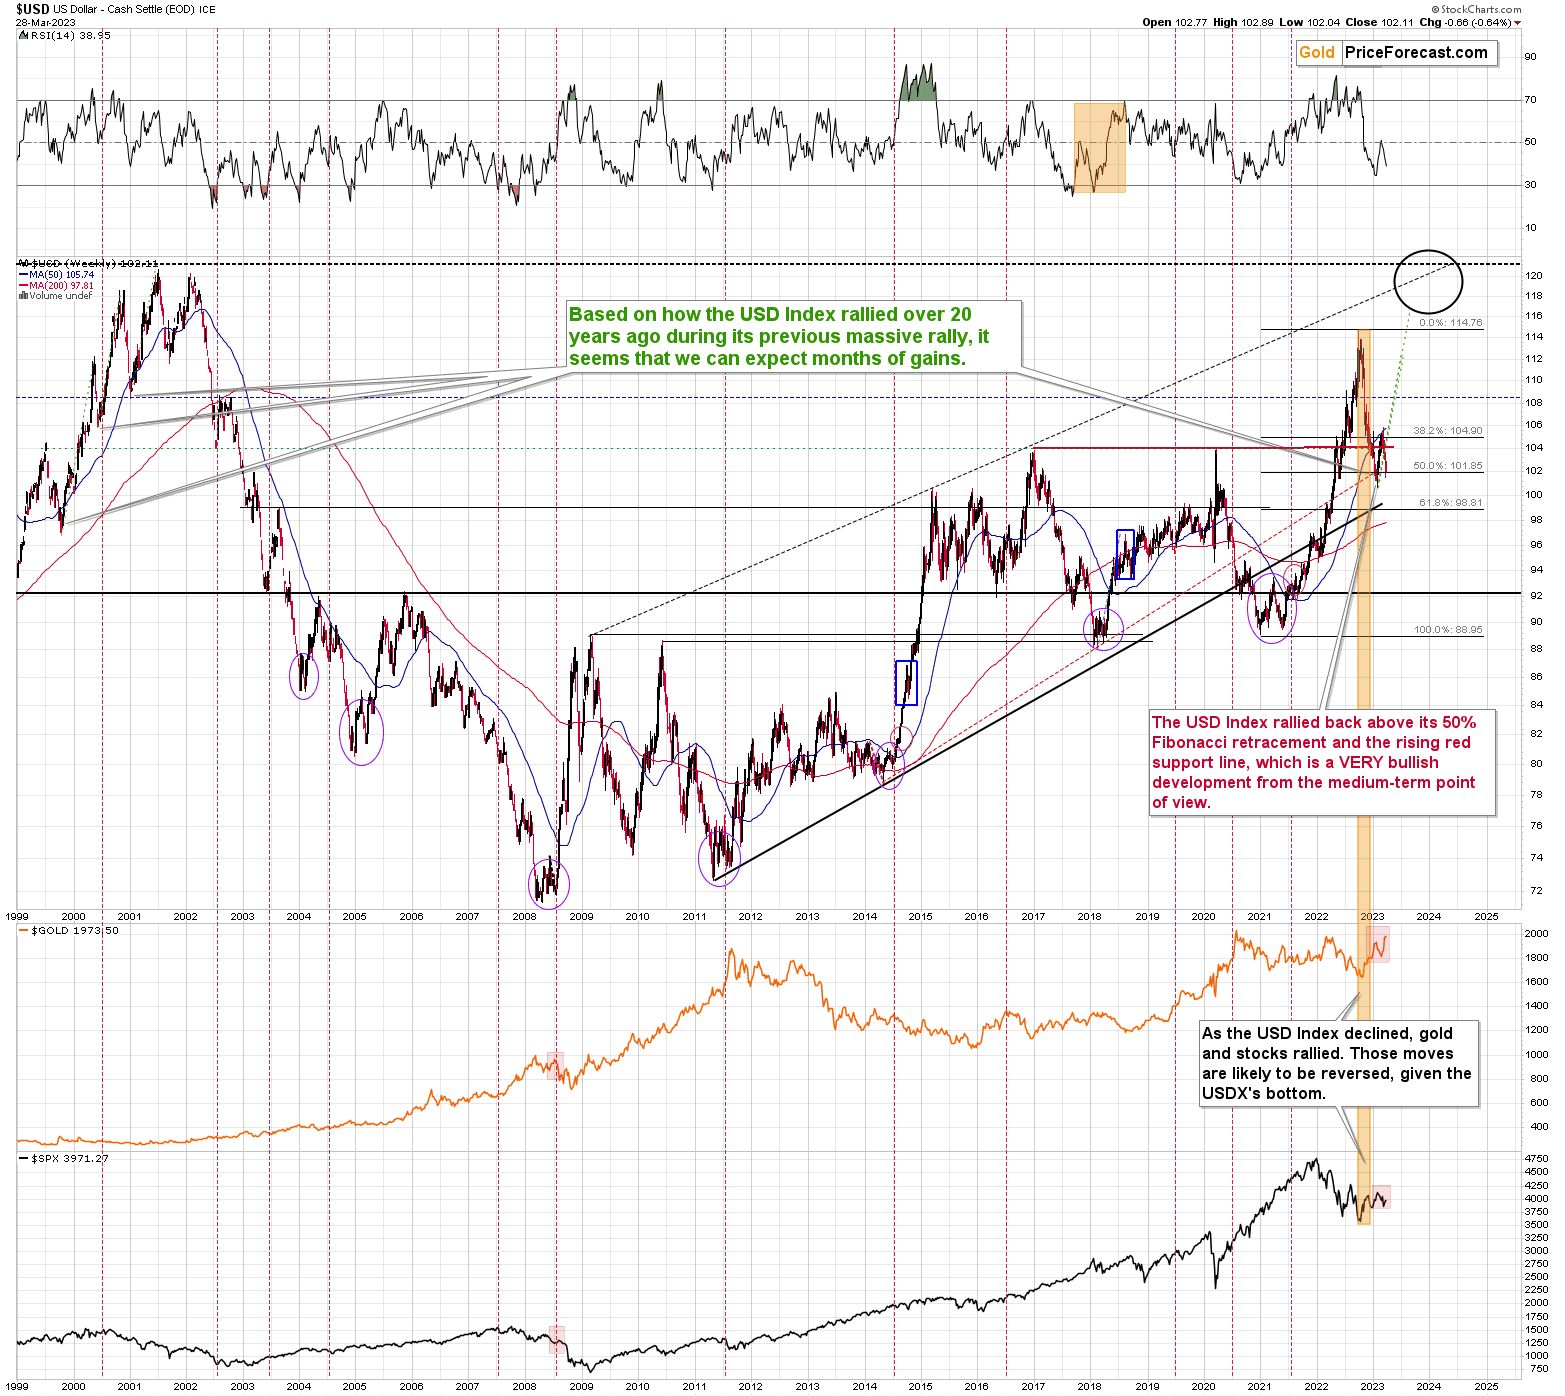
Finally, let’s not forget that the situation in the USD Index also supports the similarity to 2008.
The current short-term move lower in the USDX is in perfect tune with what we saw in mid-2008. What needs to happen for the USD Index to rally now? Pretty much nothing “needs” to happen – the history is likely to rhyme “by itself.” That’s the default course of action. Of course, trends might change, but until we see a given trend/link clearly broken, it makes the most sense to assume that it’s going to continue – because that’s what tends to happen.
Nobody can foresee the future with all its details, and the only thing that one can do is check what happened in similar cases in the past, as people are likely to behave similarly this time as well. Why? Because the underlying emotions (primarily fear and greed) don’t really change.
Finally, I would like to emphasize that the market discounts practically all known information and puts it “into price” along with the interpretation of what people think is likely to happen in the future. This means that unless something is unexpected or unavailable publicly, it’s highly unlikely that the price doesn’t reflect that.
In other words, by focusing on price/volume moves and discovering analogies, we are not doing something separate from analyzing the events that are happening “out there in the real world.” We are actually analyzing hundreds or thousands of those events along with expectations and emotional interpretations at the same time – as they are all already on the charts (at least to the extent that they are known to investors/traders).
Gold futures are down in today’s pre-market trading, so the top may be in, but even if it’s “just” nearby, the key thing remains the huge slide that’s likely just around the corner. This move – and profits from it – are likely (in my opinion) to make up for all the waiting that we had to endure in the meantime. Many, many, many times over.
Just as the night is darkest before the dawn, it “seems most bullish” right before the biggest slides.
Stay strong.
Overview of the Upcoming Part of the Decline
- It seems that we’re seeing another – and probably final – corrective upswing in gold, which is likely to be less visible in the case of silver and mining stocks.
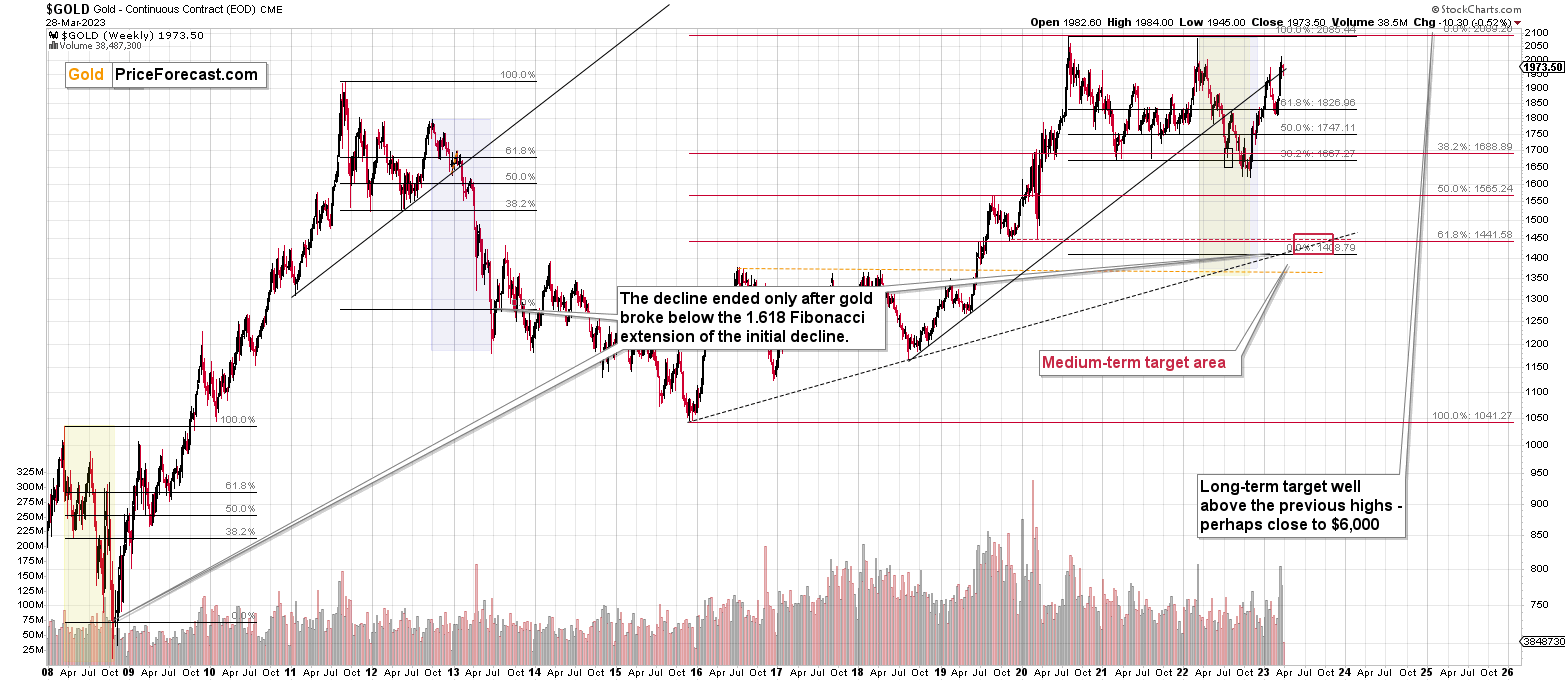
- If we see a situation where miners slide in a meaningful and volatile way while silver doesn’t (it just declines moderately), I plan to – once again – switch from short positions in miners to short positions in silver. At this time, it’s too early to say at what price levels this could take place and if we get this kind of opportunity at all – perhaps with gold prices close to $1,500 - $1,550.
- I plan to switch from the short positions in junior mining stocks or silver (whichever I’ll have at that moment) to long positions in junior mining stocks when gold / mining stocks move to their 2020 lows (approximately). While I’m probably not going to write about it at this stage yet, this is when some investors might consider getting back in with their long-term investing capital (or perhaps 1/3 or 1/2 thereof).
- I plan to return to short positions in junior mining stocks after a rebound – and the rebound could take gold from about $1,450 to about $1,550, and it could take the GDXJ from about $20 to about $24. In other words, I’m currently planning to go long when GDXJ is close to $20 (which might take place when gold is close to $1,450), and I’m planning to exit this long position and re-enter the short position once we see a corrective rally to $24 in the GDXJ (which might take place when gold is close to $1,550).
- I plan to exit all remaining short positions once gold shows substantial strength relative to the USD Index while the latter is still rallying. This may be the case with gold prices close to $1,400 and GDXJ close to $15 . This moment (when gold performs very strongly against the rallying USD and miners are strong relative to gold after its substantial decline) is likely to be the best entry point for long-term investments, in my view. This can also happen with gold close to $1,400, but at the moment it’s too early to say with certainty.
- The above is based on the information available today, and it might change in the following days/weeks.
You will find my general overview of the outlook for gold on the chart below:
Please note that the above timing details are relatively broad and “for general overview only” – so that you know more or less what I think and how volatile I think the moves are likely to be – on an approximate basis. These time targets are not binding nor clear enough for me to think that they should be used for purchasing options, warrants, or similar instruments.
Letters to the Editor
Please post your questions in the comments feed below the articles, if they are about issues raised within the article (or in the recent issues). If they are about other, more universal matters, I encourage you to use the Ask the Community space (I’m also part of the community), so that more people can contribute to the reply and enjoy the answers. Of course, let’s keep the target-related discussions in the premium space (where you’re reading this).
Summary
To summarize, we recently took profits from the additional FCX trade (right before the trend reversed!) and the current short position in junior mining stocks is – in my view – poised to become very profitable in the following weeks, and perhaps days.
Things might appear chaotic in the precious metals market right now, but based on the analogy to the previous crises (2020 and 2008), it’s clear that gold, miners, and other markets are pretty much doing the same thing all over again.
The implications of this “all over” are extremely bearish for junior mining stocks. Back in 2008, at a similar juncture, GDXJ’s price was about to be cut in half in about a week! In my opinion, while the decline might not be as sharp this time, it’s likely to be enormous anyway and very, very, very profitable.
===
As a reminder, we still have a “promotion” that allows you to extend your subscription for up to three (!) years at the current prices… with a 20% discount! And it would apply to all those years, so the savings could be substantial. Given inflation this high, it’s practically certain that we will be raising our prices, and the above would not only protect you from it (at least on our end), but it would also be a perfect way to re-invest some of the profits that you just made.
The savings can be even bigger if you apply it to our All-inclusive Package (Stock- and Oil- Trading Alerts are also included). Actually, in this case, a 25% discount (even up to three years!) applies, so the savings are huge!
If you’d like to extend your subscription (and perhaps also upgrade your plan while doing so), please contact us – our support staff will be happy to help and make sure that your subscription is set up perfectly. If anything about the above is unclear, but you’d like to proceed – please contact us anyway :).
As always, we'll keep you – our subscribers – informed.
To summarize:
Trading capital (supplementary part of the portfolio; our opinion): Full speculative short positions (300% of the full position) in junior mining stocks are justified from the risk to reward point of view with the following binding exit profit-take price levels:
Mining stocks (price levels for the GDXJ ETF): binding profit-take exit price: $26.13; stop-loss: none.
Alternatively, if one seeks leverage, we’re providing the binding profit-take levels for the JDST (2x leveraged). The binding profit-take level for the JDST: $13.87; stop-loss for the JDST: none.
For-your-information targets (our opinion; we continue to think that mining stocks are the preferred way of taking advantage of the upcoming price move, but if for whatever reason one wants / has to use silver or gold for this trade, we are providing the details anyway.):
Silver futures downside profit-take exit price: $17.83 (stop-loss: none)
SLV profit-take exit price: $16.73 (stop-loss: none)
ZSL profit-take exit price: $32.97 (stop-loss: none)
Gold futures downside profit-take exit price: $1,743 (stop-loss: none)
HGD.TO – alternative (Canadian) 2x inverse leveraged gold stocks ETF – the upside profit-take exit price: $10.97 (stop-loss: none due to vague link in the short term with the U.S.-traded GDXJ)
HZD.TO – alternative (Canadian) 2x inverse leveraged silver ETF – the upside profit-take exit price: $25.47 (stop-loss: none)
Long-term capital (core part of the portfolio; our opinion): No positions (in other words: cash)
Insurance capital (core part of the portfolio; our opinion): Full position
Whether you’ve already subscribed or not, we encourage you to find out how to make the most of our alerts and read our replies to the most common alert-and-gold-trading-related-questions.
Please note that we describe the situation for the day that the alert is posted in the trading section. In other words, if we are writing about a speculative position, it means that it is up-to-date on the day it was posted. We are also featuring the initial target prices to decide whether keeping a position on a given day is in tune with your approach (some moves are too small for medium-term traders, and some might appear too big for day-traders).
Additionally, you might want to read why our stop-loss orders are usually relatively far from the current price.
Please note that a full position doesn't mean using all of the capital for a given trade. You will find details on our thoughts on gold portfolio structuring in the Key Insights section on our website.
As a reminder - "initial target price" means exactly that - an "initial" one. It's not a price level at which we suggest closing positions. If this becomes the case (as it did in the previous trade), we will refer to these levels as levels of exit orders (exactly as we've done previously). Stop-loss levels, however, are naturally not "initial", but something that, in our opinion, might be entered as an order.
Since it is impossible to synchronize target prices and stop-loss levels for all the ETFs and ETNs with the main markets that we provide these levels for (gold, silver and mining stocks - the GDX ETF), the stop-loss levels and target prices for other ETNs and ETF (among other: UGL, GLL, AGQ, ZSL, NUGT, DUST, JNUG, JDST) are provided as supplementary, and not as "final". This means that if a stop-loss or a target level is reached for any of the "additional instruments" (GLL for instance), but not for the "main instrument" (gold in this case), we will view positions in both gold and GLL as still open and the stop-loss for GLL would have to be moved lower. On the other hand, if gold moves to a stop-loss level but GLL doesn't, then we will view both positions (in gold and GLL) as closed. In other words, since it's not possible to be 100% certain that each related instrument moves to a given level when the underlying instrument does, we can't provide levels that would be binding. The levels that we do provide are our best estimate of the levels that will correspond to the levels in the underlying assets, but it will be the underlying assets that one will need to focus on regarding the signs pointing to closing a given position or keeping it open. We might adjust the levels in the "additional instruments" without adjusting the levels in the "main instruments", which will simply mean that we have improved our estimation of these levels, not that we changed our outlook on the markets. We are already working on a tool that would update these levels daily for the most popular ETFs, ETNs and individual mining stocks.
Our preferred ways to invest in and to trade gold along with the reasoning can be found in the how to buy gold section. Furthermore, our preferred ETFs and ETNs can be found in our Gold & Silver ETF Ranking.
As a reminder, Gold & Silver Trading Alerts are posted before or on each trading day (we usually post them before the opening bell, but we don't promise doing that each day). If there's anything urgent, we will send you an additional small alert before posting the main one.
Thank you.
Przemyslaw K. Radomski, CFA
Founder, Editor-in-chief


