Briefly: in our opinion, full (250% of the regular size of the position) speculative short position in silver is justified from the risk/reward perspective at the moment of publishing this Alert.
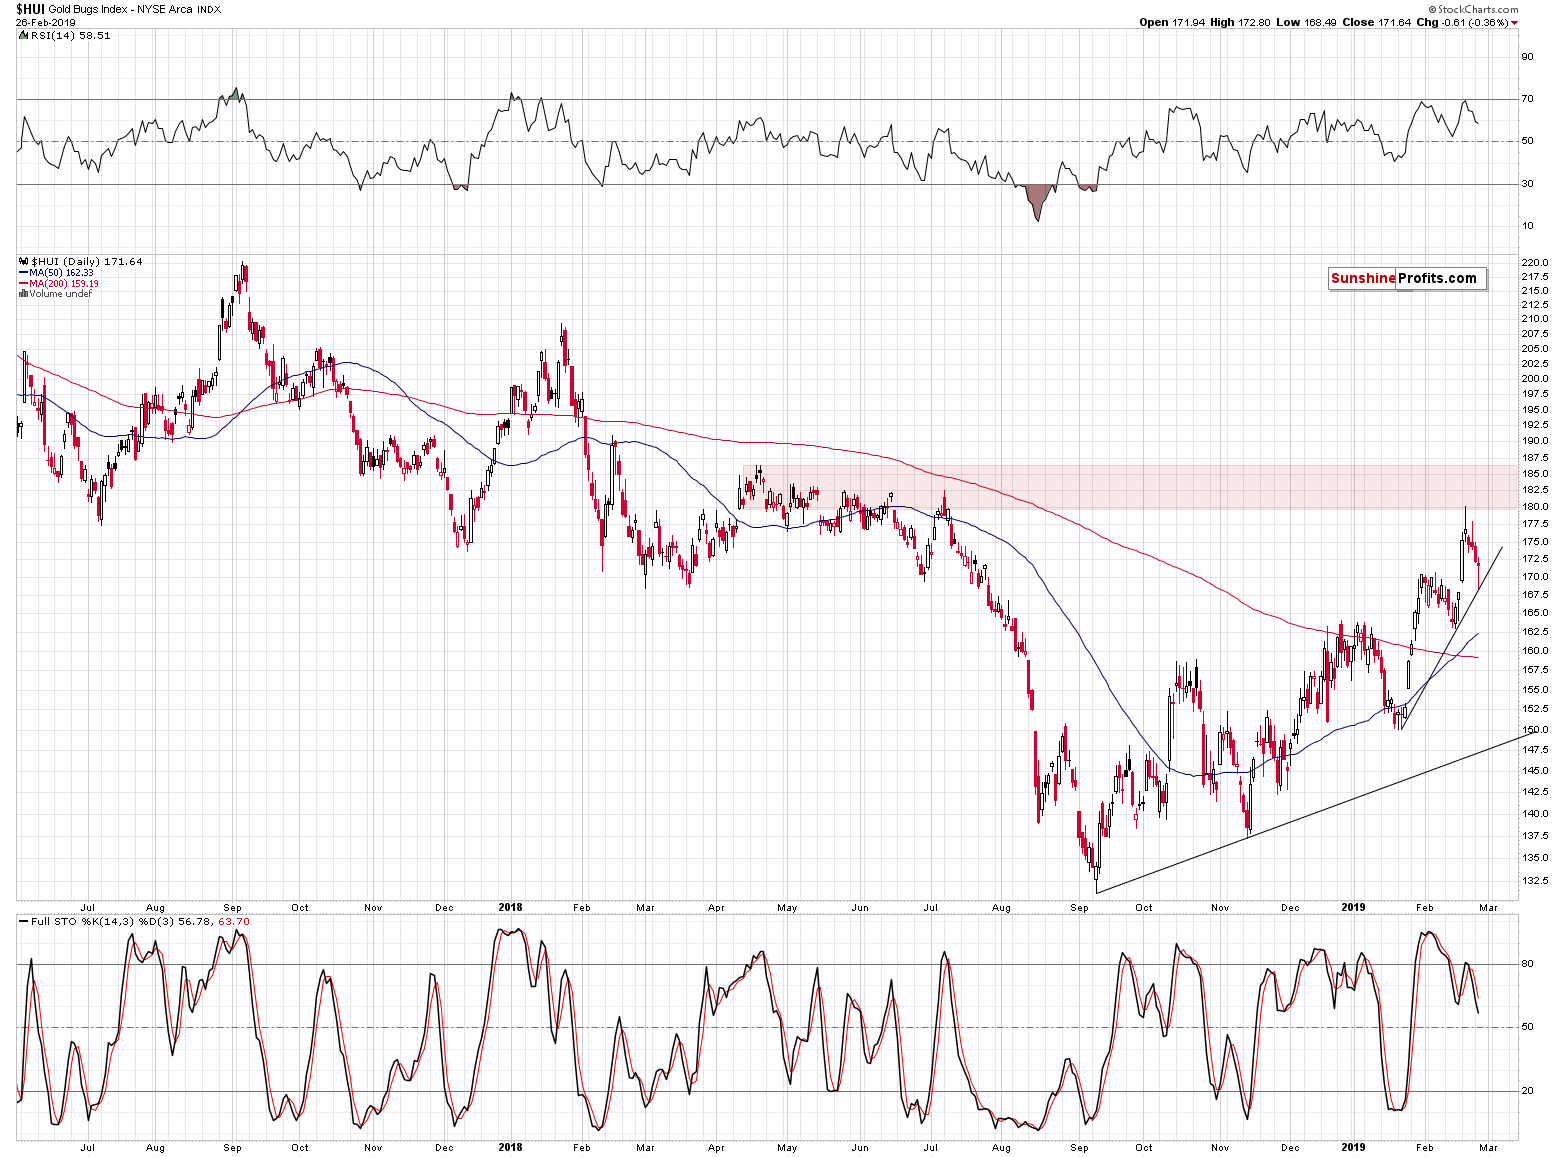
Just like it was the case on Monday, gold and silver haven’t done much yesterday either, but we saw some interesting action in the miners – they formed a bullish reversal after testing the rising support line. The performance of the USD Index provides us with clues as well. It declined and this should have triggered a move higher in the metals and miners. It didn’t. What really happened?
Let’s start with the miners.
Gold Miners’ Short-term Reversal
Just when it started to appear like the mining stocks are going to break below their January high and below the rising support line, they reversed their course. In mid-February, when gold stocks moved to their previous (early January) high and then moved back up, it was the local bottom and a start of the next quick upswing. The natural question is if we are about to see the same thing once again.
As always, there are no sure bets in any market, but it does appear likely based on the above chart alone. We see the sell signal from the daily Stochastic indicator, but we saw it also many times in the previous weeks, including the mid-February case, and miners moved higher nonetheless. Consequently, it doesn’t seem that the daily version of this indicator alone can really be trusted. Naturally, this doesn’t change the very important and bearish medium-term implications of Stochastic’s weekly version that we discussed on Monday.
There’s one very important difference between now and the middle of February that needs to be taken into account and that practically nullifies the bullish implications of the above.
The Hidden Power of the USD Index
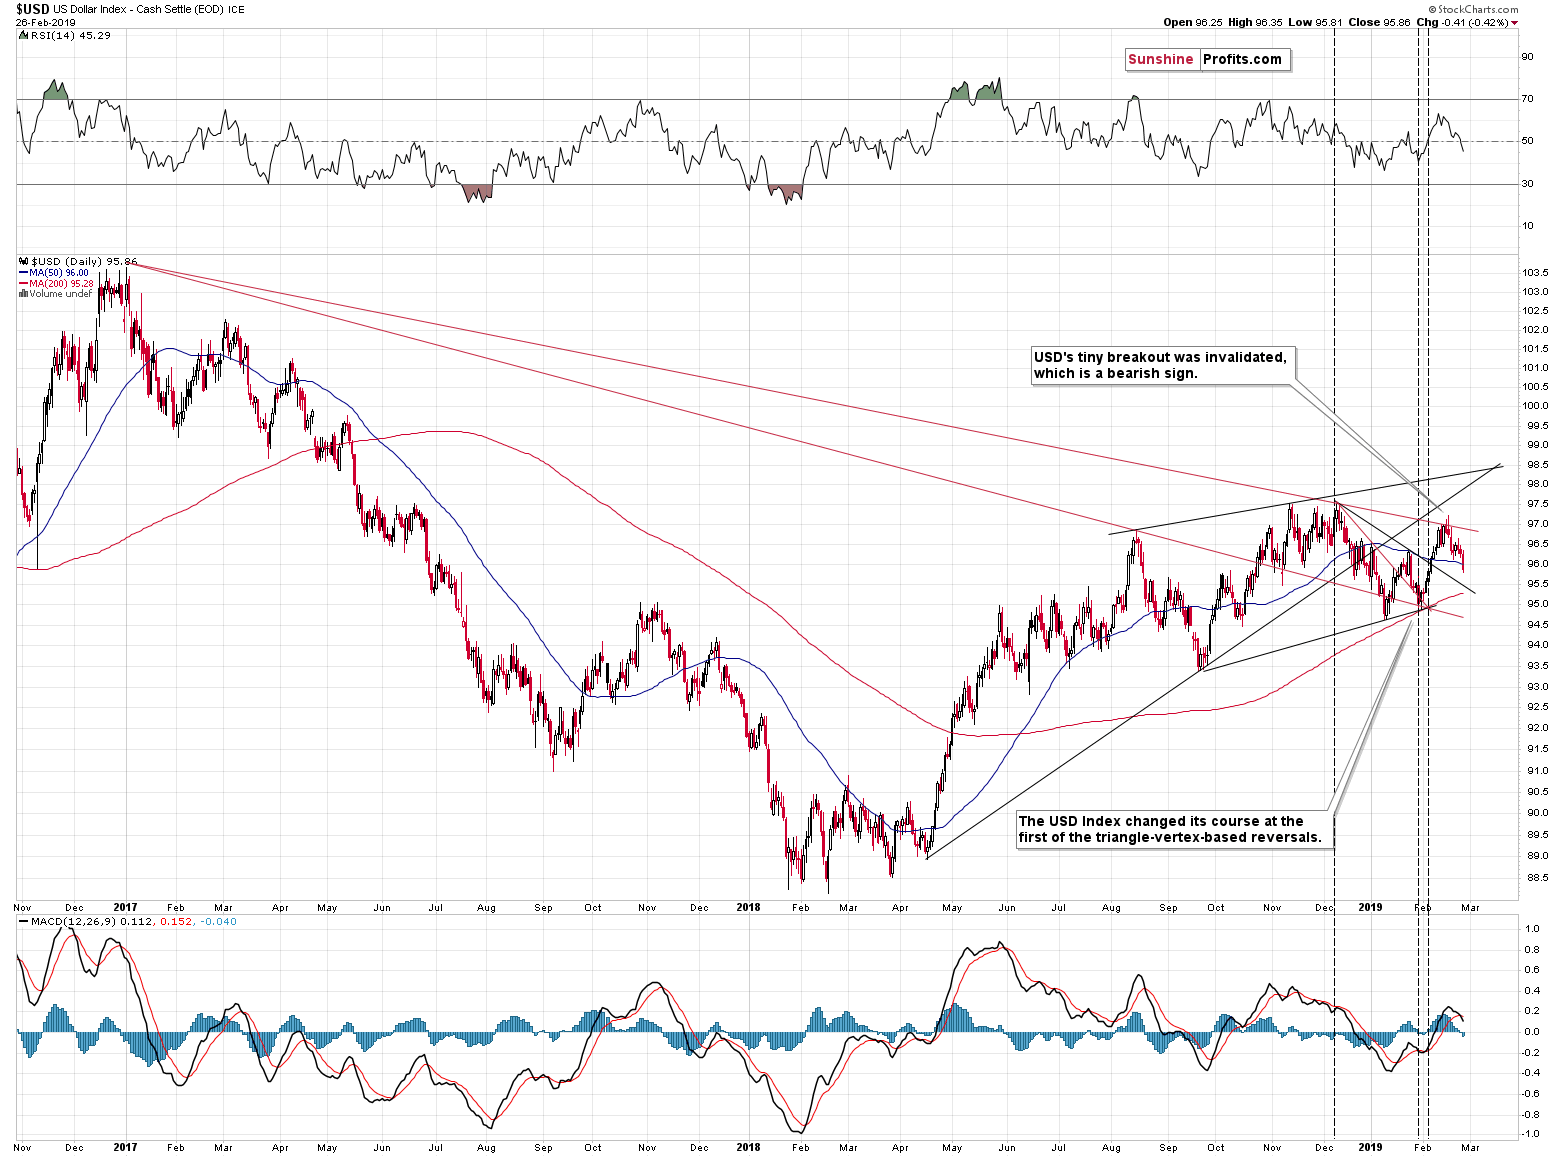
The USD Index was rallying when miners moved lower in mid-February and it topped at that time, which triggered a rally in the precious metals sector. Right now, instead of rallying, the USD Index is after a decline and quite likely to form another local bottom soon. This is not what we saw in mid-February – it’s the opposite thereof.
The intraday performance looks like the miners really wanted to move and break lower, but the declining USD Index simply didn’t let them do so.
And the USDX itself? It may simply be verifying the breakout above the declining short-term support line that we marked with black. In early February it verified an analogous – red – line and bottomed right there.
Let’s not miss the forest while discussing the trees.

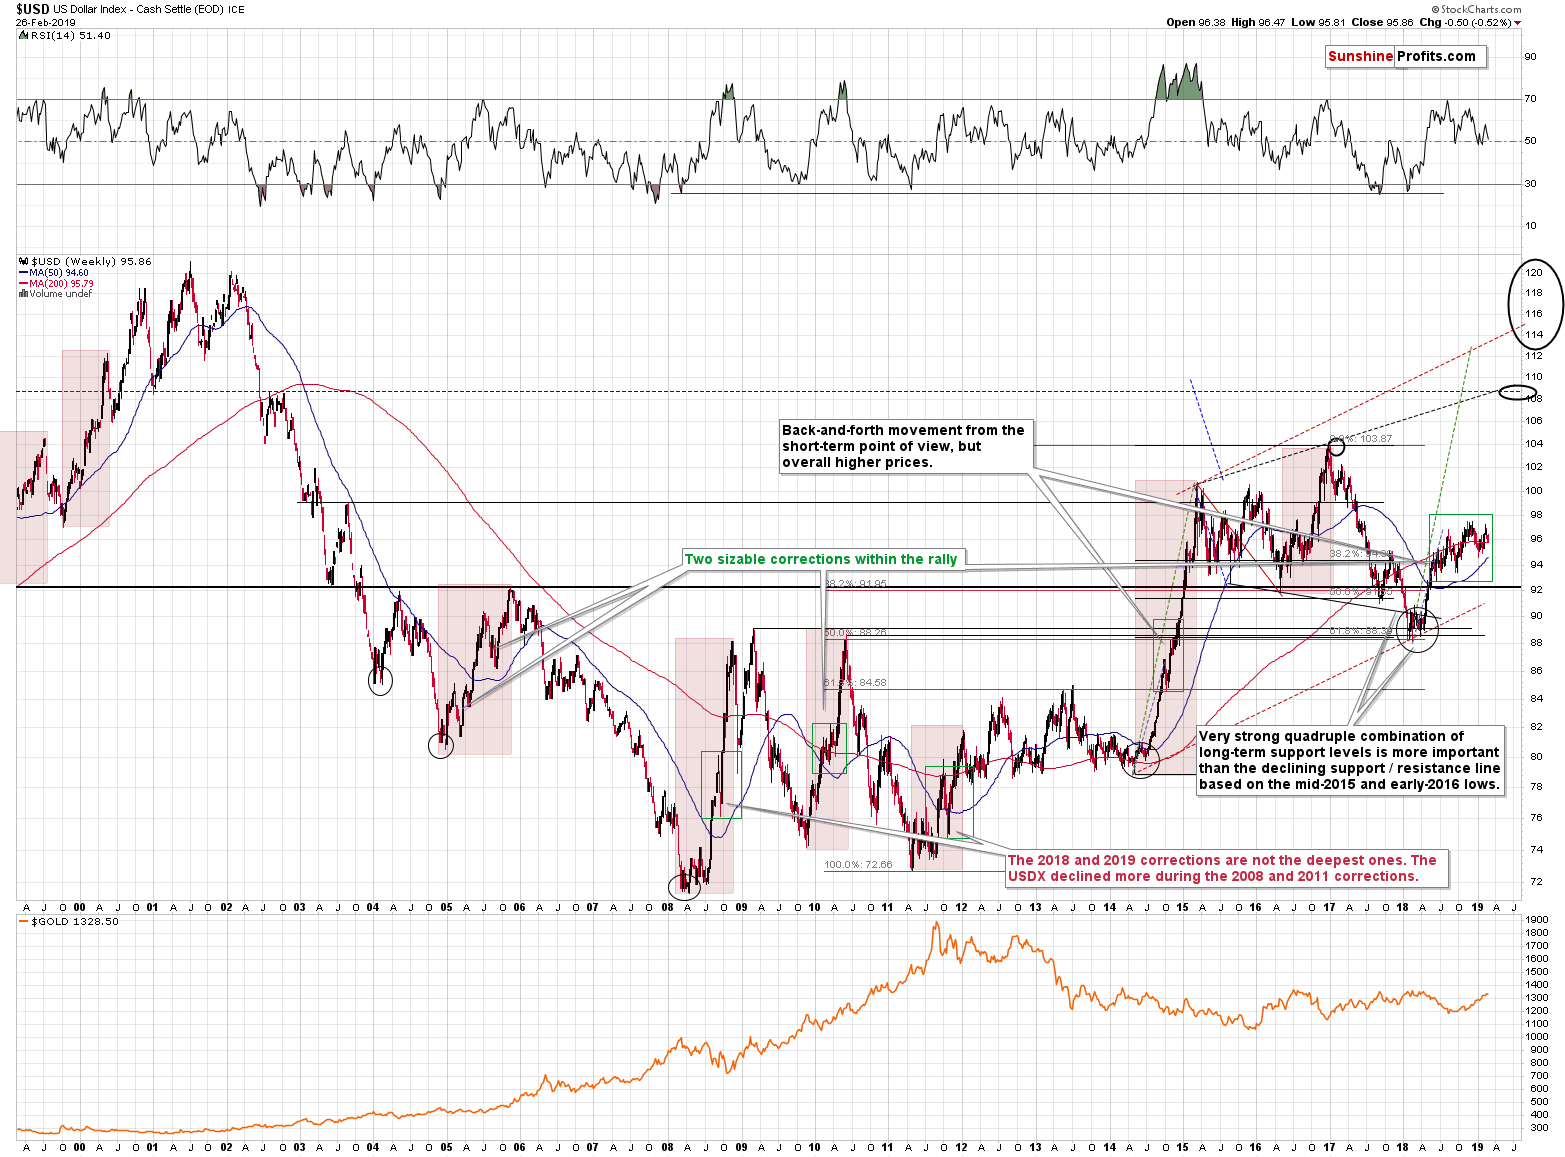
The USD Index is in a medium-term rally and the last couple of months have been a corrective stage of the move. Such corrections are normal in any bigger upswing, and their shape can tell us something about the strength thereof. The fact that the USDX moved higher on average even though it moved sideways from the short-term point of view (forming higher lows and higher highs), attests to the strength of the bulls. Please note that even the Fed’s recent dovish comments didn’t trigger any sizable move lower.
Consequently, the big picture for the USD Index remains bullish, and the short-term picture shows that the USDX may reverse quite soon (the declining short-term support line is at about 95.5). Miners’ reaction to USD’s action also suggests that the precious metals market doesn’t really want to move higher anymore, but that it’s instead ready to resume its medium-term downtrend.
The Many Perspectives of the Gold-USD Correlation
We have recently received one subscriber’s input in the form of a shared article link that discusses the gold-USD correlation. The article aimed to say that gold is bucking is long-term correlation to the dollar and that therefore the gold-dollar link is breaking down as the title boldly claimed. Indeed, the fact is that both gold and USD Index are now higher than they were more than three months ago. In the part of implications for gold, the article summarizes that although it’s generally assumed that this is bullish for gold going forward, gold’s gains since that occurrence weren’t much better than random.
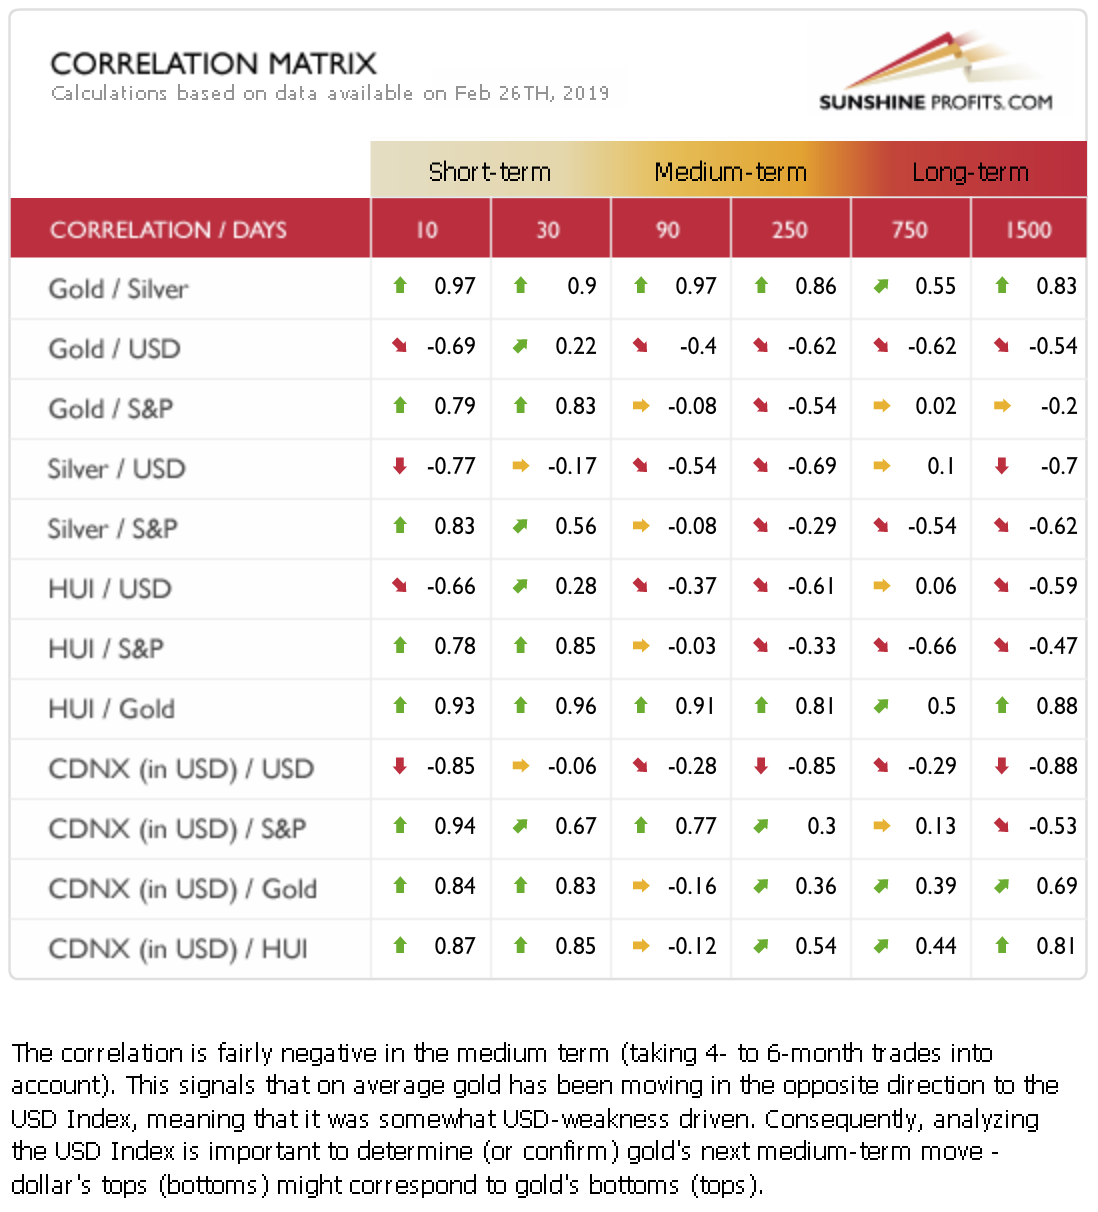
We would like to build on this contribution and provide our perspective. We’ll start by sharing a peek into our in-house developed, proprietary Correlation Matrix. Let’s take a look at several timeframes that explore the gold-USD link as it stands on Feb 27th, 2019:

There are several aspects to reading this tool properly. First, it’s that the shorter the perspective, the more varied readings we get. This concerns mainly the 10-day perspective where the values’ range of mildly negative to strongly negative can change significantly over a few days. This is also valid for the 30-day perspective to a certain extent.
Moving to the medium-term, both the 90-day and 250-day windows provide a more stable panel of readings that we can base our actions on more confidently. The negative value of the gold-USD correlation increases over time, which in other words means that a breakout in USD Index gets caught up to by such a decline in gold that corresponds more closely to the USD breakout over time. Even more briefly said, gold tends to catch up to the USD Index movements more closely over time. This is further supported by the gold-USD effect carryover into the long-term period.
It’s also important to note that the correlation coefficient values evolve over time. It depends on the context of market situation both within gold and USD. It’s however most relevant to judge the current situation through the optics of the current strength and direction of the correlation coefficient and look for support to our decisions in the medium-term universe as that is both stable and relevant enough to taking calculated decisions. It still says that gold is likely to catch up to the downside (and do so more as time passes by) to strengthening USD.
In other words, if it wasn’t for the medium-term uptrend in the USD Index, the implications of the short-term correlation values might be viewed as neutral for gold, but in light of the big USD move that appear to be just around the corner, the short-term link is not as important as the medium-term one. And the latter suggest that gold is likely to catch up with the USDX, by moving substantially lower.
Summary
Summing up, the precious metals sector seems to have reversed its course, but it’s too early to say that this is definitely the case right now. A lot will depend on this week’s signals with regard to short-term developments. The long-term charts continue to point to much lower gold, silver, and mining stock prices in the upcoming weeks and months. Based on the short-term indications, it seems too early to re-open the short positions in case of gold and mining stocks at this time, but it also seems that we are not far from this moment.
Please note that since the medium-term trend remains unaffected by the recent developments and the downside target remains intact (about $890 for gold), the precious metals market is likely to erase everything that it had gained in the last several days, weeks, and months, before THE bottom is in.
As always, we’ll keep you – our subscribers – informed.
To summarize:
Trading capital (supplementary part of the portfolio; our opinion): Full short positions (250% of the full position) in silver are justified from the risk/reward perspective with the following stop-loss orders and exit profit-take price levels:
- Gold: no position, but be prepared to enter the following position: profit-take exit price: $1,062; stop-loss: $1,357; initial target price for the DGLD ETN: $82.96; stop-loss for the DGLD ETN $39.87
- Silver: profit-take exit price: $12.32; stop-loss: $16.44; initial target price for the DSLV ETN: $47.67; stop-loss for the DSLV ETN $23.68
- Mining stocks (price levels for the GDX ETF): no position, but be prepared to enter the following position: profit-take exit price: $13.12; stop-loss: $24.17; initial target price for the DUST ETF: $76.87; stop-loss for the DUST ETF $15.47
Note: the above is a specific preparation for a possible sudden price drop, it does not reflect the most likely outcome. You will find a more detailed explanation in our August 1st Alert. In case one wants to bet on junior mining stocks’ prices (we do not suggest doing so – we think senior mining stocks are more predictable in the case of short-term trades – if one wants to do it anyway, we provide the details), here are the stop-loss details and target prices:
- GDXJ ETF: profit-take exit price: $17.52; stop-loss: $35.67
- JDST ETF: initial target price: $143.87 stop-loss: $30.97
Long-term capital (core part of the portfolio; our opinion): No positions (in other words: cash)
Insurance capital (core part of the portfolio; our opinion): Full position
Important Details for New Subscribers
Whether you already subscribed or not, we encourage you to find out how to make the most of our alerts and read our replies to the most common alert-and-gold-trading-related-questions.
Please note that the in the trading section we describe the situation for the day that the alert is posted. In other words, it we are writing about a speculative position, it means that it is up-to-date on the day it was posted. We are also featuring the initial target prices, so that you can decide whether keeping a position on a given day is something that is in tune with your approach (some moves are too small for medium-term traders and some might appear too big for day-traders).
Plus, you might want to read why our stop-loss orders are usually relatively far from the current price.
Please note that a full position doesn’t mean using all of the capital for a given trade. You will find details on our thoughts on gold portfolio structuring in the Key Insights section on our website.
As a reminder – “initial target price” means exactly that – an “initial” one, it’s not a price level at which we suggest closing positions. If this becomes the case (like it did in the previous trade) we will refer to these levels as levels of exit orders (exactly as we’ve done previously). Stop-loss levels, however, are naturally not “initial”, but something that, in our opinion, might be entered as an order.
Since it is impossible to synchronize target prices and stop-loss levels for all the ETFs and ETNs with the main markets that we provide these levels for (gold, silver and mining stocks – the GDX ETF), the stop-loss levels and target prices for other ETNs and ETF (among other: UGLD, DGLD, USLV, DSLV, NUGT, DUST, JNUG, JDST) are provided as supplementary, and not as “final”. This means that if a stop-loss or a target level is reached for any of the “additional instruments” (DGLD for instance), but not for the “main instrument” (gold in this case), we will view positions in both gold and DGLD as still open and the stop-loss for DGLD would have to be moved lower. On the other hand, if gold moves to a stop-loss level but DGLD doesn’t, then we will view both positions (in gold and DGLD) as closed. In other words, since it’s not possible to be 100% certain that each related instrument moves to a given level when the underlying instrument does, we can’t provide levels that would be binding. The levels that we do provide are our best estimate of the levels that will correspond to the levels in the underlying assets, but it will be the underlying assets that one will need to focus on regarding the signs pointing to closing a given position or keeping it open. We might adjust the levels in the “additional instruments” without adjusting the levels in the “main instruments”, which will simply mean that we have improved our estimation of these levels, not that we changed our outlook on the markets. We are already working on a tool that would update these levels on a daily basis for the most popular ETFs, ETNs and individual mining stocks.
Our preferred ways to invest in and to trade gold along with the reasoning can be found in the how to buy gold section. Additionally, our preferred ETFs and ETNs can be found in our Gold & Silver ETF Ranking.
As a reminder, Gold & Silver Trading Alerts are posted before or on each trading day (we usually post them before the opening bell, but we don't promise doing that each day). If there's anything urgent, we will send you an additional small alert before posting the main one.
=====
Latest Free Trading Alerts:
Barrick wants to buy Newmont. Trump wants a deal with China. Palladium wants to fly into space. And what does gold want?
=====
Thank you.
Sincerely,
Przemyslaw Radomski, CFA
Editor-in-chief, Gold & Silver Fund Manager


